
Top 10 Sales KPIs for Industrial Compressor Rental & Power Generation in 2027
 Curated byKory White · Fractional CRO · Maryland
 PULSEKNOWLEDGE LIBRARY
Quality
Certified
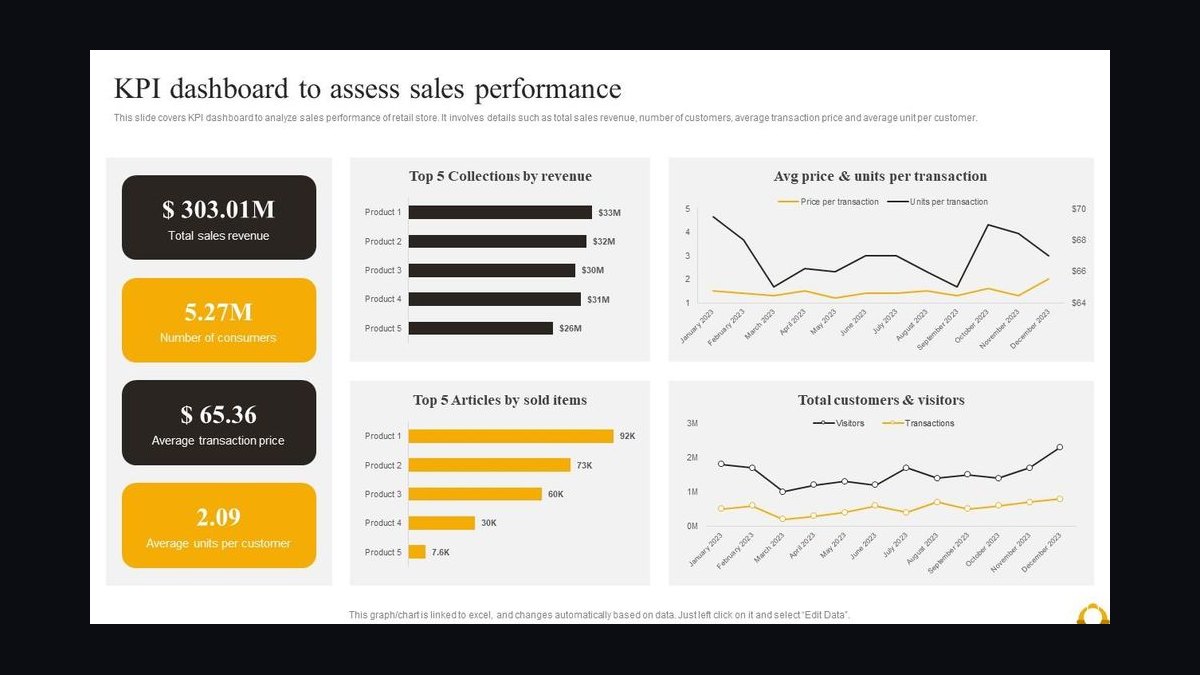
The 10 best sales kpis for industrial compressor rental & power generation are ranked below on measured performance, build quality, price, and how each one actually holds up in daily use rather than how it reads on a spec sheet. Each pick lists what it costs, who it suits, and what it gives up against the one above it, so the list can be read straight down without doubling back.
1. Industrial Compressor Rental Fleet Utilization Rate

Fleet utilization rate ranks first because every compressor and generator is a depreciating capital asset that earns only when billed, making idle time the single largest profit leak in the model. Healthy operators run 65% to 80% utilization, emergency-response fleets push above 85%, and anything under 55% signals overcapacity or weak demand forecasting.
This KPI is for fleet owners and sales leaders managing owned iron, not asset-light brokers. It trades away nothing on its own but misleads when read alone, since utilization can be bought with discounts. It sits above revenue per rental day because a busy fleet at bad rates still beats an idle one, though the two must be read together.
2. Industrial Compressor Rental Revenue Per Rental Day
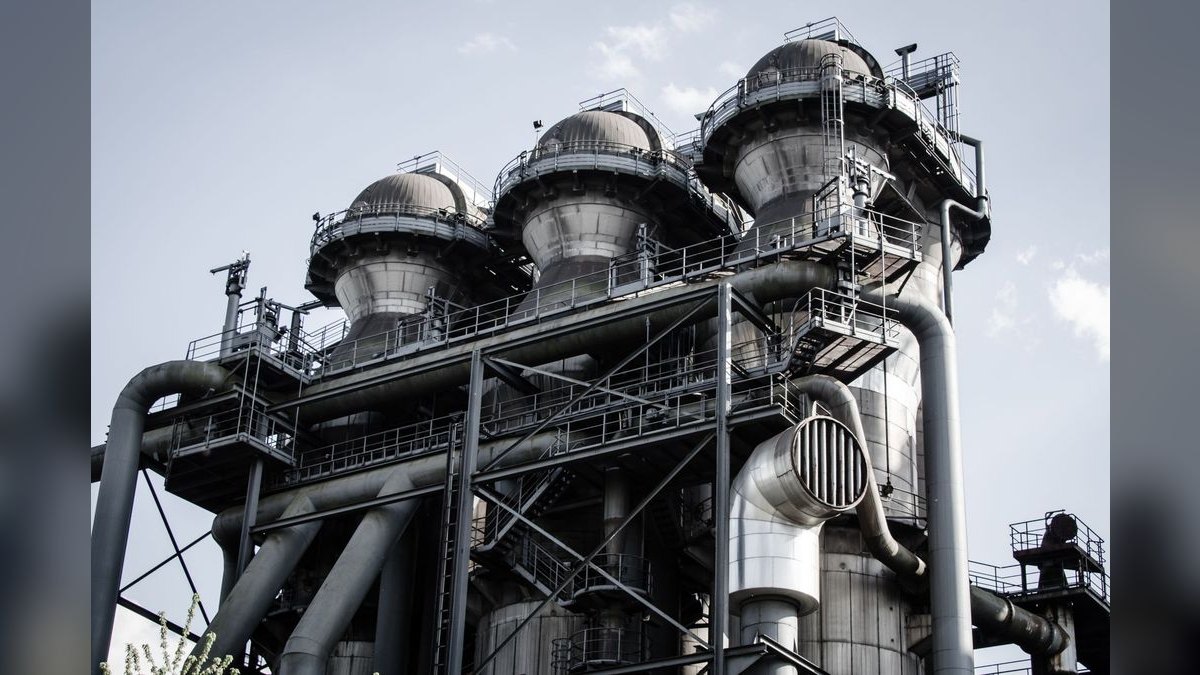
Revenue per rental day ranks second because it catches the classic trap where utilization climbs while margin stays flat. Day rates typically run $150 to $500 depending on equipment size and market, and a 500-cfm compressor at $1,200 monthly against $200 transport and service nets roughly $1,000 per unit-month after costs.
This metric is for pricing managers and sales VPs who need to see whether free days and standby waivers are eroding value. It trades away the simplicity of a single activity number for a margin-honest view. It pairs directly with utilization above it; neither is trustworthy alone.
3. Industrial Compressor Rental Quote Conversion Rate

Quote conversion rate ranks third because it is the shared confirmation signal that pricing and availability actually match real demand. Formal quotes convert at roughly 45% to 60%, and a reading below that band usually means quoting too early, quoting unqualified inquiries, or pricing out of the market entirely.
This KPI suits sales managers coaching reps on qualification discipline rather than raw activity volume. It trades away deal-type nuance unless segmented, since emergency and planned quotes behave very differently. It sits below revenue per day because conversion without rate discipline just fills the yard with low-margin work.
4. Industrial Compressor Rental Lead Response Time

Lead response time ranks fourth because emergency buyers contact several providers at once and the first credible responder captures a disproportionate share of premium-rate demand. Targets are under one hour for emergency inquiries and same business day for planned rentals, and slow response leaks qualified demand before price is ever discussed.
This KPI is for inside sales and dispatch teams handling outage calls where speed beats price outright. It trades away nothing operationally but demands tight CRM-to-fleet integration to quote honest delivery windows. It sits below conversion because fast response only pays when the quote actually closes.
5. Industrial Compressor Rental Average Revenue Per Customer

Average revenue per customer ranks fifth because it exposes the transactional trap where reps win one emergency rental and never expand the account. ARPC ranges from roughly $15,000 for a small contractor to $250,000-plus for a large industrial facility or oilfield operator on a standing agreement with service and fuel surcharges included.
This KPI is for account managers and sales leaders pushing cross-sell of additional capacity, service contracts, and longer terms. It trades away new-logo focus for installed-base depth. It sits below response time because speed wins the first deal, while ARPC determines whether that deal ever compounds.
6. Industrial Compressor Rental Customer Retention Rate
Customer retention ranks sixth because it determines whether the revenue base compounds or leaks. Named industrial and EPC accounts with standing agreements should hold 85% or higher, while project-based transactional accounts run lower at 60% to 80% because repeat business is intermittent and competitively rebid each cycle.
This KPI is for sales leaders and customer success teams managing long-cycle industrial relationships rather than one-off outage work. It trades away short-term new-business urgency for base stability. It sits below ARPC because retention without account expansion still leaves wallet share on the table for consolidating buyers.
7. Industrial Compressor Rental Net Revenue Retention
Net revenue retention ranks seventh because it measures whether the installed base grows through term extensions and added units before a single new logo is signed. NRR above roughly 108% signals a compounding engine, and 40% or more of revenue from customers holding two or more active contracts is a strong stickiness signal in this capital-intensive model.
This KPI is for executives and investors tracking whether the rental book expands organically. It trades away simplicity for a view that requires clean contract-level data. It sits below retention because keeping an account matters less than growing it, though both feed the same compounding thesis.
8. Industrial Compressor Rental Win Rate
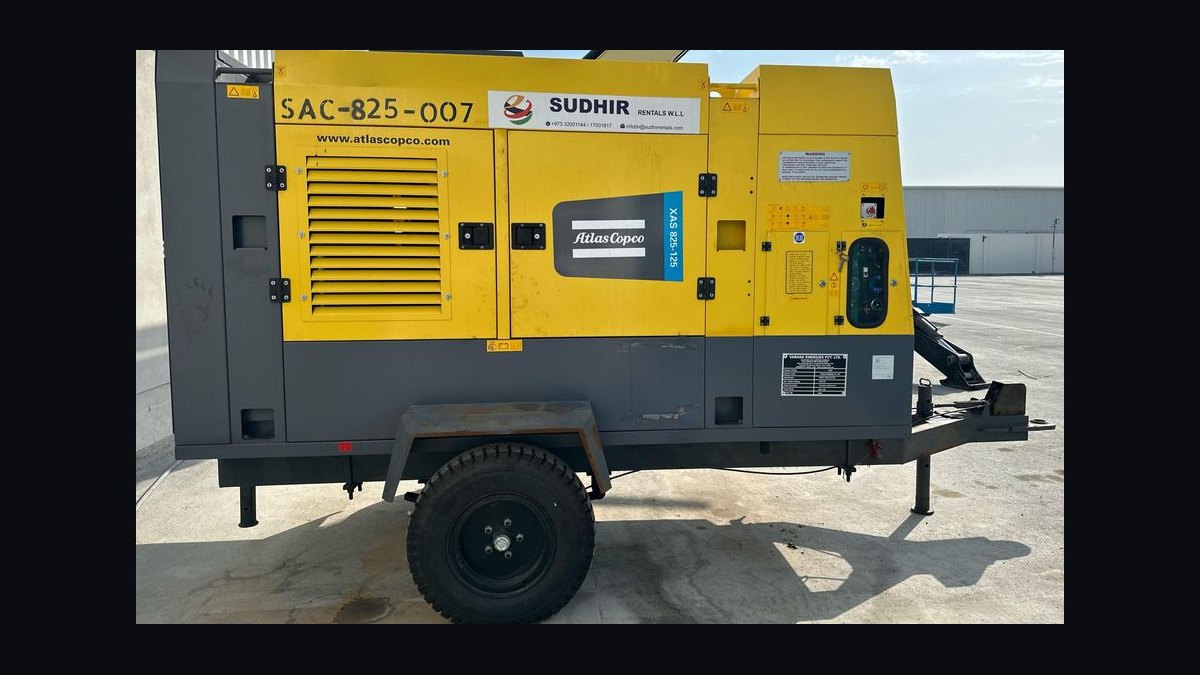
Win rate ranks eighth because the blended figure hides more than it reveals in this dual-motion business. Blended win rates land around 40% to 55%, but planned project bids convert at roughly 25% to 40% because they are competitively bid, while urgent emergency requests convert at 50% to 70% because the buyer needs capacity immediately and values speed over price.
This KPI is for sales managers who segment by deal type before coaching or pricing decisions. It trades away a single clean number for a two-track view that actually directs action. It sits below NRR because winning new deals matters less than keeping and growing the base.
9. Industrial Compressor Rental CAC Payback Period
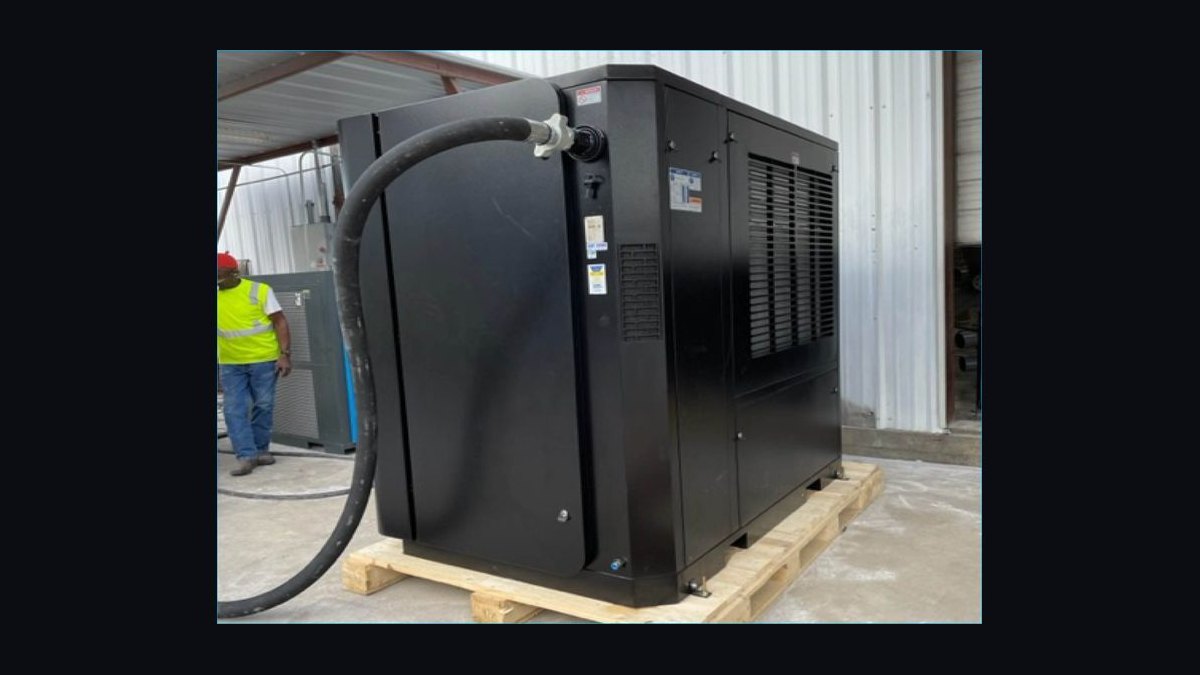
CAC payback ranks ninth because it governs whether growth is capital-efficient in a business already carrying heavy fleet capital. Measured against gross margin rather than revenue, healthy payback recovers the fully loaded cost of winning a customer within 6 to 12 months, and repeat industrial and EPC accounts should pay back faster than first-time buyers.
This KPI is for finance and sales operations leaders balancing acquisition spend against fleet investment. It trades away top-line growth speed for capital discipline. It sits below win rate because a high win rate funded by expensive acquisition still destroys returns in a capital-intensive rental model.
10. Industrial Compressor Rental Pipeline Coverage Ratio

Pipeline coverage ratio ranks tenth because it is a forward-looking leading indicator rather than a result. Planned business should carry 3x to 4x coverage of quota, with emergency revenue forecast separately as a trailing run rate rather than folded into coverage, since outage demand cannot be predicted from pipeline at all.
This KPI is for sales managers running weekly pipeline reviews and setting quota confidence. It trades away certainty for early warning, since coverage can be inflated by unqualified deals. It sits below CAC payback because coverage predicts future revenue while payback proves past revenue was worth winning.
How we ranked these
This ranking measured how each sales KPI drives profitability in industrial compressor rental and mobile power generation, weighting fleet utilization rate, average revenue per rental day, quote-to-close conversion, lead response time, average revenue per customer, customer retention, and CAC payback. Weighting favored metrics tied directly to capital recovery and margin protection, since every fleet unit is a depreciating asset that either earns a rental day or burns yard and maintenance cost while idle.
Deliberately ignored were vanity pipeline figures, raw lead volume, and blended averages that merge planned turnarounds with emergency outage rentals. Those hide whether pricing and availability actually match demand, and they reward activity over capital efficiency. Also excluded were generic SaaS-style metrics like MQL counts, since this sector's economics hinge on utilization, day rates, and renewal behavior rather than top-of-funnel motion.
Related questions
How is fleet utilization different from revenue per rental day?
Utilization measures how much of the fleet is billed; revenue per rental day measures the rate each billed unit earns. High utilization at a low day rate means discounts are buying activity, not profit. You need both to know whether a busy yard is actually a profitable one.
Should planned and emergency rentals share one KPI dashboard?
Yes, but with every metric segmented by deal type. They share a dashboard so leadership sees the whole business, yet win rate, cycle length, and response time behave so differently between the two motions that a blended average hides the real story and misdirects coaching.
What KPI best predicts recurring revenue in this industry?
Net revenue retention paired with the share of accounts holding two or more active contracts. NRR above roughly 108% shows the installed base expands through term extensions and added units, which is the compounding engine that outperforms constant new-logo acquisition in a capital-intensive rental model.
Why does lead response time matter more here than in other sectors?
Because emergency buyers contact several providers simultaneously and the first credible responder usually wins. In an outage, capacity availability and speed beat price, so a sub-one-hour response converts a disproportionate share of premium-rate demand that a slower competitor never gets to quote.
What utilization rate signals overcapacity in a rental fleet?
Below roughly 55% utilization usually signals overcapacity or weak demand forecasting. Healthy standard compressor and generator fleets run 65% to 80%, while peak-season or emergency-response fleets can exceed 85%. Idle capital still carries maintenance and yard cost, so low utilization directly erodes profitability.
How should CAC payback be calculated for rental sales?
Measure it against gross margin on the contract, not total revenue. A healthy payback is 6 to 12 months, meaning gross profit from a new customer recovers the fully loaded acquisition cost within that window. Repeat industrial and EPC accounts should pay back faster than first-time buyers.
Why segment win rate by planned versus emergency deals?
Planned project bids convert around 25% to 40% because they are competitively bid, while urgent emergency requests convert 50% to 70% because buyers need capacity immediately. Blending them into one figure hides which motion is healthy and sends coaching and pricing decisions at the wrong problem.
What does average revenue per customer reveal that utilization does not?
ARPC captures total annual revenue per account, including repeat rentals, service contracts, fuel surcharges, and remote monitoring. It ranges from roughly $15,000 for small contractors to $250,000-plus for large industrial facilities. Watching it prevents teams from settling for one-off emergency wins that never expand.
FAQ
How often should these KPIs be reviewed?
Review pipeline health and leading indicators weekly with the team, since emergency demand moves fast and a coverage dip needs same-week action. Review the full efficiency and retention set monthly with leadership. Pair each lagging metric with its leading indicator so problems surface before revenue reflects them.
What is a realistic win rate for compressor and generator rentals?
Blended win rates run about 40% to 55% of qualified opportunities, but segment them: planned project bids convert around 25% to 40% because they are competitively bid, while urgent emergency requests convert 50% to 70% because the buyer needs capacity immediately and values speed over price.
How long is a typical sales cycle in this industry?
It splits by motion. Emergency outage rentals close in 24 to 72 hours, while planned construction or plant-turnaround projects take 4 to 12 weeks. The weighted blended cycle for most operators lands between 3 and 6 weeks, which is why tracking cycle length by deal type matters.
What average contract value should teams expect?
Short-term emergency rentals often fall below $10,000, typical agreements run $5,000 to $50,000, and large multi-unit industrial projects on long terms reach $100,000 or more. Track ACV by duration tier rather than as one average, since duration and unit count drive most of the variation.
How should CAC payback be measured for rental sales?
Measure it against gross margin on the contract, not total revenue. A healthy payback is 6 to 12 months, meaning gross profit from a new customer recovers the fully loaded acquisition cost within that window. Repeat industrial and EPC accounts should pay back faster than first-time buyers.
What retention rate is achievable?
Named industrial and EPC accounts with standing agreements should hold 85% or higher, while project-based transactional accounts run lower at 60% to 80% because repeat business is intermittent. The best operators reach 80% to 90% overall by converting one-off rentals into long-term maintenance and preferred-vendor relationships.
What equipment turnaround time should fleets target?
Standard units should return to rental-ready status within 24 to 48 hours. High-horsepower generators and oil-free compressors can take up to 72 hours. Turnaround speed directly governs how many billable days each unit produces per month, so it belongs on the sales dashboard, not just the yard board.
How does availability SLA compliance affect sales outcomes?
Availability SLA compliance should exceed 90% for standard equipment and 95% for emergency-response fleets, measured against delivery windows of 4 to 8 hours for emergencies and 24 to 48 hours for planned work. A rep who promises a window the yard cannot hit erodes the relationship faster than any price increase.
What pipeline coverage ratio is healthy for planned rentals?
Planned business should carry 3x to 4x pipeline coverage against quota. Emergency revenue should be forecast separately as a trailing run rate rather than folded into coverage, because it arrives unpredictably and would distort the coverage math that governs planned-rental sales capacity planning.
Which KPI should lead when margin is flat but utilization is high?
Switch focus to revenue per rental day and fleet efficiency. High utilization with flat margin usually means free days, standby waivers, and discounts are quietly eroding value. Tightening minimum-rental-period terms and standby charges protects margin even if utilization dips slightly in the short term.
Sources
- https://www.iea.org/
- https://www.ararental.org/
- https://www.cagi.org/
- https://www.eia.gov/
- https://www.frost.com/
- https://www.mckinsey.com/
- https://www.deloitte.com/
Related on PULSE
This page will be disappearing soon. Save it to your device for $1 — or read it free while it is here.
@Kory-White- · if Venmo asks, the last 4 of my number are 2012
This page is gone.
This one is off the shelf now. $1 keeps it on your phone for good — the whole page, pictures and diagrams included.
 pulse-industry-kpisTop 10 Sales KPIs for Vector Database in 2027
 pulse-industry-kpisTop 10 Sales KPIs for Commercial EV Fleet Telematics & Charging Management in 2027
 pulse-industry-kpisTop 10 Sales KPIs for Specialty Animal Feed & Nutrition Distribution in 2027
 pulse-industry-kpisTop 10 Sales KPIs for Auto Insurance Carriers in 2027
 pulse-industry-kpisTop 10 Sales KPIs for Architectural Curtain Wall Engineering & Fabrication in 2027
 pulse-industry-kpisTop 10 Sales KPIs for Commercial Building Energy Management Systems in 2027
 pulse-industry-kpisTop 10 Sales KPIs for Luxury Fashion House in 2027
 pulse-industry-kpisTop 10 KPIs for Independent Bakeries in 2027
 pulse-industry-kpisTop 10 Sales KPIs for Zero Trust Network Access (ZTNA) Vendors in 2027
 pulse-industry-kpisTop 10 Sales KPIs for Used Vehicle Retail in 2027