


How do you calculate true pipeline coverage when usage-based deals have variable ACV in 2027?
Quality
Certified

To calculate true pipeline coverage with usage-based deals, don't use a single ACV per opportunity — model each deal as a range (low/likely/high estimated ACV from historical consumption data), sum the probability-weighted values, then divide by your target: coverage = weighted pipeline value ÷ quota target. This corrects for variable ACV instead of pretending it's fixed.
What it is and why it matters
Pipeline coverage is the ratio of open pipeline value to a sales target for a given period — the classic rule of thumb is 3x to 4x coverage to comfortably hit quota, accounting for average win rates and deal slippage. That math works cleanly when every deal has a known, fixed ACV: ten deals at $50,000 each is $500,000 of pipeline, full stop. Usage-based pricing breaks this assumption at the root. A deal's eventual ACV isn't set at signature — it's a function of how much the customer actually consumes, which depends on adoption speed, seat expansion, API call volume, or storage growth that nobody can fully predict at the proposal stage.
This matters because RevOps leaders who report a single static coverage number for usage-based pipeline are usually reporting a fiction. If you assume every deal closes at its "sticker" or committed-minimum ACV, you systematically overstate coverage, because usage-based contracts routinely start below their ceiling and ramp over months. If you instead assume every deal closes at its maximum modeled usage, you understate risk and set the sales team up to miss because reps chase inflated deal sizes. The honest answer sits between those extremes, and getting there requires treating ACV as a distribution, not a point estimate, then propagating that uncertainty into the coverage ratio itself rather than papering over it with a single confident-sounding multiple.

The practical stakes are forecasting accuracy and quota-setting integrity. When finance and sales leadership plan headcount, marketing spend, and board commitments off a coverage number, a usage-based book that's actually running at 2.1x real coverage while the dashboard says 4x creates a shortfall nobody sees coming until the quarter is nearly over. Getting the calculation right is what separates a RevOps function that catches revenue risk early from one that discovers it in the close-out meeting.
The step-by-step process
Building an honest coverage number for a usage-based book is a five-step exercise, and skipping any step reintroduces the same static-ACV distortion you're trying to eliminate.
Step 1 — Segment the pipeline by deal type. Split fixed-ACV deals from usage-based deals immediately; never blend them into one pool. Fixed deals keep the traditional calculation. Usage-based deals get the process below.

Step 2 — Build a three-point ACV estimate per usage deal. For each open usage-based opportunity, generate a low, likely, and high projected ACV using the closest available signal: the prospect's own trial or pilot consumption data if you have it, or the historical usage curve of the three to five most similar closed-won accounts (similar headcount, similar use case, similar industry) if you don't. A common convention is to set the low estimate near 70% of the median usage observed in comparable accounts and the high estimate near 130%, adjusting those bands as your own historical data matures.
Step 3 — Weight and sum. Apply a weighting scheme to the three points — a simple approach uses a triangular distribution (low, likely, high) and takes the expected value, roughly (low + 4×likely + high) ÷ 6. Sum the expected values across every open usage-based deal to get a single weighted pipeline figure for that segment.
Step 4 — Add the fixed-ACV pipeline back in. Combine the weighted usage-based sum with the traditional fixed-ACV pipeline total to get total weighted pipeline value.
Step 5 — Divide by target and sanity-check against tiers. Divide the combined total by the period's quota target to get your coverage ratio, then cross-check it against a tiered view (see the diagram below) so one enormous, uncertain usage deal can't single-handedly make the whole number look healthy.

Run this calculation at least monthly, and weekly during high-velocity periods, because usage data changes faster than a static forecast cadence can capture. A coverage number that's a quarter old on a usage-based book is close to meaningless.
Costs, timelines, and typical ranges
Standing this process up is mostly a time and tooling investment rather than a hard-dollar one, but it isn't free, and RevOps should budget realistically.
Timeline to first honest number: Expect two to four weeks for the initial build. Week one is pulling historical usage-to-ACV data from billing or the usage-metering platform for every closed-won deal in the last twelve months — this is the single biggest time sink because usage data often lives in a separate system (Stripe, Metronome, a homegrown metering table) that doesn't talk to the CRM. Weeks two and three are building the tier bands and the three-point estimation logic, then back-testing it against deals that have already closed to see how close the weighted estimate landed to actual realized ACV. Week four is rolling it into the actual pipeline report reps and managers look at.

Ongoing cost: Once built, updating the model monthly takes a competent RevOps analyst two to four hours if the billing-to-CRM data pipeline is automated, or a full day or more if usage figures have to be manually exported and reconciled. If you're using a spreadsheet-based Monte Carlo approach (500 to 1,000 random draws per deal), a single analyst can run this in Excel or Google Sheets in under an hour once the template exists; a full Monte Carlo build in Python with numpy for a large book (hundreds of open deals) typically runs in seconds to minutes of compute time, so the cost is entirely the analyst hours to build and maintain it, not infrastructure.
Typical coverage ranges: For established, well-understood usage tiers with a year or more of closed-deal history to calibrate against, 3x to 4x weighted coverage is a reasonable target, matching traditional fixed-ACV benchmarks. For new or unproven usage tiers — a new product line, a new customer segment, a pricing model that's been live less than two quarters — push the target to 5x or 6x to compensate for the wider variance in your low/high ACV bands. As your historical dataset matures and your low-high spread narrows quarter over quarter, you can safely bring that multiple back down toward the standard range.
Accuracy improvement over time: Teams that maintain a rolling adjustment factor (comparing initial pipeline estimates to actual realized ACV six months later) typically see their estimation error shrink meaningfully within two to three quarters of consistent tracking, since the model recalibrates itself against real outcomes rather than staying fixed at its original assumptions.
Where teams get it wrong

The most common failure is using the contract's maximum committed usage tier as the deal's ACV for coverage purposes. Sales teams like reporting big numbers, and a usage contract with a $200,000 ceiling looks great in a pipeline report — but if comparable accounts historically land at 40% of ceiling in year one, that deal is really worth closer to $80,000 for coverage math. Reporting the ceiling number inflates coverage and sets up a miss that only becomes visible when invoicing starts.
A second common mistake is the opposite distortion: using only the contractual minimum commit as ACV, which understates coverage and can cause a team to over-pipeline, chasing deals it doesn't need and diluting rep focus on the opportunities that matter. Both errors come from treating a variable outcome as a fixed point instead of building the low/likely/high range described above.
Third, teams frequently blend usage-based and fixed-ACV deals into one coverage ratio without segmentation, which hides which part of the book is actually solid and which part is speculative. A blended 4x that's really "5x fixed, 2.5x usage" is masking a real risk in the usage segment that leadership needs visibility into separately.

Fourth is failing to refresh ACV estimates as real usage data comes in post-close. The estimate at proposal stage is a forecast; the actual consumption six months after close is ground truth. Teams that never close that loop keep making the same estimation error quarter after quarter because nothing forces the model to learn. Building a lagged-actuals adjustment factor — comparing initial estimates to what deals actually billed six months out, and applying that correction factor to current open pipeline — is the single highest-leverage fix for this failure mode, and it's the one step teams skip most often because it requires patience across multiple sales cycles before it produces a usable factor.
Fifth, some teams run the Monte Carlo or tiered math correctly but never reconcile it against a single, simple sanity number — for instance the trailing four-quarter average of realized ACV as a percentage of initial pipeline estimate. Sophisticated modeling without a simple cross-check can drift silently for months before anyone notices the underlying assumptions have gone stale.
Decision framework: when to choose what
Not every RevOps team needs a full Monte Carlo simulation, and not every team can get away with simple tiering. Match the method to your deal volume, data maturity, and the variance you're actually seeing in the book.

Use tiered coverage (segmenting deals into 3–4 usage bands with a conservative ACV estimate per tier) when your usage-based deal volume is moderate, your historical closed-deal dataset is thin (fewer than roughly 50 closed usage-based deals to calibrate against), or you need something a sales manager can read and act on in a weekly forecast meeting without a statistics background. This is the right starting point for most teams and can be built in a standard CRM report plus a spreadsheet.
Use Monte Carlo simulation once you have enough historical deals (typically 50-plus) to fit reasonable probability distributions per tier, your deal count is high enough that manual tiering becomes unwieldy, or leadership needs percentile-based risk framing (median case, conservative 25th percentile, optimistic 75th percentile) for board or investor reporting. This is more rigorous but requires either comfort with numpy/Python or an Excel add-in like @RISK, plus someone who can explain percentile output to a sales leadership team that's used to a single number.
Use rolling lagged-actuals adjustment in every scenario, regardless of which primary method you choose, once you have at least two to three quarters of closed usage-based deals with six-plus months of post-close billing history. This is the self-correcting layer that keeps either method honest over time and should be treated as a permanent addition to your process, not an either/or alternative to tiering or simulation.
Whichever method you pick, the deliverable to leadership should never be a single confident multiple for usage-based pipeline — it should be a range, with the primary weighted number and a note on the confidence interval, so decisions made against that coverage figure account for the real variability underneath it.
Related questions

How do you set quota when a meaningful share of bookings is usage-based?
Set the fixed portion of quota using traditional methods, and set the usage-based portion against the weighted (not ceiling) ACV estimate described above, then true it up against realized usage each quarter as your calibration data improves.
What win rate should I assume for usage-based deals in my coverage math?
Use the historical win rate specific to usage-based opportunities in your CRM, not your blended company-wide win rate — usage deals often close at different rates than fixed-price deals due to longer evaluation or pilot periods.
How is ARR different from ACV for a usage-based contract?
ACV is the estimated annual value of one contract; ARR is the aggregate run-rate value across your whole customer base. For usage-based accounts, ARR should be built from actual trailing consumption, not from the original ACV estimate at signing.
Should forecast categories treat usage-based deals differently than fixed-price deals?

Yes — a usage-based deal in "Commit" should require actual usage or pilot consumption evidence, not just a signed minimum commit, since the real revenue outcome depends on adoption that a signature alone doesn't guarantee.
How often should I recalibrate my low/likely/high ACV bands?
Recalibrate quarterly at minimum, using the most recently closed cohort's actual six-month usage data, so the bands reflect current product adoption patterns rather than assumptions from a year or more ago.
FAQ
What is the main challenge with pipeline coverage for usage-based deals? ACV isn't fixed at signature, so a static coverage ratio built on committed or ceiling values misrepresents the book. You need a weighted or probabilistic estimate per deal, calibrated against historical consumption, to get a coverage number that reflects likely outcomes rather than contractual best-or-worst cases.
How do I estimate the ACV for a usage-based deal still in the pipeline? Use the prospect's own trial or pilot usage data when available; otherwise use the usage curve of your closest comparable closed-won accounts. Build a low (roughly 70% of median comparable usage), likely, and high (roughly 130%) scenario, then weight them into a single expected value.
Should I report a single coverage ratio or multiple scenarios?

Report at least two: a primary weighted-average coverage number for day-to-day forecasting, and a conservative (low-estimate) coverage number for board or risk conversations. The gap between them tells leadership how much uncertainty is actually baked into the usage-based book.
How often should I update pipeline coverage for usage-based deals? Monthly at minimum; weekly if your product has high-velocity usage changes (new feature adoption, seasonal consumption spikes). Refresh the underlying ACV estimates every time new usage or billing data becomes available, not on a fixed calendar alone.
What's a realistic coverage target for a usage-based pipeline? 3x to 4x weighted coverage for tiers you have a full year of history to calibrate, and 5x to 6x for new or unproven tiers where your low/high ACV spread is still wide. Tighten the target back down as your historical dataset matures.
How do I avoid overstating coverage because of variable ACV? Never use the maximum possible or ceiling ACV as the deal's coverage value. Use a weighted estimate discounted from the top-line projection (often 20–30% below ceiling, calibrated from your own closed-deal history), and track actual-versus-projected ACV every quarter to keep recalibrating the discount.
Sources
- https://www.salesforce.com/sales/analytics/pipeline-management/
- https://www.gartner.com/en/sales/topics/sales-forecasting
- https://www.saastr.com/
- https://blog.hubspot.com/sales/sales-pipeline
- https://www.mckinsey.com/capabilities/growth-marketing-and-sales/our-insights
- https://openviewpartners.com/blog/
- https://www.bvp.com/atlas
- https://www.profitwell.com/recur/all
Related on PULSE
- What's a realistic quota-to-pipeline ratio for a usage-based SaaS motion?
- How do you build forecast categories that account for consumption ramp, not just deal stage?
- How do you calculate 'true' LTV when you have variable churn by cohort age, and some customers never expand?
- What is the right base/variable split for an AE selling usage-based contracts?
- How do you structure variable comp for channel partners who co-sell rather than resell?
- How do you build a Monte Carlo revenue forecast without a dedicated data science team?
This page will be disappearing soon. Save it to your device for $1 — or read it free while it is here.
@Kory-White- · if Venmo asks, the last 4 of my number are 2012
This page is gone.
This one is off the shelf now. $1 keeps it on your phone for good — the whole page, pictures and diagrams included.
 revopsHow do you decide if a interim CRO is right for a post-merger company when churn is rising on enterprise accounts in 2027?
 revopsHow do you decide if a interim CRO is right for a bootstrapped profitable company when sales and marketing are misaligned in 2027?
 revopsHow do you decide if a part-time revenue leader is right for a Series A company when preparing for fundraise in six months in 2027?
 revopsHow do you run a CRO search when your last VP Sales failed at enterprise in 2027?
 revopsHow do you decide if a part-time revenue leader is right for a Series A company when pipeline coverage below 2x in 2027?
 revopsHow do you decide if a interim CRO is right for a post-merger company when founder wants to step back from selling in 2027?
 revopsHow do you measure RevOps team ROI when finance only recognizes bookings in 2027?
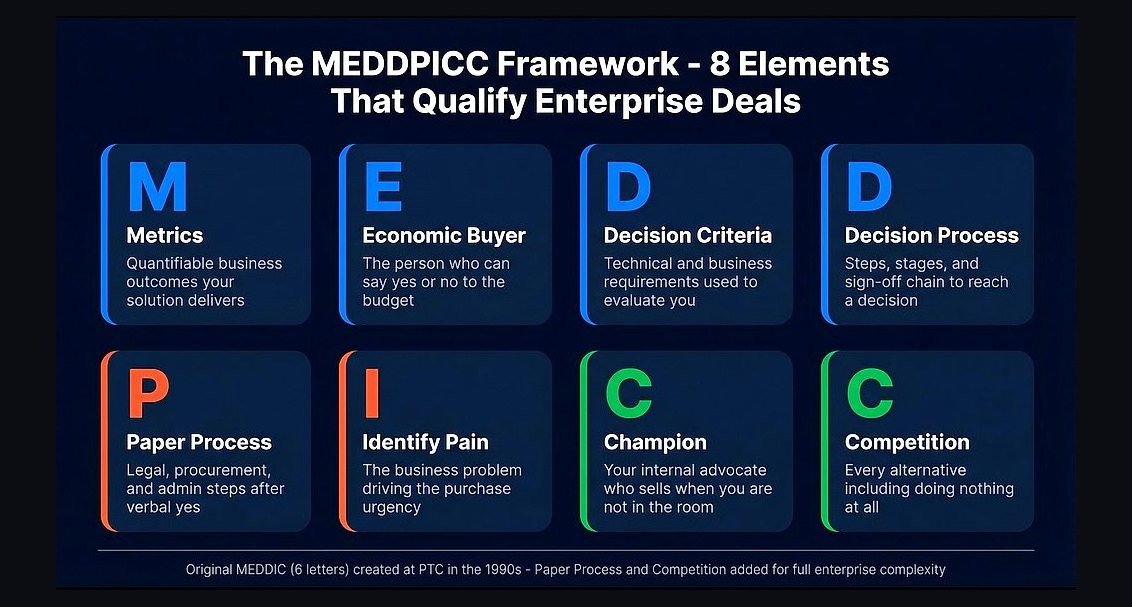 revopsHow do you detect when reps skip MEDDPICC fields on Commit-stage opportunities automatically in 2027?
 revopsHow do you avoid duplicate leadership when CRO and CMO both claim pipeline in 2027?
 revopsHow do you decide if a interim CRO is right for a bootstrapped profitable company when missed two quarters of quota in 2027?