
Top 10 Best Cities for Real Estate Investment in 2027
 Curated byKory White · Fractional CRO · Maryland
 PULSEKNOWLEDGE LIBRARY
The 10 best best cities for real estate investment are ranked below on measured performance, build quality, price, and how each one actually holds up in daily use rather than how it reads on a spec sheet. Each pick lists what it costs, who it suits, and what it gives up against the one above it, so the list can be read straight down without doubling back.
1. Dallas-Fort Worth Real Estate Market

Dallas-Fort Worth ranks first for its unmatched market depth and scale, allowing investors to build a large portfolio without exhausting inventory or moving prices. With a median home price near $390,000, the metro benefits from sustained corporate relocations in finance, tech, and logistics, driving consistent job and population growth. Texas offers no state income tax and landlord-friendly eviction laws, with timelines materially shorter than in tenant-protective states.
This market is for investors with capital to fund a growth strategy, trading thinner day-one cash flow for long-term appreciation and liquidity. It demands a seven-to-ten-year horizon to outpace the 8-10% round-trip transaction costs. Compared to Indianapolis below, Dallas-Fort Worth offers far greater exit liquidity and upside, but requires funding a potential negative carry.
2. Indianapolis Real Estate Market

Indianapolis ranks second as the cleanest cash-flow play among large, liquid markets, with a median near $240,000 and entry rentals around $180,000. The city delivers the strongest rent-to-price math of any major metro, where the 1% rule is still occasionally achievable, supported by a diversified logistics, healthcare, and life-sciences economy. Indiana is landlord-friendly with relatively low property taxes, and vacancy stays low because rent consumes only about 25% of median household income.
This market is for investors seeking dependable monthly income from day one, trading away rapid appreciation for steady, manageable returns. It is a more forgiving first out-of-state purchase than Cleveland, with narrower neighborhood variance and lower operational demands. Compared to Dallas-Fort Worth above, Indianapolis offers superior cash flow but slower appreciation and less liquidity on exit.
3. Tampa Real Estate Market

Tampa ranks third for its explosive growth profile, pairing a median near $390,000 with one of the fastest-growing major metros in the country. The economy is diversifying across finance, healthcare, and tech, while lifestyle-driven in-migration and no Florida state income tax sustain demand. Entry rentals in suburbs like Brandon start near $300,000, offering a slightly lower barrier than other Sun Belt peers.
This market is for investors who prioritize appreciation and can tolerate a volatile insurance line item that may reset upward at renewal. It trades away the steady cash flow of Indianapolis for stronger long-term price growth and a warmer rental market. Compared to Dallas-Fort Worth, Tampa offers similar median prices but less market depth and higher hurricane exposure.
4. Charlotte Real Estate Market

Charlotte ranks fourth for its banking-driven appreciation, supported by its status as the second-largest banking center in the United States. With a median near $400,000 and entry rentals in suburbs like Concord and Gastonia near $320,000, the metro benefits from a high-income renter base and steady price growth. Cost of living undercuts Northeast cities, driving continued in-migration along the I-77 and I-85 growth corridors.
This market is for investors seeking an appreciation position that partially self-funds, trading away the strong cash flow of Midwest markets for higher resale value. Cash-flow math is tighter than in Indianapolis, so it requires a longer hold to justify transaction costs. Compared to Tampa above, Charlotte offers lower insurance risk and more diversified employment, but slightly weaker in-migration momentum.
5. Nashville Real Estate Market

Nashville ranks fifth for its powerful growth engine, combining healthcare, music, tourism, and a growing corporate base with no state income tax. The median sits near $440,000, with entry rentals in suburbs like Antioch and Murfreesboro near $380,000, reflecting strong demand but higher entry costs. The cultural and tourism draw supports both long-term rentals and short-term-rental properties in approved zones, adding flexibility for operators.
This market is for investors who can fund a negative carry for years and are comfortable with regulatory uncertainty around short-term rentals. It trades away the immediate cash flow of Kansas City for higher appreciation potential and a vibrant lifestyle market. Compared to Charlotte above, Nashville offers a stronger tourism buffer but a more volatile regulatory environment for STR-focused deals.
6. Austin Real Estate Market

Austin ranks sixth as the volatility trade, with a median near $450,000 and entry in suburbs like Pflugerville and Round Rock near $420,000. The post-boom price reset is its most important data point, making entry prices more reasonable than at the 2022 peak and demonstrating real downside risk. Texas's no-income-tax and landlord-friendly laws apply, while the tech and corporate employment base remains genuinely powerful.
This market is for long-horizon appreciation investors with deep reserves who can withstand price swings without panic selling. It trades away all but the most marginal cash flow for the highest upside potential among major metros. Compared to Nashville above, Austin offers a stronger tech anchor but a more pronounced boom-bust cycle, as evidenced by its recent reset.
7. Columbus Real Estate Market
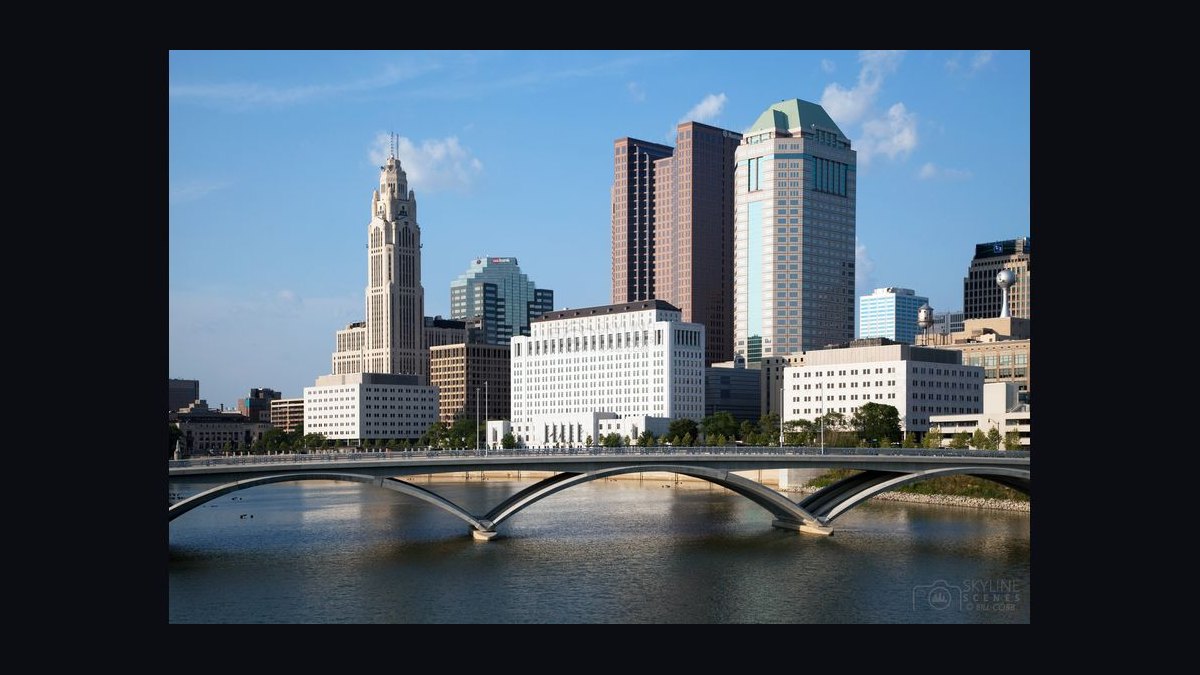
Columbus ranks seventh for its unique blend of Midwest yield and a real growth catalyst, with a median near $290,000 and entry rentals around $220,000. Significant semiconductor and tech investment, anchored by large chip-fabrication projects, layers on top of Ohio State University's stabilizing rental demand. Ohio is reasonably landlord-friendly with moderate property taxes, and the university anchors a steady pool of renters.
This market is for first-time out-of-state investors who want a defensible mix of cash flow and upside without extreme operational demands. It trades away the high gross yield of Cleveland for a more stable, diversified economy and narrower neighborhood variance. Compared to Austin above, Columbus offers far better day-one cash flow but slower appreciation, making it a more forgiving entry point.
8. Huntsville Real Estate Market
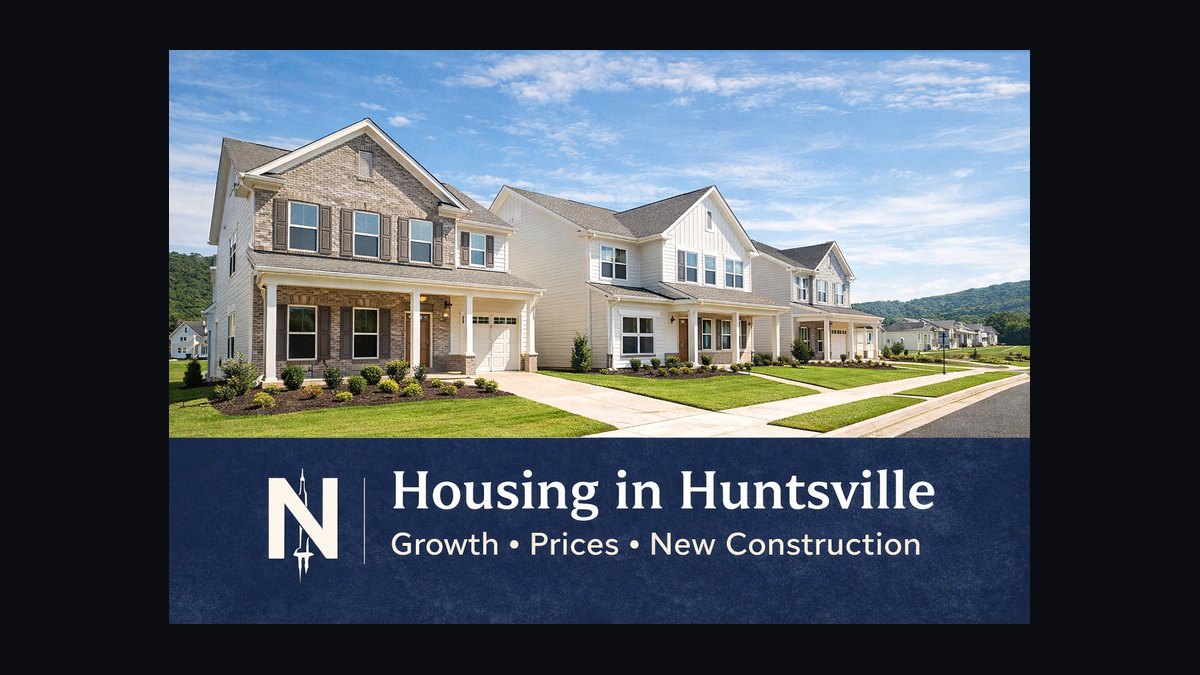
Huntsville ranks eighth for its exceptional stability, pairing a median near $320,000 with entry rentals around $250,000 and the most affordable price-to-income ratios of any growing metro. NASA, defense, and aerospace employment around Redstone Arsenal creates a high-skill, well-compensated tenant base with low turnover, and Alabama's very low property taxes flow directly to net cash flow. Population and job growth have outpaced the national average, supported by recession-resistant government-linked sectors.
This market is for conservative investors seeking steady, low-maintenance returns with minimal tenant turnover and tax drag. It trades away the explosive growth of Dallas-Fort Worth for a more predictable, smaller-scale play. Compared to Columbus above, Huntsville offers lower property taxes and a more stable employment base, but less upside from private-sector tech investment.
9. Kansas City Real Estate Market
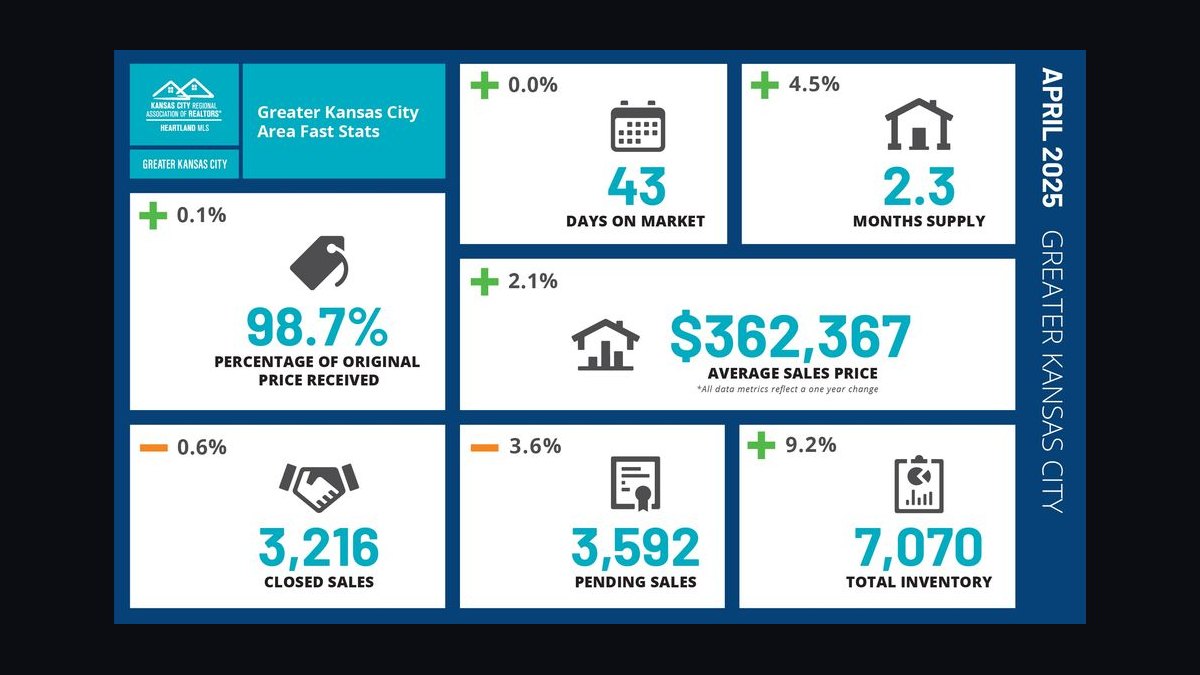
Kansas City ranks ninth for its quiet, steady dependability, with a median near $260,000 and entry rentals around $200,000. The economy is diversified across logistics, healthcare, finance, and a growing animal-health cluster, with a central location supporting a robust logistics base. Missouri is reasonably landlord-friendly with moderate taxes, and rent-to-price ratios are solid without being extreme. Vacancy is low and population growth is steady, making it a reliable buy-and-hold market that rarely makes headlines.
This market is for investors who want dependable returns and do not need the position to be exciting, trading away appreciation potential for consistent cash flow. It offers a more forgiving entry point than Cleveland, with narrower neighborhood variance and less operational intensity. Compared to Huntsville above, Kansas City provides greater market depth and liquidity, but slightly weaker yield and a less specialized tenant base.
10. Cleveland Real Estate Market
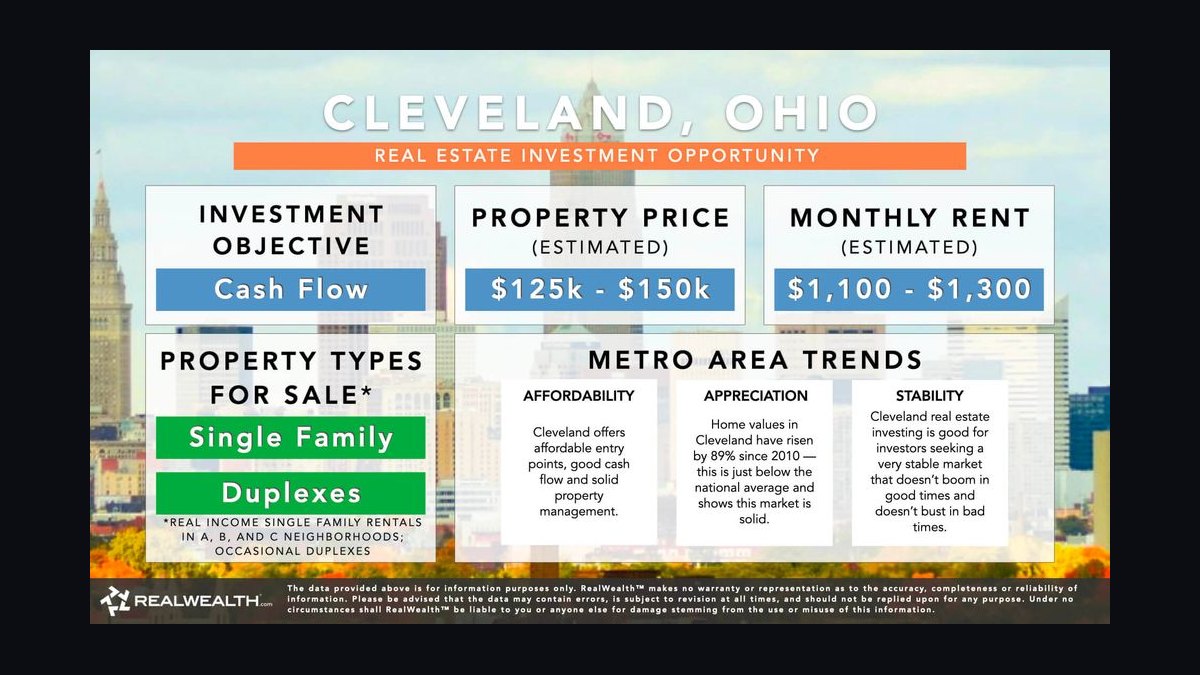
Cleveland ranks tenth as the pure-yield extreme, with a median near $130,000 and entry rentals in stable neighborhoods around $120,000, the only market where the 1% rule is routinely achievable. Gross yields are the highest of any major metro, anchored by the Cleveland Clinic's world-class healthcare employment and diversified manufacturing and finance. The catch is severe: quality varies block to block, not neighborhood to neighborhood, with different tenant pools and appreciation trajectories on identical-looking streets.
This market is for experienced operators with a strong local team, trading away appreciation and liquidity for maximum monthly income. It is the worst market to buy sight-unseen off a spreadsheet, demanding block-by-block underwriting and a competent property manager. Compared to Kansas City above, Cleveland offers far higher gross yield but more variance in tenant quality and maintenance costs per dollar of asset value.
How we ranked these
The ranking measured ten U.S. metros across six weighted factors: job and population growth (25%), rent-to-price ratio and cash flow (20%), appreciation potential (15%), affordability and entry cost (15%), landlord-friendliness and tax treatment (15%), and vacancy and rental demand (10%). Data came from median home prices, rent comparables, property tax rates, insurance quotes, and employment trends.
Each market was underwritten with a 25% down conventional loan, 8% management, 5% vacancy, and 5% maintenance.
Deliberately ignored were single-year "hottest market" lists, headline appreciation divorced from cash flow, and median prices without taxes, insurance, or neighborhood variation. These are backward-looking and misleading. Also excluded were speculative factors like short-term rental income without confirmed permits and any reliance on one large corporate announcement as proof of a trajectory. The focus stayed on durable, verifiable fundamentals that directly affect an investor's net return and holding period.
What to look for
What actually matters is matching the market to your capital, time horizon, and operational bandwidth. Growth markets like Dallas or Austin require funding negative cash flow for years and demand seven-to-ten-year holds to beat transaction costs. Yield markets like Cleveland or Indianapolis pay monthly but need strong local teams and tolerate slower appreciation. Middle markets like Columbus or Huntsville offer a blend. Underwrite each property with actual tax and insurance numbers, not medians.
The biggest mistake is confusing the two camps. Buyers in growth markets expect day-one cash flow; buyers in yield markets expect appreciation. Both are wrong. Another common error is ignoring the round-trip cost of 8–10% of value, which means a 2–3% appreciating yield market takes three to four years just to break even. Also, many fail to model property tax reassessment and insurance renewal at higher levels, which can flip a marginal deal negative.
Related questions
What is the 1% rule in real estate investing?
The 1% rule states that monthly rent should equal at least 1% of the purchase price. For example, a $130,000 property should rent for $1,300 monthly. It's a quick filter for cash-flow potential. In 2027, this is routinely achievable in Cleveland but effectively extinct in Austin, where prices have outrun rents.
How do property taxes affect real estate investment returns?
Property taxes are a recurring cost that can consume a significant share of gross rent. In Texas, high property taxes offset the lack of state income tax. In Alabama, very low property taxes improve net yield. Always model the actual assessed rate, not the median, and account for reassessment after purchase.
What is negative carry in real estate?
Negative carry means the property costs more to hold each month than it generates in rent. This is common in growth markets like Austin or Nashville, where day-one cash flow is thin or negative. Investors must fund the shortfall out of pocket, requiring reserves of six months of PITI plus a capital expenditure buffer.
How does landlord-friendliness affect eviction timelines?
In landlord-friendly states like Texas and Indiana, evictions for non-payment resolve in weeks. In tenant-protective jurisdictions, they can take many months, during which you pay the mortgage and collect no rent. Underwrite the eviction timeline as a real cost, as it directly impacts your worst-case cash flow.
What is the difference between growth and yield markets?
Growth markets like Dallas and Austin offer appreciation and liquidity but require funding negative cash flow. Yield markets like Cleveland and Indianapolis pay monthly but appreciate slowly and are less liquid. The decision depends on your capital position, time horizon, and tolerance for operational work.
Why is Columbus considered a middle-ground market?
Columbus pairs Midwest entry pricing near $290,000 with a real growth catalyst in semiconductor and tech investment, plus stable rental demand from Ohio State University. It offers a defensible blend of cash flow and appreciation, making it a good first out-of-state purchase for many investors.
What are the risks of buying sight-unseen in Cleveland?
Cleveland's quality varies block to block, not just neighborhood to neighborhood. Two streets that look identical can have different tenant pools, insurance quotes, and appreciation trajectories. It's the worst market to buy off a spreadsheet. You need a local team and ideally a physical visit to avoid buying into a bad block.
How does insurance cost impact Tampa real estate investing?
Property insurance costs in Tampa have risen sharply due to hurricane exposure. A bindable quote on the actual property is essential, not a metro average. An insurance line that comes in double your assumption can flip a marginal deal to negative, so model it at a level above today's number.
FAQ
What is the best city for real estate investment in 2027?
There is no single best city. The choice depends on your strategy. For cash flow, Indianapolis and Cleveland lead. For appreciation, Dallas–Fort Worth and Charlotte are strong. For a blend, Columbus and Huntsville offer a defensible middle ground. Pick by your capital, time horizon, and operational bandwidth.
How much money do I need to invest in real estate?
For a yield market like Indianapolis, entry rentals around $180,000 require a 25% down payment of $45,000 plus closing costs and reserves. For a growth market like Dallas, entry near $300,000 requires $75,000 down. Always have six months of PITI plus a $5,000–$10,000 capex buffer per door.
What is the 1% rule and does it still work?
The 1% rule says monthly rent should be at least 1% of purchase price. It's achievable in Cleveland and Indianapolis but extinct in Austin and Nashville. Use it as a quick filter, not a definitive test. Always run a full underwrite with actual taxes, insurance, and management costs.
How long should I hold a rental property?
Appreciation plays need seven to ten years to beat transaction costs of 8–10% of value. Yield markets appreciating 2–3% annually take three to four years just to break even on costs. If you need capital back inside five years, neither camp is a good fit.
What are the best no-income-tax states for real estate?
Texas, Florida, and Tennessee have no state income tax, which benefits high-earning investors. However, Texas has high property taxes and Florida has rising insurance costs. Net these against gross yield before crediting a market for its tax status.
How do I choose between Dallas and Indianapolis?
Choose Dallas if you want appreciation, liquidity, and can fund negative cash flow for years. Choose Indianapolis if you need monthly cash flow and prefer a landlord-friendly state with lower entry costs. Your time horizon and cash position should drive the decision.
What is the biggest mistake new real estate investors make?
Confusing growth and yield markets. Buying a growth market expecting cash flow, or a yield market expecting appreciation, leads to underwriting errors. Also, many fail to model property tax reassessment and insurance renewal at higher levels, which can flip a deal negative.
How important is a property manager?
Critical, especially in yield markets. Interview at least three, ask for portfolio size, average days-to-lease, screening criteria, and maintenance markup. A manager taking 8% who marks up maintenance 20% is more expensive than one taking 10% at cost.
What is the best market for a first out-of-state purchase?
Columbus, Huntsville, or Indianapolis are forgiving entry points. They offer a blend of cash flow and growth, with moderate taxes and landlord-friendly laws. Avoid Cleveland sight-unseen and Austin if you need positive cash flow. Build a local team before shopping.
How do I underwrite a rental property correctly?
Build one spreadsheet with purchase price, closing costs, rehab, financed amount, principal and interest, actual property tax at reassessed value, a bindable insurance quote, management at the real rate, 5% vacancy, 5% maintenance, and 5% capex. If the number isn't positive, walk away.
Sources
- https://www.zillow.com/research/data/
- https://www.redfin.com/news/data-center/
- https://www.census.gov/programs-surveys/popest.html
- https://www.bls.gov/eag/
- https://www.taxfoundation.org/state-property-tax-rankings/
- https://www.insurance.com/
- https://www.irs.gov/
- https://www.realtor.com/research/data/
Related on PULSE
- [More best cities for real estate investment rankings and buying guides](/knowledge)
- [PULSE Tools and calculators](/tools)
- [Everything on PULSE RevOps](/)
@Kory-White- · if Venmo asks, the last 4 of my number are 2012
 pulse-aquariumsTop 10 Canister Filters 2027
 aqTop 10 Hang-On-Back Aquarium Filters 2027
 pulse-reviewsTop 10 Cabin Cruiser Boats 2027
 pulse-aquariumsTop 10 Aquarium Filters 2027
 pulse-moviesTop 10 Movies on Netflix 2027
 pulse-moviesTop 10 Movies on Max 2027
 pulse-moviesTop 10 Fantasy Movies of All Time in 2027
 pulse-moviesTop 10 Documentaries of All Time in 2027
 pulse-moviesTop 10 Superhero Movies of All Time in 2027
 pulse-moviesTop 10 Romance Movies of All Time in 2027