


GTM Playbook for Pizza Shops in 2027
Quality
Certified
A pizza shop wins in 2027 by owning first-party demand instead of renting it: direct online ordering, an SMS club, and in-house drivers carry 75-85% of orders, aggregators stay capped at 15-25% as paid acquisition, food cost holds near 28% and labor near 26-28%, and a large specialty pie prices at $22-26.
The go-to-market motion in one picture
The whole go-to-market motion for a single-unit pizzeria runs inside a three-mile radius. That radius is not a marketing preference — it is the physical constraint of a 25-to-30-minute delivery window with a pie that has to arrive hot. Roughly 85% of orders originate inside it, which means every dollar of acquisition spend outside that ring is close to wasted, and every dollar spent inside it compounds because the same household orders again.
The motion has four stages and each one has a different owner, a different cost structure, and a different failure mode. Stage one is discovery: a stranger inside the radius learns the shop exists. Google Business Profile, direct mail into the ZIP-level carrier routes, an aggregator listing, a Facebook or Instagram local ad, or word of mouth. Stage two is first order, and this is where the channel choice sets the margin for the life of that customer. A first order placed through your own checkout on a $35 ticket nets roughly $33-34 after card processing. The same $35 ticket through a 30%-commission aggregator nets about $24.50. That is a ten-dollar difference on a single pie-and-wings order, and it repeats on every subsequent order until you convert the relationship.
Stage three is conversion: the deliberate work of moving an aggregator-sourced customer onto your direct channel. The cheapest mechanism is physical — a QR code printed on the box flap that lands on your own ordering page with a 15%-off-next-direct-order offer. It costs a few cents per box and it travels home with a customer who is already holding a hot pizza, which is the highest-goodwill moment in the entire relationship. Operators who run this consistently for six months report converting a meaningful share of third-party customers to direct, in the 40-55% range.
Stage four is repeat. A customer who orders six or more times a year at a $30-plus average ticket is worth $180-250 of annual revenue at a marginal acquisition cost of nearly zero. The retention tools — SMS club, email, loyalty — cost $80-200 a month combined and their entire job is to move a household from 2.1 orders a year to 3.4 or higher.
Read the diagram as a margin machine, not a funnel drawing. Every arrow that lands on the direct-order node is worth roughly ten dollars more per ticket than the arrow that lands on the aggregator node. The single highest-leverage intervention in the whole picture is the conversion node — the box flap — because it is the only place where an expensive channel gets rewritten into a cheap one.
Who owns what across the revenue org
A pizzeria's revenue org is three or four people, not a department chart, and the failure mode is that all four roles collapse onto the owner until the owner is the bottleneck on every decision.
The owner owns pricing, the aggregator relationship, capital spend, and the vendor contracts. Pricing is not delegable because it is the only lever that fixes a bad prime cost inside a week. The aggregator relationship is not delegable because it requires someone willing to accept a short-term volume dip in exchange for margin — a manager compensated on sales will never make that trade voluntarily. Capital spend covers the oven decision, the POS decision, and the vehicle question. Vendor contracts mean the cheese and flour agreements with the broadline distributor.
The general manager owns the labor schedule, the food order, the aggregator menu pricing inside the parameters the owner sets, review responses, and closing cash reconciliation. The hiring threshold matters: below roughly $700K in annual unit volume, the GM does not pay for themselves and the owner runs the shop. Above that, a GM earning $58K-72K base plus a 3-5% cash-flow bonus typically pays back in six to nine months by pulling 1.5-2 points out of food cost and 2-3 points out of labor. Those five points on a $1M unit are $50,000 — comfortably more than the incremental payroll.
The shift lead or head pizza-maker owns throughput during peak. This is the person who decides whether Friday at 6:40pm turns away orders or absorbs them. Pay bands in 2027 run $18-24/hour in most markets and $26-32/hour in high-cost metros like California, New York, Seattle, and Boston. The retention structure that works is a visible ladder — a dollar-an-hour quarterly raise capped at a stated ceiling, plus a periodic retention bonus tied to full attendance. Pizzerias with structured pay ladders run substantially lower turnover than spot-rate shops, which matters more than the wage itself because a trained maker is worth two untrained ones during a rush.
The delivery floor is its own P&L. In-house drivers in 2027 typically earn $10-12/hour base plus $1.50-2.50 per delivery plus tips, netting $22-30/hour all-in in suburban markets. Run the comparison honestly: two drivers working five hours at four deliveries per hour is 40 deliveries. At $1.50-2.50 per delivery plus base, delivery compensation on roughly $1,400 of delivery revenue lands in the low single digits as a percentage. The same $1,400 through a 30%-commission aggregator costs $420. House delivery is cheaper than aggregator delivery at essentially any volume above about three deliveries per driver-hour — the aggregator only wins when volume is too thin to keep a driver busy.

There is a compliance dimension to the delivery floor that operators routinely get wrong. Tipped-credit rules constrain how much non-tipped side work a tipped driver can perform — the 80/20 and 30-continuous-minute framework. If your drivers spend the slow hours doing dough prep and dish duty on a tip credit, you have a wage-and-hour exposure. The practical fix is scheduling: either pay full minimum wage for prep-heavy shifts or structure the shift so side work stays inside the limits. Scheduling and payroll tools that auto-track this run $40-90/month, which is trivially cheaper than a single settlement.
Metrics, targets, and realistic ranges
Run the shop on six numbers. Everything else is diagnostic detail underneath them.
First-party order share. The headline metric for a 2027 pizzeria. Target 75-85% of orders through your own site, phone, or counter. Below 60% you are effectively an aggregator's fulfillment vendor with rent and a lease. Measure it weekly from POS channel reports, not monthly, because the drift happens fast — a good aggregator promotion can move ten points of mix in a month and it does not come back on its own.
Food cost. Target 28% of revenue, with a workable band of 26-30%. A 16-inch large specialty — dough, sauce, whole-milk mozzarella, four toppings, box — costs roughly $5.40-6.80 to produce. At a $22-26 menu price that is 24-28% food cost, comfortably inside benchmark. The trap is discounting the specialty toward national-chain pricing to compete on price; the independent's entire position is the premium pie, and a $13.99 large specialty destroys the only high-margin item on the menu.

Labor cost. Target 26-28%. Audit shift-by-shift, not week-by-week — the weekly average hides the Tuesday-at-2pm shift running 45% labor. Any individual shift over 30% labor cost is a scheduling error, not a wage problem.
Prime cost. Food plus labor, target 54-58%. This is the number that actually predicts whether the unit survives. Above 62% the shop cannot cover occupancy, utilities, insurance, and debt service without eating the owner's draw.
Average ticket. The attach rates are where this is won. A six-piece bone-in wing order at $8.99 with roughly $1.85 in plate cost runs about 21% food cost — better than the pizza itself. A two-liter soda at $3.99 against $1.40 wholesale is 35% food cost but $2.59 of absolute margin per unit, which is what pays the rent. A scripted upsell on every phone and POS ticket — wings added to any large, drinks added to any delivery — moves the average ticket from roughly $24 to $32. That is a 33% lift on the same order count, and because the incremental items carry better-than-average margin, nearly all of it lands in prime cost improvement.
Annual unit volume. A healthy independent single unit runs $900K-$1.4M. The shops at the top of that band are not doing anything exotic — they have high first-party share, disciplined prime cost, weekend delivery capacity that does not choke, and a standing catering book.
Two secondary numbers worth tracking monthly. First, aggregator take rate calculated as true landed cost, not headline commission: pull the weekly statements and divide total fees, including marketing and promotion charges you opted into, by gross aggregator sales. Operators are routinely surprised to find the effective rate is several points above the quoted commission. Second, repeat frequency: orders per unique customer per year, pulled from POS customer records. Moving a base from 2.1 to 3.4 orders a year is a 60% revenue increase from customers you already acquired.
On the marketing side, a disciplined $400/month stack is enough for a neighborhood shop: Google Business Profile posts a few times a week at zero cost beyond owner time, local search ads at $8-15/day, an email platform at $30-50/month for a couple thousand contacts, and $100/month of boosted posts on the weekly special. Direct mail into the radius runs a few cents per household — a 5,000-household drop lands in the $200-300 range and, with a genuine loss-leader offer like a $12.99 large one-topping pickup, converts in the 0.8-1.4% range. The math to hold yourself to: those first-time orders need to return at a meaningful rate within 90 days or the drop was a donation, and POS data is the only honest scorekeeper.
Where the motion breaks down
The aggregator dependency spiral. This is the dominant failure pattern. The shop signs up, volume rises, the owner reads the top-line growth as success and stops investing in direct ordering. Eighteen months later a majority of orders flow through 30%-commission channels, net margin has collapsed from low double digits to low single digits, and the customer relationships — names, addresses, order history — sit inside someone else's database. The recovery is slow and expensive because you are now buying back customers you already paid to acquire. The prevention is a hard cap: aggregator volume stays at 20-25% of orders, treated explicitly as a paid customer acquisition line, with the conversion mechanism running continuously.

Ingredient cost whipsaw. Mozzarella and block cheese prices have swung dramatically across 2025-2027 — the kind of move that adds three to five points of food cost overnight for a shop running 40 pounds of mozzarella a day. Nothing on the menu absorbs that quietly. The defenses are contractual and structural: forward pricing arrangements with your broadline distributor on a 90-day horizon, and a deliberate price cushion built into every pie above $18 so a spike does not force an emergency menu reprint. Check USDA Dairy Market News weekly reports rather than waiting for the invoice to tell you.
Peak-capacity choke. The single largest revenue leak in a busy shop is oven capacity on Friday and Saturday nights. If the kitchen tops out and the phone starts quoting 75-minute waits, orders do not queue — they leave. A shop turning away 15 pizzas an hour during a three-hour peak is losing meaningful weekly revenue and, worse, training its best customers to call someone else. A second deck or a conveyor oven is a $18K-32K capital decision that pays back in months, not years, at any unit doing serious weekend volume. Run the arithmetic before assuming it is unaffordable: lost peak revenue is the comparison, not the equipment price in isolation.
Wage-and-hour exposure on the delivery floor. Driver classification and tipped-credit compliance are the most common legal risk for independent pizzerias, with active litigation across multiple states. Vehicle reimbursement is the second half of this: under-reimbursing drivers for mileage can push effective wages below minimum, which is the mechanism behind most of the class actions. Track it in the scheduling and payroll system rather than in a notebook.
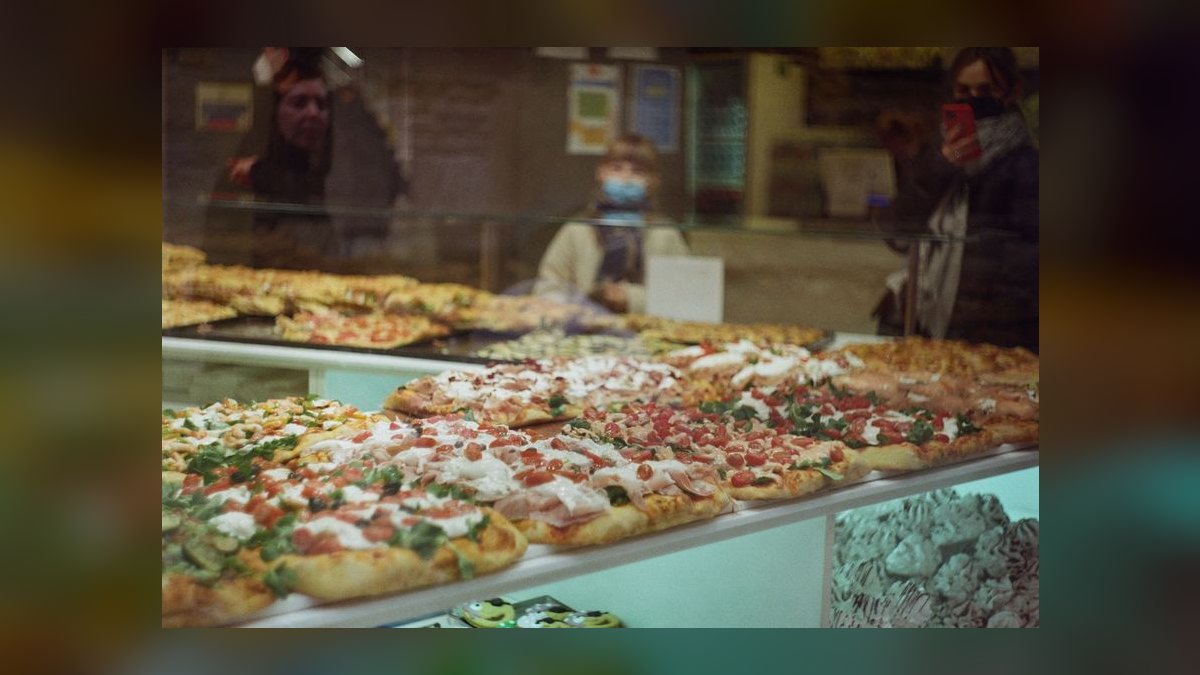
Menu sprawl. The quiet killer. Every added item adds SKUs, prep time, waste, and ticket-time variance during peak. A pizzeria with 90 menu items has slower tickets and higher waste than one with 40, and the marginal items rarely carry their inventory cost. Prune annually against POS item-level sales; anything under about 1% of units usually costs more in complexity than it returns in revenue.
Marketing that stops. Direct mail, GBP posts, and SMS are cadence tools — they work when held for six months and produce almost nothing when run once. The most common wasted spend in the category is a single mail drop with no follow-up, which produces a spike of first orders and no second orders because nothing brought those households back.
How to sequence the build
The order matters. Building the direct channel before fixing prime cost just drives more volume through a leaky unit; fixing cost without building the channel leaves you dependent on the aggregator. Run it in three thirty-day blocks.
Days 1-30 — stop the bleed. Audit food cost line by line against distributor invoices. Audit the labor schedule shift by shift and kill anything over 30% labor. Pull every aggregator weekly statement and compute true landed take rate including marketing fees. Renegotiate the cheese contract. If the POS predates the current generation, replace it — every downstream tool in this playbook reads from POS data, and you cannot manage first-party share you cannot measure. The realistic POS options for a pizzeria are a full restaurant platform like Toast, a pizza-specific system like HungerRush with half-and-half topping pricing and driver dispatch, a pizzeria-focused package like Slice, or a budget option like Square for a takeout-only shop under about $400K. Match the tool to delivery volume: dispatch tooling matters enormously above 20 deliveries an hour at peak and barely at all below five.
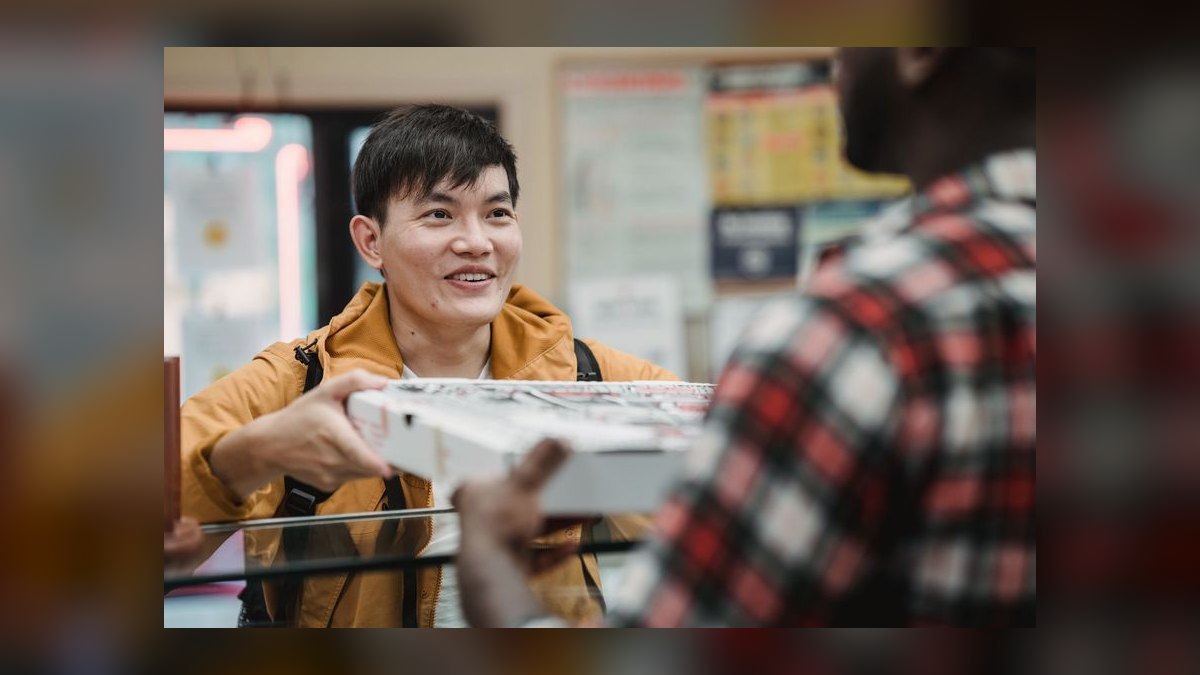
Days 31-60 — build the direct channel. Launch direct online ordering on your own domain. The economics are decisive: flat per-order or flat monthly pricing beats a 30% commission by roughly 5-10x on a $35 ticket. Print box-flap QR coupons at 15% off the next direct order. Run a 5,000-piece mail drop into the three-mile radius with a real loss-leader. Set Google Business Profile posts on a three-times-weekly cadence and answer every review within 24 hours. Hire and train two in-house drivers for Friday-Saturday-Sunday coverage — weekend-only is the right start because that is where the delivery density supports the labor.
Days 61-90 — compound. Start the SMS club: one text a week with a same-day offer, running $50-150/month for a few thousand subscribers, with redemption typically in the 8-14% range. Add email at roughly twice a week. Launch loyalty through the POS — the simple buy-ten-get-one structure outperforms elaborate points systems and costs $25-50/month. Pitch 20 local offices, schools, and churches on standing catering accounts; a recurring weekly order in the $180-340 range is the most stable revenue in the business, and eight of them at $220/week is roughly $91K of annual revenue at strong margin. Raise aggregator menu prices 15-20% to claw back commission, which several jurisdictions explicitly permit and which customers already expect.
By month twelve the target is a mix inversion — from something like 45% aggregator and 55% direct to 20% aggregator and 80% direct — with prime cost inside 58% and a catering book that covers a meaningful slice of fixed costs before the first walk-in order of the week.
Related questions
How much should a large specialty pizza cost in 2027?
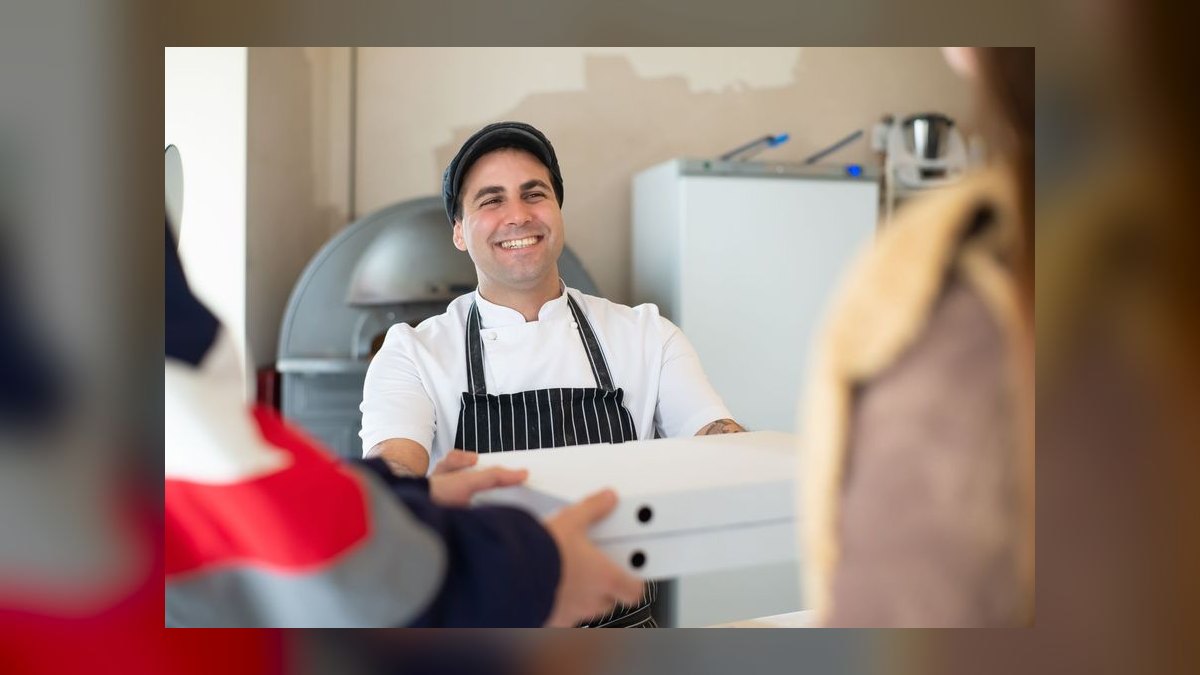
$22-26 for a 16-inch large specialty. At $5.40-6.80 of ingredient and packaging cost that holds food cost at 24-28%. Discounting toward national-chain pricing destroys the highest-margin item on the menu and does not win the price-sensitive customer anyway.
Should an independent pizzeria drop delivery apps entirely?
Usually no. Cap them at 15-25% of orders and treat the commission as customer acquisition cost, not a channel. Full removal loses genuine new-customer discovery; full dependence collapses margin. The discipline is the cap plus a running conversion mechanism.
When does an in-house delivery floor beat paying commission?
Above roughly three deliveries per driver-hour. Below that, drivers idle and per-delivery cost exceeds commission. Two drivers covering Friday through Sunday is the standard starting configuration because weekend density supports the labor and weeknights often do not.
What is the first thing to fix in a struggling pizza shop?
Prime cost, measured shift by shift and invoice line by invoice line. Marketing spend on a unit running 64% prime cost just increases the rate of loss. Fix cost first, then build demand into a unit that converts volume into cash.
FAQ
What is the single most important metric for a pizza shop in 2027?
First-party order share. Shops generating 75-85% of orders through their own website, phone, counter, and in-house drivers keep margins intact, while shops leaning heavily on 30%-commission marketplaces see net margin erode toward single digits regardless of how strong top-line revenue looks.
Is a delivery app still worth using?
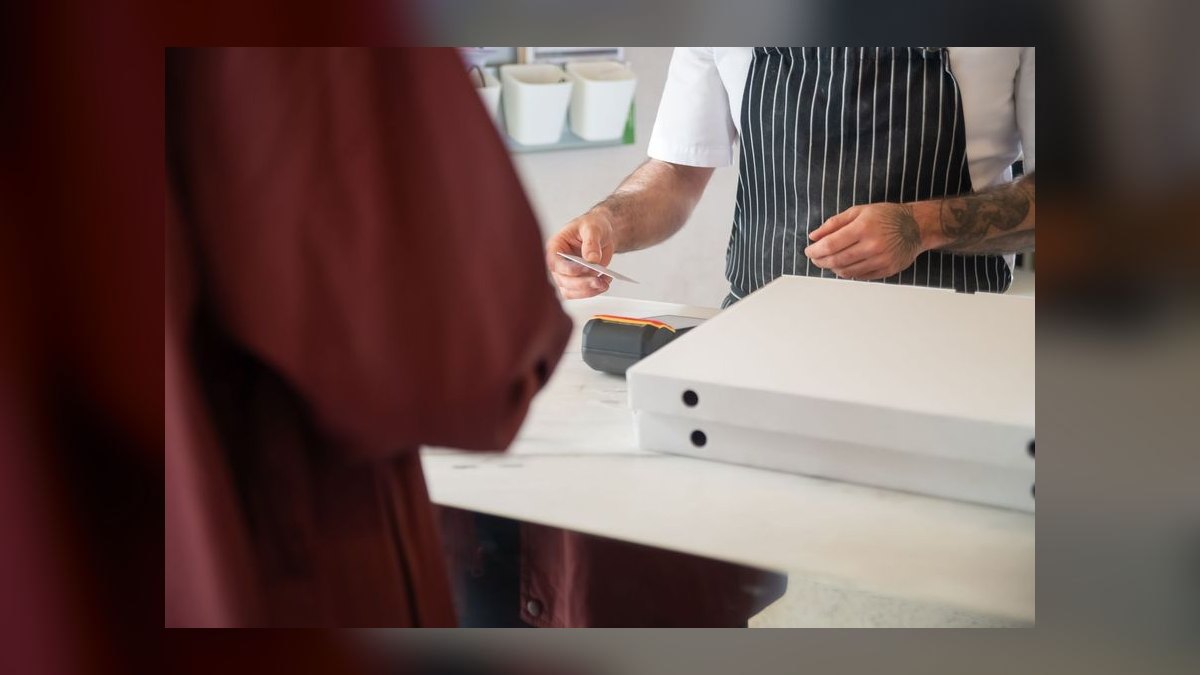
Yes, as a bounded channel at 15-25% of orders. A 30% commission is unsustainable as a primary sales source but tolerable as paid discovery — provided you actively convert those customers to direct ordering with a box-flap offer and a next-order incentive.
What technology does a pizzeria actually need?
A current POS, direct online ordering on your own domain, and an SMS or email list. Nothing else is mandatory. Custom mobile apps are a common and expensive mistake for a single-unit shop; a mobile-friendly ordering page does the same job for a fraction of the cost.
How many drivers should be scheduled on a Friday night?
At least two on the floor by 5pm. That covers the dinner peak without idling labor and keeps delivery times inside 30 minutes, which is the threshold where customer satisfaction and repeat rate start falling off sharply.
What annual revenue should an independent single unit target?
$900K-$1.4M is the realistic band. Units at the top typically combine high first-party share, prime cost inside 58%, weekend delivery capacity that does not choke, and a standing catering book worth several thousand dollars a month.
How do you protect margin when cheese prices spike?
Forward-price with your broadline distributor on a roughly 90-day horizon, build a small price cushion into every pie above $18, and monitor USDA Dairy Market News weekly rather than discovering the move on an invoice. A 40-pound-a-day shop can absorb three to five points of food cost swing otherwise.
Sources
- https://www.pmq.com/ — PMQ Pizza Magazine, annual Pizza Power Report and independent operator benchmarks
- https://www.pizzatoday.com/ — Pizza Today, industry trends and operator cost benchmarks
- https://www.ams.usda.gov/market-news/dairy — USDA Dairy Market News, weekly cheese and mozzarella price reports
- https://www.dol.gov/agencies/whd/flsa/tipped — U.S. Department of Labor, Wage and Hour Division guidance on tipped employees
- https://www.sba.gov/business-guide — U.S. Small Business Administration, business planning and financing guidance
- https://restaurant.org/research-and-media/research/ — National Restaurant Association research and industry forecasts
- https://www.restaurantdive.com/ — Restaurant Dive, pizza segment and delivery-channel coverage
- https://www.restaurantbusinessonline.com/ — Restaurant Business Online, unit economics and segment reporting
- https://www.qsrmagazine.com/ — QSR Magazine, quick-service and pizza operator coverage
- https://www.pizzamarketplace.com/ — Pizza Marketplace, operator and technology news
Related on PULSE
- GTM Playbook for Ice Cream Shops in 2027
- GTM Playbook for Tire Shops in 2027
- GTM Playbook for Auto Body Shops in 2027
- GTM Playbook for Bike Shops in 2027
- GTM Playbook for Bridal Shops in 2027
- Independent Pizza Shop GTM Playbook 2027 — Specialty Regional Style, Delivery Dominance, and the Bar Program Math
This page will be disappearing soon. Save it to your device for $1 — or read it free while it is here.
@Kory-White- · if Venmo asks, the last 4 of my number are 2012
This page is gone.
This one is off the shelf now. $1 keeps it on your phone for good — the whole page, pictures and diagrams included.
 gtm-playbookIndependent Pizza Shop GTM Playbook 2027 — Specialty Regional Style, Delivery Dominance, and the Bar Program Math
 gtm-playbookHow do you choose between a direct sales and a partner-led go-to-market motion in 2027?
 gtm-playbookGTM Playbook for Concrete Contractors in 2027
 gtm-playbookWhat is the go-to-market playbook for a land-and-expand motion in 2027?
 gtm-playbookHow do you build a payroll and benefits administration go-to-market motion in 2027?
 gtm-playbookGTM Playbook for FinTech — The Complete Operator Guide in 2027
 gtm-playbookGTM Playbook for Plumbing Services in 2027
 gtm-playbookHow do you build a compliance training platform go-to-market motion in 2027?
 gtm-playbookGTM Playbook for DJ Services in 2027
 gtm-playbookWhat do top-performing SDR teams do differently in their outreach sequencing in 2027?