


GTM Playbook for Convenience Stores in 2027
Quality
Certified

A profitable 2027 convenience store playbook treats foodservice as the anchor category—fuel drives 70% of topline revenue but inside-the-box sales generate roughly 70% of profit—and executes a structured 30/60/90 sprint on pricing, loyalty tech, and hiring to lift EBITDA by $80K–$160K on a $3M store.
The revenue problem being solved
Independent convenience stores face a structural revenue mismatch that erodes profitability if left unmanaged. Fuel accounts for approximately 70% of total store revenue, yet net per-gallon profit after credit-card fees (2.5–3% of price), labor, and shrink lands at just $0.05–$0.07 per gallon according to Couche-Tard’s 2025 reported U.S. fuel gross margins of $0.47/gallon. Inside-the-box sales, while representing only about 30% of revenue, contribute roughly 70% of total store profit. The core problem is that most independent operators continue to allocate capital, shelf space, and labor hours proportional to revenue rather than profit. This leads to over-investment in tobacco (33% of inside sales but only 17% of inside gross profit per NACS) and under-investment in foodservice, which carries 50–55% gross margins and is the only in-store category growing in unit volume. The 2027 playbook solves this by re-anchoring the entire operation around inside profit drivers—specifically foodservice, packaged beverages at 28–32% margin, and salty snacks at 35% margin—while treating fuel, lottery (5–6% commission), and tobacco as traffic magnets rather than profit centers. Operators who fail to make this shift leave an estimated $60,000–$120,000 per year in coffee-program profit alone on the floor, and miss the compounding effect of loyalty members who visit 2.4x more often and spend 27% more per trip.
Root-cause map
The following diagram traces the root cause of the revenue problem from the fuel pump through to inside-store conversion and profit capture. It shows where leakage occurs—specifically at the pump-to-store conversion step, where industry average sits at 35–40% versus top-quartile operators at 55–65%—and maps the interventions that close the gap.
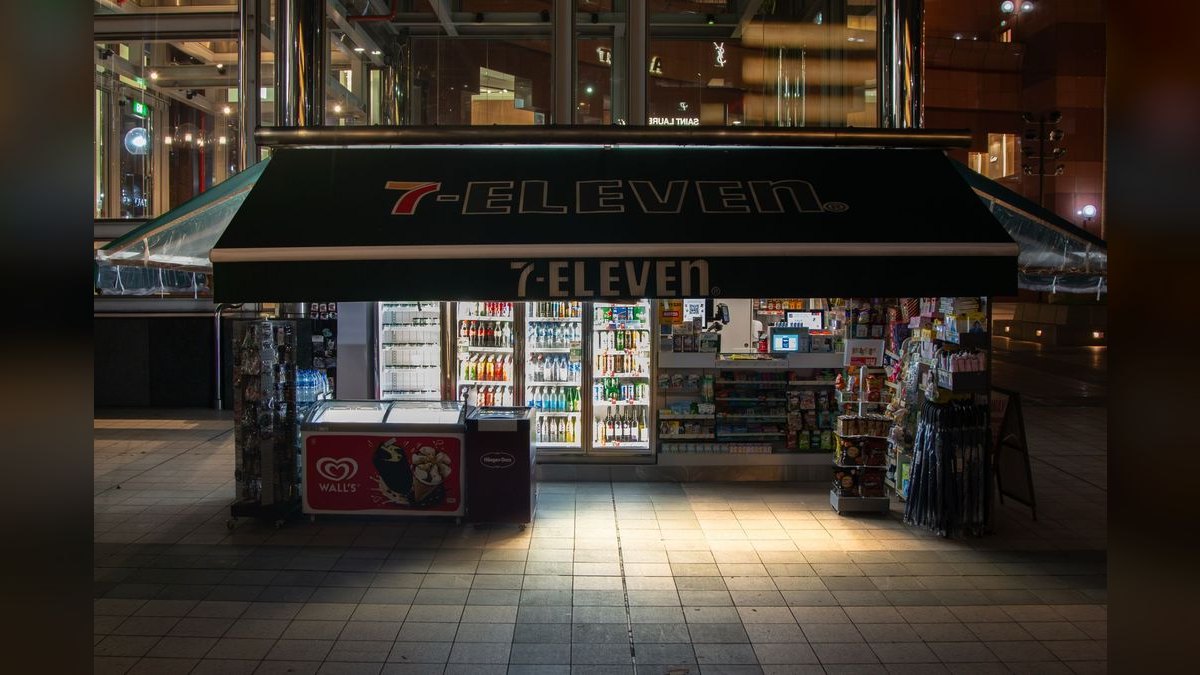
The map reveals that the highest-leverage intervention is not inside pricing or menu expansion—it is pump-to-store conversion. Every percentage point of conversion lift on a store doing 3,500 gallons per day is worth roughly $28,000–$42,000 in incremental inside revenue per year at an average inside ticket of $8.50. The three highest-ROI conversion plays are forecourt LED price toppers advertising a specific food item with a price ($2 hot dog, $1.99 large coffee), pay-at-pump receipt coupons via Verifone Commander or Gilbarco Passport dispensing a $1 off any sandwich offer, and in-pump video (Gilbarco Applause, Verifone OptiView) with a 15-second food spot that lifts conversion by 3–5 percentage points. Without addressing this root cause, all other inside optimization efforts operate on a smaller base of entering customers.
Benchmarks and ranges
The following benchmarks define the competitive ranges an independent convenience store should target in 2027. These numbers come from NACS State of the Industry, Circana 2026 data, Paytronix 2025 Loyalty Benchmark Report, and Petrosoft 2025 benchmarks—all sourced below.
Pump-to-store conversion: Industry average is 35–40%. Top-quartile operators like Wawa, Sheetz, and Casey’s push 55–65%. A store at 35% conversion should target 45% within 90 days using the forecourt and receipt-coupon plays described above.
Inside sales composition: Foodservice accounts for 28.7% of in-store sales and 39.6% of in-store gross margin. Tobacco is 33% of sales but only 17% of gross profit. Packaged beverages represent 28–32% margin, salty snacks 35% margin, and fountain drinks have a product cost of $0.14–$0.22 per 32oz serving.
Fuel margins: Couche-Tard reported U.S. fuel gross margins of $0.47/gallon in 2025, but net after fees and shrink lands at $0.05–$0.07/gallon. Independents should hold within $0.02–$0.04 above the lowest local price if they have a clear differentiator (food, clean bathrooms, faster pumps), and drop to match when within 3 miles of a hypermarket.
Labor costs: Average c-store associate pay was ~$12/hour in 2024; by 2027 operators need $2–$3 above local minimum wage to fill a shift. Rutter’s pushed starting wage to $18/hour in 2025, Wawa pays $16–$19, Sheetz $15–$17, Buc-ee’s $18–$22 with benefits. Turnover at $11/hour in a market where Target pays $15 runs 150%+ with a separation cost of $4,000–$6,000 per leaver per the Conexxus/CCRRC labor study.
Loyalty economics: Enrolled loyalty members visit 2.4x more often and spend 27% more per trip. For a store doing 800 trips per day, moving from 0% to 25% loyalty penetration at a $5/trip uplift is worth ~$365,000/year in incremental revenue at roughly 40% blended margin = $146,000 in profit. SMS open rates hit 98% versus email at 18–22%.
Shrink: Runs 1.6–2.4% of sales per NACS 2025 Asset Protection report. Solink at $79–$129/camera/month or Verkada at $1,200–$1,800/camera/year are the recommended loss-prevention investments.
Coffee program ROI: A modern coffee program—Curtis G4, Bunn Sure Tamp, or a bean-to-cup like Franke at $8K–$22K—pays back in 5–9 months at a $1.99 retail/$0.32 cost ratio. Operators brewing Folgers in a 1990s Bunn pot leave $60,000–$120,000/year in profit on the floor.
Tech stack costs: POS + fuel controller replacement runs $10,000–$20,000+ per site. Verifone Commander is $10K–$18K hardware plus $95–$150/month software. Gilbarco Passport is $12K–$20K install plus $120–$180/month. NCR Aloha CFS is $8K–$15K hardware plus $150–$250/month. PDI Enterprise back-office is $400–$1,200/month per site. For single-site independents, Petrosoft CStoreOffice at $199–$399/month is more appropriate.
Trade-offs and alternatives
Every decision in this playbook involves a trade-off between upfront investment, operational complexity, and speed of profit capture. The following trade-offs should guide an operator’s sequencing.
Foodservice versus tobacco shelf space. The single most common independent-operator failure is over-investing in tobacco SKU breadth and under-investing in foodservice. Tobacco is in secular decline at -3% to -5% annually as cigarette use drops and nicotine-pouch alternatives like Zyn and On! cannibalize the trip at lower ticket. The alternative is to carry the top 40 tobacco SKUs that cover 92% of demand and redirect that shelf space to packaged beverages (28–32% margin) and salty snacks (35% margin). The trade-off is short-term customer pushback from heavy tobacco buyers who expect full selection, but the profit lift from foodservice typically offsets any lost tobacco trips within 60–90 days.
Loyalty platform choice: Stuzo versus Liquid Barcodes versus Patron Points. Stuzo Open Commerce (now owned by PDI) is the most robust option—full white-label app and loyalty engine at $15K–$40K setup and $400–$1,200/month per site—but it is designed for chains of 5+ stores. Liquid Barcodes at $300–$700/month per site is easier for sub-50-store operators. Patron Points or Bikky at $99–$249/month provides basic punch-card-grade loyalty for single stores. The trade-off is feature depth versus cost. A single-store operator doing $2M–$4M inside should start with Liquid Barcodes or Patron Points and graduate to Stuzo at 5+ locations. Starting with Stuzo on one store wastes setup cost on features that require scale to pay back.
Coffee program: bean-to-cup versus drip versus pour-over. A bean-to-cup machine like Franke at $8K–$22K delivers the highest perceived value and margin (50–55%) but requires daily cleaning and staff training. A modern drip system like Curtis G4 at $3K–$6K is simpler and still delivers a 5–9 month payback. The alternative is to do nothing—keep the 1990s Bunn pot with Folgers—which avoids capital outlay but leaves $60,000–$120,000/year in profit on the floor. The trade-off favors the drip system for independents with high turnover and limited training bandwidth.
Pricing strategy: match fuel or lead on inside. Independents cannot out-price Costco or Sam’s Club on fuel. The trade-off is between matching the lowest local fuel price (which compresses already thin fuel margins to zero or negative) versus holding $0.02–$0.04 above the lowest price and using inside differentiation to justify the premium. The alternative—matching fuel and hoping inside sales make up the difference—fails because fuel price-sensitive customers rarely convert to inside buyers at higher rates. The correct trade-off is to hold fuel price slightly above the lowest competitor only when you have a clear inside differentiator (food, clean bathrooms, faster pumps), and drop to match when within 3 miles of a hypermarket.
Hiring: higher wage versus tip pooling versus cross-training pay bump. Raising starting wage to $18/hour (matching Rutter’s) is the simplest retention lever but adds ~$12,000–$15,000/year per full-time employee. The alternative is tip pooling on prepared food (adds $1.50–$3/hour effective wage at no cost to the operator) plus cross-training pay bumps of $0.50/hour per certified station. The trade-off is that tip pooling requires a functional foodservice program to generate tips, and cross-training requires management time to certify stations. The optimal sequence is to implement tip pooling and cross-training first, then raise base wage only if turnover remains above 100%.
Rollout plan
The following 30/60/90 sprint sequence is designed for an independent owner-operator starting on a Monday. Total investment to execute the full plan is $25K–$55K, and the EBITDA lift on a $3M store is $80K–$160K in year one.
Days 1–30: Audit and quick wins. Survey the three closest fuel competitors twice daily—manually or via OPIS RetailSuite at ~$300/month per site. Reprice fountain drinks from $0.99 to $1.49 (loses roughly 8% of units but lifts profit per drink by 65%) and coffee from $1.49 to $1.99 (the most profitable repricing move available this quarter). Cut tobacco SKUs to the top 40 that cover 92% of demand. Get Coca-Cola, Pepsi, Frito-Lay, and Anheuser-Busch reps to provide the 8-foot cooler and 4-foot snack planograms—they are free and built on IRI/Circana scan data. Install forecourt LED price toppers from Watchfire, Daktronics, or Optec at $8,000–$14,000 installed. These quick wins require no tech stack changes and should show measurable inside sales lift within two weeks.
Days 31–60: Tech stack and loyalty pilot. Launch a loyalty program using Liquid Barcodes ($300–$700/month per site) or Patron Points ($99–$249/month for single stores). The three rewards that drive repeat are free coffee on the 5th visit (coffee cost $0.32, perceived value $2.49), birthday free sandwich via SMS (52% redemption rate, drives a tied-purchase basket of $6–$9), and tiered fuel discount requiring $15 inside spend. Install PriceAdvantage for fuel-pricing automation at $300–$600/month per site. Implement 7shifts for scheduling at $34.99/location/month—post the schedule 14 days in advance and enable shift-trade self-service to cut no-shows by 22%. Set up SMS via Attentive ($500–$1,500/month) or Postscript ($100–$500/month), limited to 4 sends per month to keep unsubscribe rates below 3%.

Days 61–90: Foodservice and hiring. Upgrade the coffee program to a Curtis G4, Bunn Sure Tamp, or Franke bean-to-cup at $8K–$22K—payback is 5–9 months. Test a foodservice menu with three items: a $5 large coffee plus breakfast sandwich bundle (food cost ~$1.40, margin ~72%), a $3 fountain drink plus roller-grill item bundle (food cost ~$0.95, margin ~68%), and a buy-2-get-1 energy drink offer at full price (still 24% margin on the bundle, raises units-per-trip by 1.4x). Implement cross-training pay bumps of $0.50/hour per certified station (register, food, fuel, inventory)—costs $2/hour max but cuts call-outs because anyone can cover anyone. Launch employee referral bonuses of $300 ($150 at hire, $150 at 90 days). Add a health stipend of $150/month toward an ACA marketplace plan via Take Command Health at $20/employee/month admin. Schedule annual loyalty bonuses of $500 at 12 months and $1,000 at 24 months.
Related questions
What is the single highest-ROI acquisition motion for a convenience store in 2027?
Converting fuel customers into inside-store buyers. Industry average pump-to-store conversion is 35–40%; top-quartile operators push 55–65%. Every percentage point of conversion lift on a store doing 3,500 gallons/day is worth $28,000–$42,000 in incremental inside revenue per year.
How much should I spend on a loyalty program for a single-store independent?

Start with Patron Points or Bikky at $99–$249/month for basic punch-card-grade loyalty. Graduate to Liquid Barcodes at $300–$700/month per site at 2–5 stores, and Stuzo Open Commerce at $15K–$40K setup plus $400–$1,200/month per site at 5+ locations.
What is the most profitable repricing move I can make this quarter?
Raise fountain drinks from $0.99 to $1.49—product cost is $0.14–$0.22 per 32oz serving, so the $0.50 increase lifts profit per drink by 65% while losing only about 8% of units. Same logic applies to coffee: $1.49 to $1.99.
How do I compete with Costco and Sam’s Club on fuel?
You don’t. Hold within $0.02–$0.04 above the lowest local price if you have a clear inside differentiator (food, clean bathrooms, faster pumps). Drop to match when within 3 miles of a hypermarket, and reclaim margin on the inside basket.
What is the biggest mistake independent convenience store operators make?
Over-investing in tobacco shelf space and under-investing in foodservice. Tobacco is in secular decline at -3% to -5% annually, while foodservice carries 50–55% margin and is the only category growing in unit volume. Carry the top 40 tobacco SKUs and redirect shelf space to higher-margin categories.
FAQ

What’s the single biggest profit driver for a convenience store in 2027? Inside-the-box sales, especially foodservice, are where the real margin lives. While fuel brings in most of the revenue, roughly 70% of profit comes from inside the store, and foodservice alone accounts for 28.7% of in-store sales and 39.6% of in-store gross margin. Operators who anchor their strategy around fresh food and prepared items tend to see the strongest bottom-line results.
Do I need to invest in expensive tech to follow this playbook? Not necessarily top-of-the-line from day one, but the right tech stack—like PDI for back-office, Verifone or Gilbarco for payment and fuel systems, and NCR for point-of-sale—can streamline operations and improve customer experience. Many independent stores start with a modern POS and a basic loyalty program, then layer in more advanced tools as margins grow. The key is choosing systems that integrate well rather than buying everything at once.
How fast can I expect to see results if I implement the 30/60/90 sprint? Results vary, but many operators see early wins in the first month, like improved labor scheduling or a cleaner store layout that boosts impulse buys. By day 60, you might notice a measurable lift in foodservice sales or customer retention metrics. Full transformation, especially in pricing and category management, often takes the full 90 days to show consistent profit improvement.

Is this playbook only for independent stores, or can chains use it too? It is designed with independent owner-operators in mind, but the core principles—focusing on foodservice margin, optimizing the tech stack, and running a structured sprint—apply to chains as well. Larger operations may need to adapt the hiring and pricing sections to fit their scale, but the customer acquisition and retention tactics work across store sizes.
What about competition from big-box retailers and quick-service restaurants? Convenience stores win on speed and location, not price wars. The playbook emphasizes using foodservice as a differentiator—think fresh grab-and-go items, local partnerships, and loyalty programs that reward frequent visits. You do not need to match big-box pricing if you deliver better convenience and a curated in-store experience.
How do I handle hiring and training with such tight margins? Start by cross-training existing staff and using part-time or flexible shifts to manage labor costs. The playbook recommends focusing on a few key roles—like a foodservice lead and a shift supervisor—who can drive consistency. Investing a little more in training for those positions often pays off through higher sales per employee and lower turnover.
Sources
- NACS State of the Industry Annual Report — convenience.org
- CSP Daily News — Foodservice Drives Sales at U.S. Convenience Stores in 2024
- C-Store Dive — The pay problem: wages remain c-stores' biggest labor barrier
- Convenience Store News — C-stores Redefine & Elevate Their Loyalty Programs
- Petrosoft — How Much Does a C-Store POS System Really Cost?
- Verifone Convenience Store POS Product Line
- C-Store Dive — Yesway shifting its loyalty program to Stuzo
- Paytronix — How Much Do Convenience Stores Make (2025 stats)
- CCRRC — Convenience Industry Action Plan for Becoming an Employer of Choice
- NACS Magazine — Inside the Store (June 2025)
Related on PULSE
This page will be disappearing soon. Save it to your device for $1 — or read it free while it is here.
@Kory-White- · if Venmo asks, the last 4 of my number are 2012
This page is gone.
This one is off the shelf now. $1 keeps it on your phone for good — the whole page, pictures and diagrams included.
 gtm-playbookGTM Playbook for Plumbing Services in 2027
 gtm-playbookSales-as-a-Service GTM Playbook 2027 — Outsourced SDR + AI-Augmented Prospecting + Clay and the 48M memoryBlue Operator Path
 gtm-playbookWhat do top-performing SDR teams do differently in their outreach sequencing in 2027?
 pulse-recentWhat are the concrete steps to recruit and sign your first 10 channel partners in 2027?
 gtm-playbookHow do you build a compliance training platform go-to-market motion in 2027?
 gtm-playbookWhat is the go-to-market playbook for category creation in 2027?
 gtm-playbookGTM Playbook for Tax Attorneys in 2027
 gtm-playbookFractional CRO Services GTM Playbook 2027 — MEDDPICC + Agentforce + AI-Augmented Sales and the 8M Pavilion Operator Path
 gtm-playbookGTM Playbook for FinTech — The Complete Operator Guide in 2027
 gtm-playbookHow do you build a procurement and spend management go-to-market motion in 2027?