
gp0572
 Curated byKory White · Fractional CRO · Maryland
 PULSEKNOWLEDGE LIBRARY
The 2027 go-to-market playbook for solar energy developers replaces one-time hardware selling with a bundled energy-as-a-service motion: segment by roof, rate, and interconnection reality; sell solar plus storage on predictable monthly payments; win distribution through installer and utility partnerships; and monetize the fleet afterward through virtual power plant and grid-services revenue.
The go-to-market motion in one picture
Most solar developers still describe their commercial motion as a funnel that ends at installation. That framing is the root cause of the margin compression the industry keeps complaining about. The moment the panels are energized, a hardware-sale business has extracted all the value it will ever extract from that customer, and every subsequent dollar of growth has to be bought again at full acquisition cost. The 2027 playbook treats installation as roughly the midpoint of the customer relationship, not the finish line, and the diagram below is the shape you are actually building.
Read the motion in four blocks. The first block is qualification against physical reality. Solar is unusual among go-to-market problems in that a large fraction of your addressable audience is disqualified by facts you can determine before a human ever speaks to them: roof orientation and pitch, shading, roof age, panel-ready electrical service, ownership versus rental, utility rate structure, and whether the local interconnection queue is functional. A developer that spends sales capacity discovering these facts in a live conversation is burning its most expensive resource on work a data layer should have done. Aerial imagery, irradiance modeling, and utility rate data can pre-score a territory down to the parcel, so the sales team only touches households and buildings where a viable system exists.
The second block is consultative close. Despite years of predictions, self-serve checkout has not taken over residential solar, and for a defensible reason: the purchase is a multi-year financial commitment tied to a household's largest asset, with tax, financing, and roof-condition variables that most buyers cannot resolve alone. Digital channels are extremely good at producing a qualified, pre-educated buyer who wants a conversation. They are poor at replacing the conversation. Design your website, quoting tools, and paid social as a qualification engine whose conversion event is a booked consultation, not a signed contract.

The third block is operational delivery — permitting, interconnection, procurement, scheduling, installation, inspection, and permission to operate. This is where signed contracts die. Deals that clear sales but stall in the queue are worse than deals you never sold, because you have already paid the acquisition cost, sometimes paid a commission, and now carry an angry customer through a multi-month wait. In a mature market the delivery block is a go-to-market function, not a back-office function, because cycle time directly determines cancellation rate and referral volume.
The fourth block is the recurring layer: monitoring, service, performance reporting, storage or EV-charger attach, and enrollment in grid-services programs. This is the block that separates a durable energy-services company from a project shop.
The loop at the bottom is the whole point. Referral density inside a neighborhood is the cheapest acquisition channel in this industry and the one national advertising budgets cannot buy. Every operational decision — install quality, crew behavior on site, how fast you answer a production complaint — feeds that loop or poisons it.
Who owns what across the revenue org
Solar developers routinely under-invest in role definition because the business started as a sales organization with an install crew attached. By 2027 the functional map needs to look much closer to a modern recurring-revenue company, with clear ownership at each handoff.

Territory and market analytics owns the pre-scoring layer described above. This is a small, high-leverage function — often one or two analysts — that decides where the company sells. It maintains the parcel-level scoring model, tracks interconnection queue health by utility, monitors rate-case and net-metering dockets that change payback math, and publishes a ranked territory list that marketing and sales are expected to work. When this function does not exist, sales leadership picks territories by intuition and the company discovers a broken interconnection queue only after it has sold fifty systems into it.
Demand generation owns cost per qualified consultation, not cost per lead. That distinction matters enormously. Lead-cost optimization pushes teams toward cheap, unqualified volume — sweepstakes-style forms, aggressive lead aggregators, low-intent social traffic — that inflates top-of-funnel metrics while destroying sales capacity. Holding this team to cost per *held consultation with a qualified property* forces the upstream filtering that protects the closers.
Channel and partnerships owns the relationships that produce warm volume: roofing companies, HVAC contractors, electricians, home builders, real estate brokerages, municipal utilities, and electric cooperatives. Treat this as a quota-carrying function with its own enablement budget. Partners need co-branded proposal materials, training on the storage and grid-services value proposition, transparent commission structures, prompt payment, and visibility into the status of the deals they sent you. A roofer who refers a customer and then hears nothing for six weeks stops referring.

Field sales / energy consultants own close rate, contracted price per watt, and — critically — the accuracy of what they promised. Compensation design is the biggest lever here. If commission pays fully at contract signature, you have built an incentive to oversell savings, understate roof work, and hand operations an undeliverable deal. Splitting commission between signature and permission-to-operate, with clawback on cancellation, aligns the closer with the delivery team. This single change fixes more downstream pain than any CRM implementation.
Project delivery owns cycle time from signature to permission to operate, and cancellation rate within that window. Give this function real authority to reject deals that cannot be delivered as sold. A delivery organization that cannot say no is just a complaint queue.
Customer success and grid services own everything after activation: production monitoring, service dispatch, annual performance reviews, attach of storage or EV charging, and enrollment into virtual power plant programs. Staff this function before you think you need it. The first year after a wave of installations is when systematic underperformance surfaces, and the company that catches it proactively keeps its referral engine intact while the company that waits for phone calls does not.
Two handoffs deserve explicit contracts. The sales-to-delivery handoff should include a standardized design package, confirmed roof condition, confirmed electrical service capacity, and a signed set of customer expectations about timeline. The delivery-to-success handoff should include as-built system specs, the production model the customer was sold, and any commitments made during installation. Undocumented promises made on a roof become churn eighteen months later.
Metrics, targets, and realistic ranges
The measurement system most solar developers inherited counts systems sold and watts installed. Those are output metrics, not management metrics, and they tell you almost nothing about whether the business is healthy. Here is the instrument panel that actually governs a 2027 playbook.
Customer acquisition cost expressed per watt. Normalizing acquisition spend to system size is the only way to compare a residential motion against a commercial one, or a partner channel against paid digital. Track it fully loaded — media spend, sales compensation, partner commissions, and the cost of consultations that did not close — because the partial version flatters every channel equally and ranks none of them correctly. Then compare CAC per watt against gross margin per watt from the same cohort. If a channel's acquisition cost consumes most of the installed margin, it is only viable if the recurring layer pays it back, and you should know explicitly whether you are making that bet.
Cycle time from signature to permission to operate, measured as a distribution rather than an average. Averages hide the tail, and the tail is what cancels. Segment by utility and by jurisdiction, because the variance between two neighboring municipalities can be larger than the variance between two states. Publish the distribution internally so sales knows which territories are honest to sell into.

Cancellation rate within the delivery window, split by root cause: financing fallout, roof condition discovered late, customer remorse, competitive re-quote, and timeline frustration. Each cause has a different fix. Financing fallout means you are pre-qualifying too loosely. Roof discoveries mean your site assessment is too shallow. Timeline frustration means delivery capacity is behind sales capacity, and the correct response is to slow sales, not to push delivery harder.
Close rate by channel and by lead source, held against consultation quality. A channel producing a high close rate on tiny systems may be worth less than a lower-converting channel producing large ones, so always pair close rate with average system size.
Attach rate for storage, and increasingly for EV charging. In jurisdictions where export compensation has been reduced, storage attach is not an upsell — it is what makes the economics work at all, and a low attach rate in such a market signals that your sales team is still selling the old value proposition.
Post-activation metrics are where the energy-as-a-service thesis is proven or disproven: service ticket rate per hundred systems in year one, mean time to resolution, percentage of fleet enrolled in grid-services programs, revenue per enrolled system, and net promoter score measured at activation and again at twelve months. The gap between those two NPS readings is a leading indicator of your referral engine's future output.

Referral share of total volume is the single best summary metric for a local solar business. It compounds. A developer whose referral share is rising is building neighborhood density, which lowers install logistics cost, raises brand trust, and reduces dependence on paid channels. A developer whose referral share is falling is quietly buying its growth and will be squeezed the moment acquisition costs rise.
On targets: avoid importing benchmark numbers from national reports and treating them as goals. Payback periods, achievable price per watt, permitting timelines, and incentive stacking vary so much by state, utility, and customer segment that a borrowed benchmark is usually misleading. Build your own baseline from your first few hundred projects, publish it internally, and manage improvement against your own trend line. The one broad rule that travels: the recurring layer should be growing faster than the hardware layer, because that ratio is what determines whether you are building an asset or a treadmill.
Where the motion breaks down
Five failure patterns account for most of the developers who stall out, and all five are go-to-market failures rather than technology failures.

Incentive dependence. Building a model whose margin exists only because of a specific tax credit, rebate, or export-compensation rule is a bet that policy will not change — and policy in this sector changes constantly, at federal, state, and utility levels. Stress-test your unit economics against a scenario where a major incentive is reduced or expires. If the business is unprofitable in that scenario, you do not have a business; you have a policy position. The practical response is to build the offer around durable value — bill predictability, resilience during outages, hedging against rate escalation — so that incentives accelerate demand rather than create it.
Selling ahead of delivery capacity. This is the most common self-inflicted wound. Sales compensation and marketing spend scale quickly; permitting throughput, crew capacity, and electrician availability do not. The gap shows up first as lengthening cycle time, then as rising cancellations, then as negative reviews, and finally as a collapsed referral channel — by which point the fix takes a year. Manage a sold-backlog-to-install-capacity ratio explicitly, and be willing to throttle demand generation when it exceeds what delivery can absorb.
Competing on price. Price-led marketing trains buyers to shop your quote against three others, commoditizes the offer, and compresses the margin you need to fund customer success. It also selects for the least loyal customers. The alternative is not to be expensive for its own sake but to sell a different thing: a managed energy relationship with monitoring, service, performance guarantees, and grid-services participation. Those attributes are hard to compare across quotes, which is precisely the point.
Underestimating interconnection and permitting. Deals die in the queue. A developer that treats utility relationships and permitting workflow as administrative overhead will consistently be outperformed by one that treats them as a competitive moat. Standardized designs that fit a utility's fast-track criteria, dedicated permitting staff who know each jurisdiction's reviewers, and early queue positioning for larger projects are all go-to-market investments with direct revenue consequences.
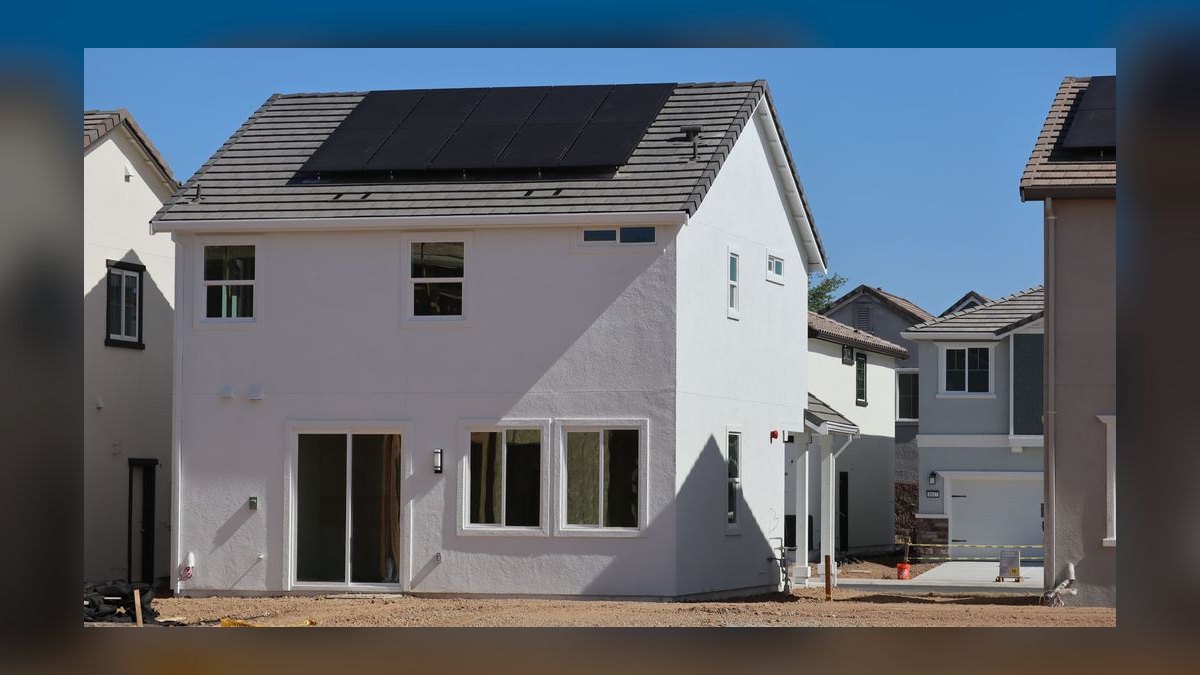
Neglecting local trust. Solar is bought in neighborhoods. A visible, well-executed installation on a prominent street produces more qualified demand than a large advertising buy, and a single bad install produces more damage than a good campaign can repair. Community presence, responsive service, local hiring, and a reputation that travels by word of mouth are not soft factors here — they are the acquisition strategy. This is also why post-sale service quality belongs in the go-to-market conversation rather than in an operations silo.
A sixth pattern deserves mention because it is subtler: channel conflict. When your direct sales team and your installer partners compete for the same households in the same zip codes, partners quietly disengage and you lose the cheaper channel to protect the expensive one. Define territory and lead-ownership rules explicitly before the conflict happens, and enforce them even when a direct rep complains.
How to sequence the build
Sequencing matters more than completeness. Developers who attempt the entire playbook simultaneously spread thin capital across a dozen half-built capabilities and end up strong at none. The order below front-loads the things that make everything downstream cheaper.

Start with the data and territory layer, because it determines the efficiency of every dollar you spend afterward. Until you can rank parcels and jurisdictions by viability, your marketing spend and sales capacity are being allocated by guess. This phase is analytical, not capital-intensive, and it usually pays for itself within a quarter through reduced wasted consultations.
Second, fix delivery before scaling demand. Measure current cycle time and cancellation causes, standardize designs to fit fast-track permitting criteria, build the utility relationships, and establish honest capacity numbers. Growth built on a broken delivery function converts marketing budget into refunds and bad reviews.
Third, build the partner channel, because it produces warm volume at structurally lower acquisition cost than paid digital and takes months to mature. Start it early so it is contributing by the time you scale spend.
Fourth, scale demand generation against the now-known good territories and the now-verified delivery capacity. This is the phase most companies do first, which is exactly why it usually disappoints them.

Fifth, layer in financing breadth. Offer a menu rather than a mandate: ownership for buyers who want the tax benefits and long-run economics, and subscription or contracted-rate structures for households that care more about monthly payment predictability than about headline system cost. The financing menu widens the addressable market without changing anything upstream.
Sixth, build customer success and the recurring layer — monitoring, proactive service, performance reporting, storage and EV attach motions, and grid-services enrollment. This is where lifetime value compounds and where the flywheel back to referral acquisition closes.
Two guardrails on this sequence. First, the loop from the recurring layer back to demand generation is deliberate: grid-services and service revenue should fund acquisition, allowing you to underprice competitors who have only hardware margin to work with. Second, the delivery gate is a real gate. If cycle time is not acceptable, do not advance to scaled demand generation, regardless of what the growth plan says. Every developer that ignored that gate learned the same lesson at greater expense.
Related questions
Should solar developers sell direct or through installer partners?
Both, with explicit territory rules. Direct sales give you margin control and brand ownership; installer and trade partners give structurally cheaper warm volume. The failure mode is channel conflict, so define lead-ownership boundaries before scaling either motion.
Is storage attach necessary or optional in 2027?
It depends entirely on your local export-compensation rules. Where export credits have been reduced, storage is what makes the economics work rather than an upsell. Check your utility's current rate structure before setting attach targets.
What is the best first metric to fix?
Cycle time from signature to permission to operate. It drives cancellation rate, referral volume, and working capital simultaneously, and improving it makes every marketing dollar downstream more productive.
How do smaller developers compete with national players?
Neighborhood density and service responsiveness. Local reputation, faster escalation paths, and visible community presence produce referral volume that national advertising budgets cannot replicate.
FAQ
What is the single biggest change in the 2027 solar go-to-market playbook?
The shift from selling hardware once to owning a multi-decade energy relationship. Everything else — bundling, financing menus, customer success staffing, grid-services enrollment — follows from that one strategic decision. Developers who make the shift measure themselves on retention and lifetime value; developers who do not remain project shops chasing the next incentive cycle.
How should acquisition cost be measured in a solar business?
Fully loaded and normalized per watt, including media spend, sales compensation, partner commissions, and the cost of consultations that did not close. Then compare it against gross margin per watt from the same cohort. Partial CAC calculations flatter every channel equally and rank none of them correctly, which leads to systematically bad budget allocation.
Does digital marketing replace the sales conversation?
No. Digital channels are excellent at producing an educated, pre-qualified buyer and poor at closing a multi-year financial commitment tied to a home. Treat the website and paid social as a qualification engine whose conversion event is a booked consultation, and hold that team to cost per held qualified consultation rather than cost per raw lead.
How do you keep incentive changes from breaking the business model?
Stress-test unit economics against a scenario where a major credit or export rule is reduced. Build the customer value proposition around durable benefits — bill predictability, outage resilience, a hedge against rate escalation — so incentives accelerate demand rather than create it. Treat every incentive as upside, never as foundation.
When should a developer hire dedicated customer success staff?
Before it feels necessary. The first year after a wave of installations is when systematic underperformance surfaces, and proactive detection protects the referral channel that drives your cheapest acquisition. Waiting for inbound complaints means the reputational damage has already spread through exactly the neighborhoods you are trying to penetrate.
What role do virtual power plant programs play commercially?
They convert an installed fleet into a recurring revenue stream and a retention tool simultaneously. Customers earning value from grid participation churn less, and that revenue can subsidize lower acquisition costs — a structural advantage over competitors working only from hardware margin. Availability varies by utility and program, so verify locally before promising it.
Sources
- U.S. Department of Energy — Solar Energy Technologies Office
- National Renewable Energy Laboratory — Solar Research
- Solar Energy Industries Association
- U.S. Energy Information Administration — Electricity
- Lawrence Berkeley National Laboratory — Electricity Markets and Policy
- NREL SolarAPP+ automated permitting
- Federal Energy Regulatory Commission
- Database of State Incentives for Renewables & Efficiency (DSIRE)
Related on PULSE
- [Inbound demand-capture GTM playbook in 2027](/knowledge/gp0511)
- [Sales-assisted PLG for mid-market in 2027](/knowledge/gp0510)
- [Reseller and VAR channel GTM playbook in 2027](/knowledge/gp0509)
- [International and geo-expansion GTM playbook in 2027](/knowledge/gp0508)
- [Vertical SaaS go-to-market playbook for healthcare in 2027](/knowledge/gp0507)
@Kory-White- · if Venmo asks, the last 4 of my number are 2012
 editorialMy Thoughts: Top 10 Product-Led Sales GTM Launch Playbooks in 2027
 gpWhat is the go-to-market playbook for nonprofit organizations in 2027?
 gpWhat is the go-to-market playbook for defense contractors in 2027?
 gpWhat is the go-to-market playbook for industrial equipment manufacturers in 2027?
 gpWhat is the go-to-market playbook for specialty chemical makers in 2027?
 gpWhat is the go-to-market playbook for online grocery services in 2027?
 gpWhat is the go-to-market playbook for beauty and cosmetics brands in 2027?
 gpWhat is the go-to-market playbook for furniture retailers in 2027?
 gpWhat is the go-to-market playbook for commercial cleaning services in 2027?
 gpWhat is the go-to-market playbook for oil and gas services in 2027?