


Sales Funnel — 5 Stages
Quality
Certified
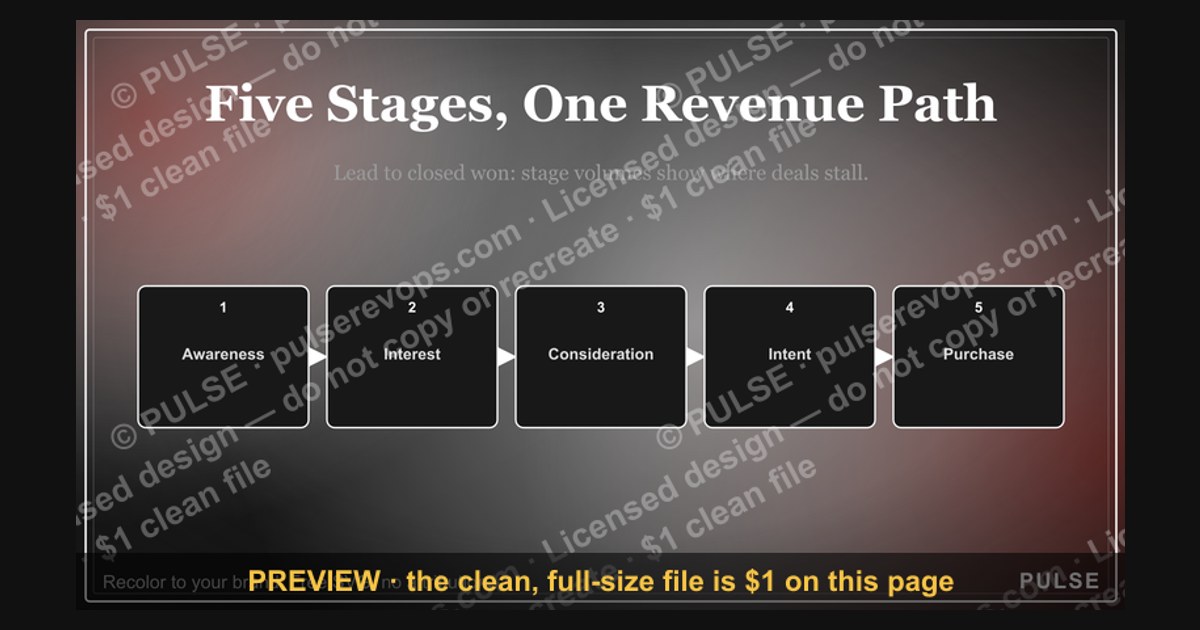
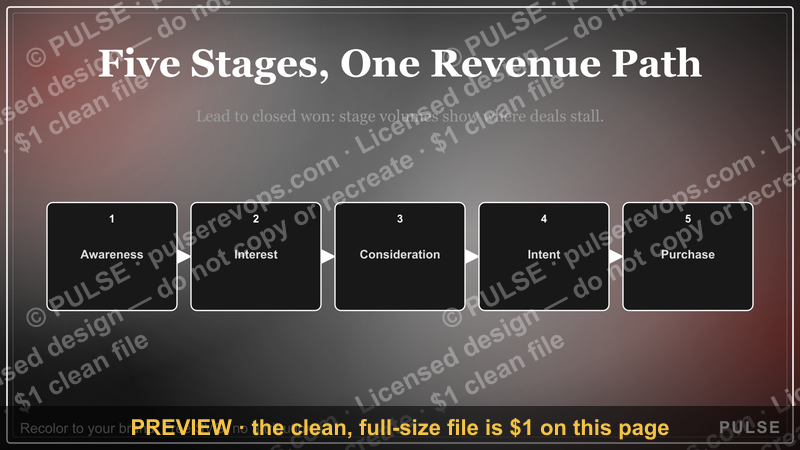
This process flowchart is a 1600×900 graphic titled "Sales Funnel — 5 Stages." It shows a prospect narrowing through five labeled stages — Awareness, Interest, Consideration, Intent, and Purchase — connected by directional arrows that widen at the top and taper at the bottom, visually representing drop-off. Marketing and sales teams use it to align on handoff points, define stage-exit criteria, and pinpoint exactly where volume is being lost.
What it is and why it matters
The graphic is a vertical funnel diagram, five horizontal bands stacked from widest at the top to narrowest at the bottom, each band carrying one stage name in bold sans-serif type: "Awareness," "Interest," "Consideration," "Intent," "Purchase." A thin arrow runs down the center connecting each band to the next, and a small label sits beside each arrow noting the typical owner of that transition — for example, "Marketing → Marketing" between Awareness and Interest, and "Sales → Sales" between Intent and Purchase. The color treatment shifts gradually from a cooler tone at the top band to a warmer tone at the bottom band, so a viewer can read temperature (cold lead to hot lead) at a glance without reading any text. A footer line on the graphic states the model name and the fact that it is a general framework, not a rigid rulebook — because no two companies define these five stages identically.
Why this exists as a single graphic rather than five separate bullet points: a funnel is fundamentally a story about attrition, and attrition is visual. A list of five words does not communicate that most of the people who enter at Awareness will never reach Purchase; a shape that narrows does. That narrowing is the entire point of the model. The five-stage funnel descends from the classic AIDA framework (Attention, Interest, Desire, Action) used in marketing and advertising for over a century, adapted here into a language most modern revenue teams already share — "top of funnel," "middle of funnel," "bottom of funnel" — with each named stage falling clearly into one of those three zones. Awareness sits at the very top of funnel; Interest and Consideration make up the middle; Intent and Purchase make up the bottom.

This graphic matters for three practical reasons a reader would actually act on. First, it gives sales and marketing a shared vocabulary — when a marketer says "this contact is at Consideration," a rep should be able to picture the same stage and the same set of behaviors that got them there, without a separate conversation to translate terms. Second, it forces a decision about ownership: the labels beside each arrow exist because every stage transition needs exactly one team or one person accountable for moving a prospect forward, and ambiguity about ownership is one of the most common reasons prospects go cold in the gap between stages. Third, it creates a diagnostic surface — because the stages are visually distinct and ordered, a team can plot where their actual numbers thin out fastest and treat that specific gap as the highest-leverage place to invest, rather than spreading effort evenly across a process that likely does not fail evenly.
The graphic deliberately avoids putting percentages or dollar figures directly on the shape itself, because those numbers vary enormously by industry, deal size, and channel, and a fixed number printed onto a template would mislead almost every team that adopted it as-is. Instead the structure is built to be annotated: teams that download the PNG typically overlay their own current-quarter numbers at each band using their own presentation software, turning a generic diagram into a live scorecard for their specific pipeline.
The step-by-step process for using this flowchart

The graphic is meant to be used in three passes: build, apply, and review. Below is the order most teams follow when adopting it, along with who typically owns each step and where the handoff to the next owner happens.
Step one: a marketing leader (or, on a lean team, whoever owns content and campaigns) defines in writing what qualifies a person as having entered "Awareness" — typically a first touch such as an ad click, a search visit, or a referral — and what separates that from "Interest," usually a repeat visit, a content download, or a newsletter signup. This definition should live in a shared document, not only in someone's head, because the entire funnel breaks down the moment two people on the team silently disagree about where a given prospect sits.
Step two: whoever owns the CRM or marketing automation platform (often a RevOps or marketing-ops function, and on smaller teams simply the person who administers the tool) builds the tracking and lead-scoring rules that move a contact automatically, or with minimal manual tagging, from one stage to the next based on the behaviors defined in step one. This is the step most teams underinvest in — without it, the funnel graphic is aspirational rather than operational, because nobody's system of record actually reflects where a prospect really is.

Step three: sales and marketing jointly define "Consideration" exit criteria — the point at which a prospect is judged sales-ready. This is the classic marketing-qualified-lead-to-sales-qualified-lead boundary, and it is the single most contested line in most companies, because marketing is typically incentivized on volume passed and sales is typically incentivized on quality received. Getting this step wrong (or skipping the negotiation entirely and letting one side dictate the line) is the single most common root cause of long-term funnel dysfunction.
Step four: a sales development rep, or the account executive directly on smaller teams, works the Intent stage — discovery calls, demos, proposal requests — with the explicit goal of confirming budget, authority, need, and timeline before a deal is treated as real pipeline. Step five: the account executive (or the founder, on very early-stage companies) owns the Purchase stage: negotiation, contracting, and close. Step six closes the loop — a RevOps function, or whoever owns reporting, reviews the stage-to-stage conversion numbers on a recurring cadence (commonly monthly, sometimes weekly for high-velocity, high-volume motions) and feeds anything learned back into step one, adjusting the criteria for future cohorts.
Costs, timelines, and specs for using and customizing the graphic

There is no licensing cost for adopting a five-stage funnel model itself — it is a widely used framework, not a proprietary methodology, and the graphic on this page is free to download as a PNG directly from this page. The real cost is organizational time, not money: the negotiation in step three above (agreeing where Consideration ends and Intent begins) commonly takes one or two working sessions between marketing and sales leadership, plus a follow-up session thirty to sixty days later once real data shows whether the agreed criteria actually predict closed deals. Building the underlying tracking in step two is the more variable cost — on a CRM the team already administers well, this can be configured in an afternoon; on a system with messy historical data or no existing lead-scoring logic, it can take several weeks of cleanup before the automated stage transitions are trustworthy.
Timelines for a prospect to move through all five stages vary enormously by deal size and buying complexity, and this page will not assign a single fabricated number to that journey because the honest answer is "it depends on your sales cycle." A low-price, self-serve product can see a prospect move from Awareness to Purchase in minutes on a single visit. A complex, multi-stakeholder enterprise sale can take many months, with a prospect sitting in Consideration or Intent for an extended stretch while multiple internal approvers weigh in. The correct approach for any team is to measure their own historical average time-in-stage once the tracking from step two is live, rather than borrowing a benchmark from a company with a different product, price point, or buyer.
On the specs side: the downloadable graphic is rendered at 1600×900 pixels, a 16:9 ratio that drops cleanly into a slide deck, a wiki page, or an internal wiki without letterboxing. It is delivered as a PNG with a transparent-safe background so it can sit on a dark or light slide without a visible box around it. To swap the wording for an internal version, the five band labels and the two owner labels beside the arrows are the only text elements that need replacing — everything else (the shape, the color gradient, the arrow style) can stay as-is, which is why most teams treat this as a starting template rather than a finished internal asset.
Where teams get this wrong

The most common failure is treating the graphic as a wall poster instead of a living model. A team prints or pastes the five-stage funnel into an onboarding deck once, everyone nods, and then nobody revisits it — meanwhile the CRM's actual stage names drift out of sync with the poster within a quarter because nobody assigned step six (the recurring review) to a real owner. The fix is mechanical, not motivational: put the review on a recurring calendar invite with a named owner, the same way a team would for a weekly pipeline call.
The second most common failure is stage inflation — sales quietly redefines "Intent" downward so that more of the pipeline counts as further along than it actually is, usually under pressure to hit a forecast number. This produces a funnel graphic that looks healthy while the underlying win rate quietly erodes. The countermeasure is to define each stage by an objective, externally verifiable behavior (a scheduled second call, a signed NDA, a submitted proposal) rather than a rep's subjective judgment call, so stage placement cannot be adjusted by opinion alone.

The third failure is the marketing-sales handoff gap referenced in step three: marketing declares a lead "sales-ready" and moves it to Consideration, sales disagrees and ignores it, and the lead sits untouched while both teams' dashboards show it as active. This is a coordination failure, not a funnel-design failure, and no amount of redrawing the graphic fixes it — it requires the actual negotiated agreement described above, revisited whenever either team's targets change materially.
A fourth failure is using the same five stages for every channel and every deal size without exception. A five-stage model built around a considered, multi-touch sale will misrepresent a fast, low-touch transaction — Awareness and Purchase might happen in the same session, making Interest, Consideration, and Intent effectively meaningless as distinct stages for that segment. Teams running more than one distinct go-to-market motion (for example, a self-serve tier and an enterprise tier) generally need a variant of the funnel per motion rather than forcing both through one shape.
A fifth, quieter failure is treating the narrowing shape itself as evidence of a healthy business. A funnel that narrows sharply between every stage is not automatically failing, and one that narrows gently is not automatically healthy — the right question is always whether the conversion rate between two specific stages is improving or worsening over time for this specific company, not whether the shape resembles a textbook triangle.
Decision framework: when to customize the wording, colors, or roles

Not every team should use the five labels exactly as drawn, and the decision tree above reflects the most common branch points. The first fork is buying motion. A self-serve or product-led company, where a prospect can sign up and start using the product without ever speaking to a person, generally gets more value from compressing the model to three stages — Awareness, Trial, Purchase — because "Interest" and "Consideration" collapse into a single in-product trial experience that doesn't map cleanly to two separate CRM stages. A standard B2B company with one primary decision-maker fits the five stages as labeled without modification. An enterprise motion involving procurement, legal review, and multiple stakeholders often benefits from splitting Consideration into two distinct stages — an internal Evaluation stage and a separate Procurement stage — because those two phases have different owners, different typical durations, and different reasons a deal stalls.
The second fork is ownership. Teams where marketing nurtures a lead all the way through Consideration before handing to sales should relabel the arrows to show that handoff explicitly at the Intent boundary, so anyone looking at the graphic understands exactly where accountability shifts. Teams running a sales-led motion from the very first contact — common in high-touch enterprise sales where an account executive is involved from the first outbound email — should relabel every arrow as staying with sales throughout, and drop the marketing handoff annotation entirely rather than leaving a misleading label on the graphic.

Color and visual customization matter less than the label and ownership decisions, but two adjustments are worth making deliberately rather than leaving default. If the graphic will sit inside a slide deck with an established brand palette, swap the gradient to the brand's own colors rather than the default cool-to-warm scheme, keeping the same principle (a visually distinct progression from top to bottom) rather than using five unrelated colors that carry no directional meaning. If the graphic will be shown to a non-revenue audience — an executive team, a board, new-hire onboarding — consider adding one supporting number per stage (this quarter's actual count or conversion rate) directly onto a duplicated copy of the PNG, while keeping the original clean template unedited for future quarters.
Related questions
What's the difference between a lead and a marketing-qualified lead (MQL)?
A lead is any contact captured at any funnel stage. An MQL is a lead that has met the specific, agreed-upon criteria for the Consideration stage — meaning marketing judges them ready to be evaluated by sales, though sales may still disqualify them after review.
How many stages should a sales funnel actually have?
As many as there are meaningfully distinct buyer behaviors and ownership handoffs in your specific sales process — commonly three for self-serve motions, five as a general-purpose default, and six or more for complex enterprise sales with procurement steps.
What's the difference between a sales funnel and a sales pipeline?
A funnel describes the buyer's journey and typically covers the full range from anonymous awareness through purchase. A pipeline describes the seller's active, in-progress opportunities and usually starts later, once a lead has been qualified as a real prospect.
Why does my funnel narrow so sharply between Consideration and Intent?

That gap is almost always the marketing-to-sales handoff. Sharp narrowing there usually points to a mismatch between what marketing considers "ready" and what sales is willing to actively work, rather than a genuine lack of buyer interest.
Should marketing or sales own the Awareness and Interest stages?
Marketing typically owns both, since these stages involve content, advertising, and top-of-funnel campaigns that happen before a prospect has engaged directly with a salesperson. Sales involvement usually begins at Consideration or Intent.
FAQ
What are the five stages of a sales funnel? Awareness, Interest, Consideration, Intent, and Purchase. Awareness is a prospect's first exposure to a brand or problem; Interest is repeated, voluntary engagement; Consideration is active evaluation against alternatives; Intent is a clear signal of buying readiness such as a demo or proposal request; Purchase is the closed transaction.
Is the five-stage funnel the same as AIDA? It's a close descendant. AIDA (Attention, Interest, Desire, Action) is the century-old advertising model this framework is built on; the five-stage version renames and slightly subdivides AIDA's stages to match how modern marketing and sales teams track contacts in a CRM.

Can a prospect skip stages in this model? Yes, especially in fast or low-price purchases. The model describes a typical path, not a mandatory sequence every buyer must follow one step at a time — a referred prospect might enter directly at Consideration, having already formed Awareness and Interest through the person who referred them.
Who should be responsible for defining the funnel stages at a company? Ideally a joint decision between marketing and sales leadership, since both teams' work depends on the definitions and both are affected when the definitions are wrong. A RevOps function, where one exists, typically facilitates the agreement and owns the ongoing measurement.
How often should stage-exit criteria be revisited? Most teams review quarterly at minimum, and more frequently during periods of rapid growth or when conversion rates between stages shift noticeably. Criteria that made sense at one company size or product stage often stop fitting as the buyer base changes.
Does this funnel model work for e-commerce, not just B2B software? Yes, with relabeling. E-commerce teams commonly keep Awareness and Interest as-is, replace Consideration with "Cart" or "Comparison," and replace Intent and Purchase with "Checkout Started" and "Checkout Completed," preserving the same narrowing logic with retail-specific terminology.
Sources
- https://www.hubspot.com/sales-funnel
- https://www.salesforce.com/resources/articles/sales-funnel/
- https://www.investopedia.com/terms/s/sales-funnel.asp
- https://www.gartner.com/en/sales/glossary/sales-funnel
- https://www.zendesk.com/blog/sales-funnel/
- https://www.pipedrive.com/en/blog/sales-funnel
- https://hbr.org/topic/subject/sales
- https://www.forrester.com/blogs/category/sales/
Related on PULSE
- What's the difference between an MQL and an SQL?
- How do you calculate conversion rate between funnel stages?
- What is a sales pipeline and how is it different from a funnel?
- How do you build a lead scoring model?
- What causes leads to go cold between marketing and sales handoff?
- How many touchpoints does it typically take to move a lead through the funnel?
This page will be disappearing soon. Save it to your device for $1 — or read it free while it is here.
@Kory-White- · if Venmo asks, the last 4 of my number are 2012
This page is gone.
This one is off the shelf now. $1 keeps it on your phone for good — the whole page, pictures and diagrams included.
 graphicPLG Conversion Funnel
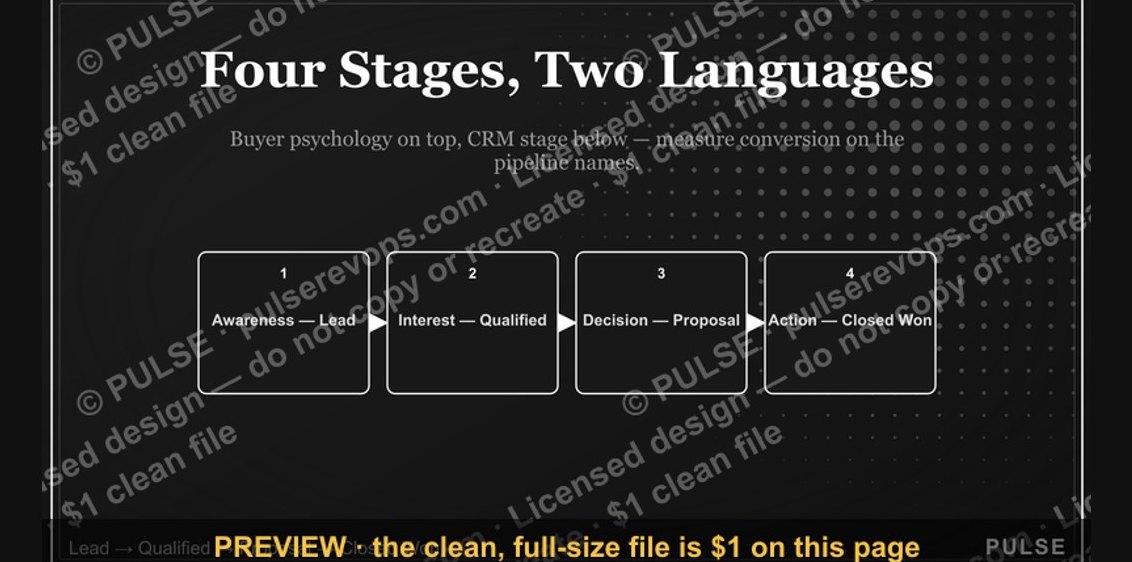 graphicSales Funnel — 4 Stages
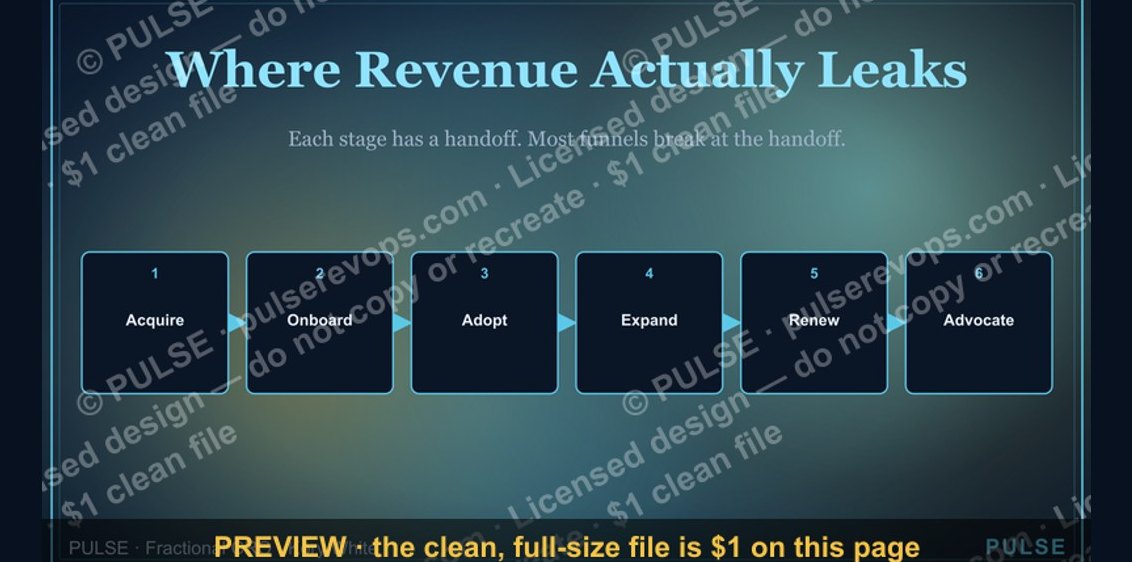 graphicCustomer Lifecycle Funnel
 graphicMarketing Funnel — TOFU MOFU BOFU
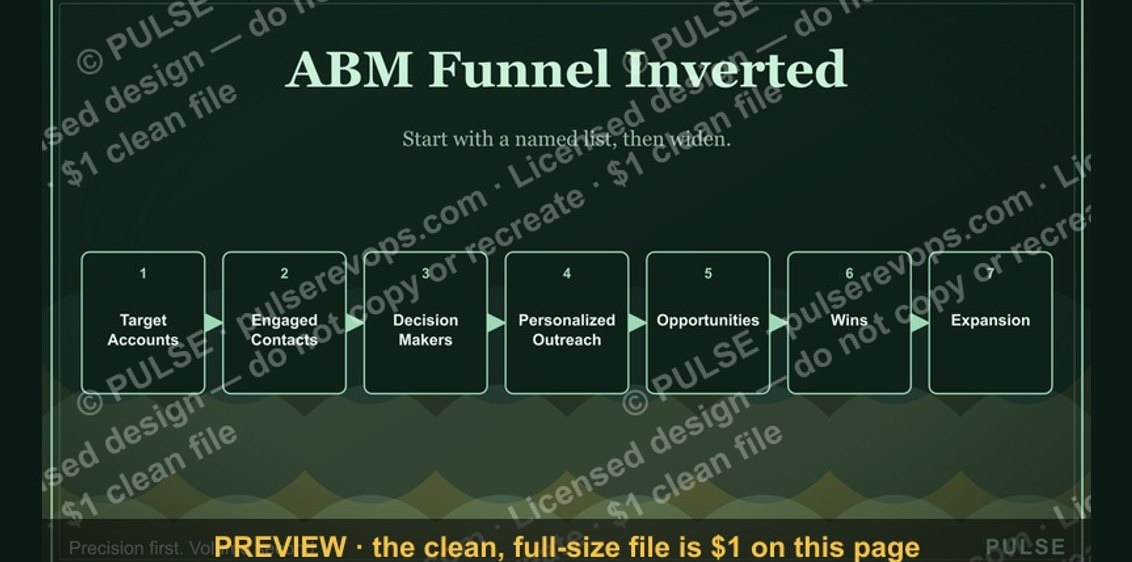 graphicABM Funnel Inverted
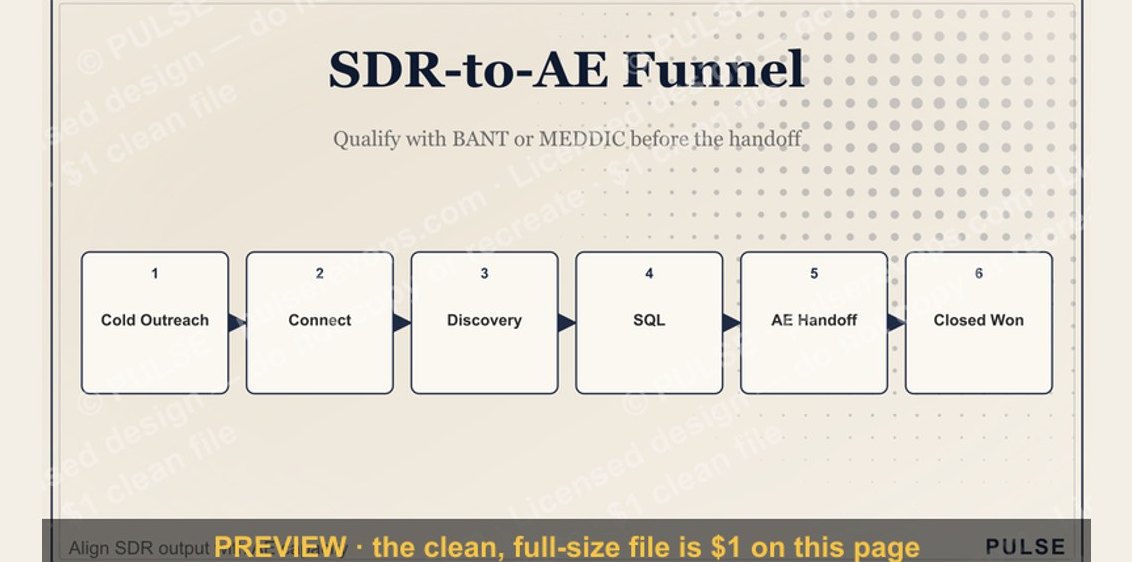 graphicSDR-to-AE Funnel
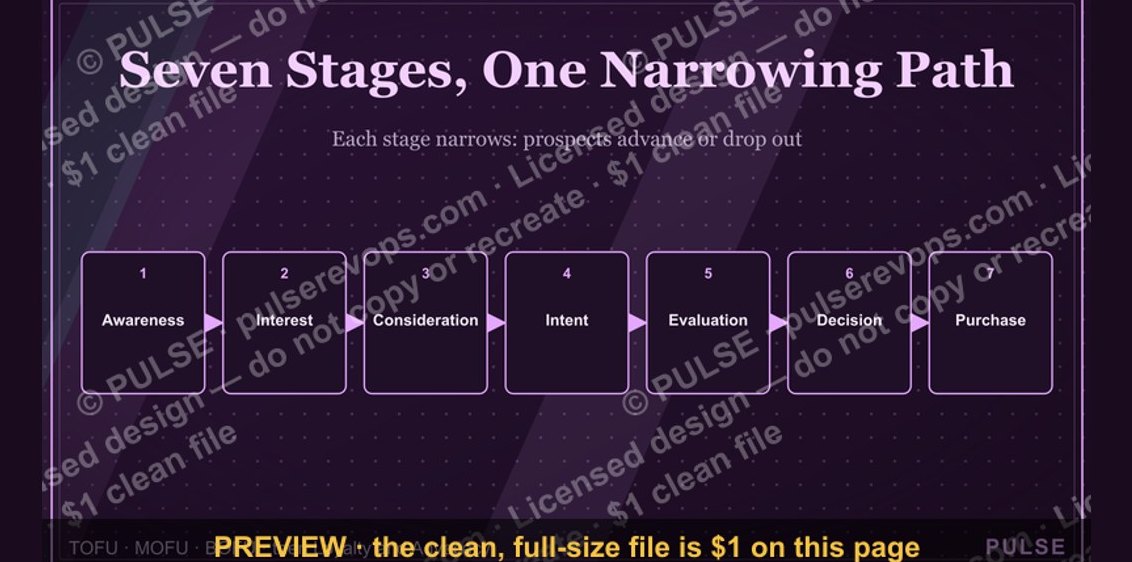 graphicSales Funnel — 7 Stages
 graphic“SHOULD DO IT” — Sales Meme
 graphic5 Stages of a Healthy Pipeline — Infographic
 graphic“Be the signal, not the noise.” — Quote Card