


Customer Lifecycle Funnel
Quality
Certified
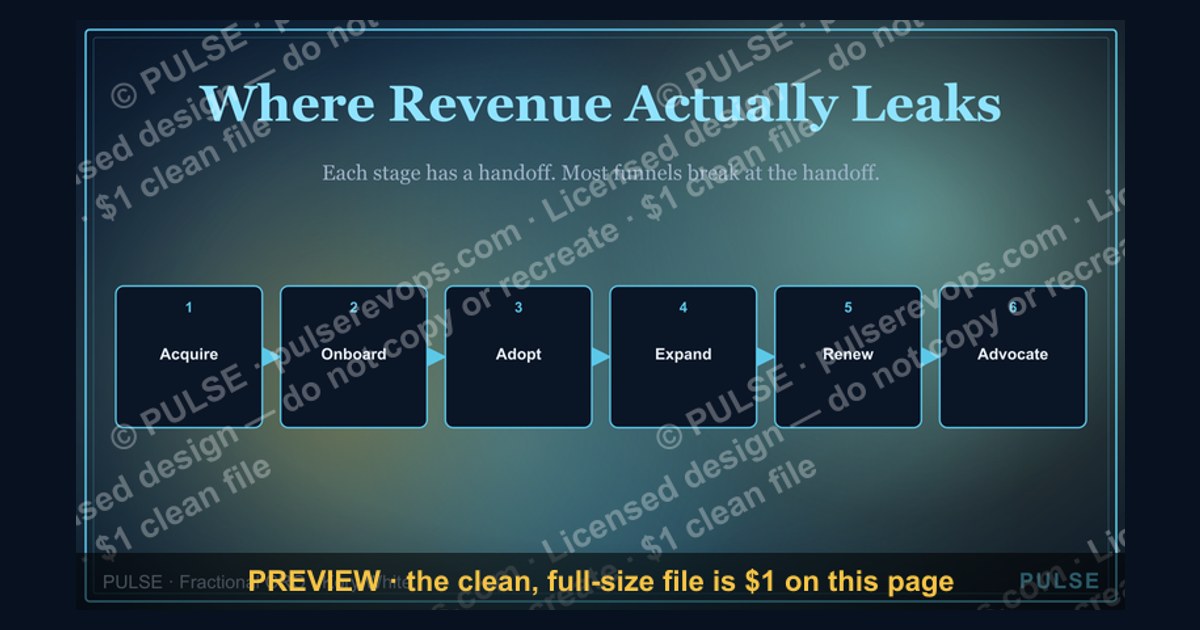
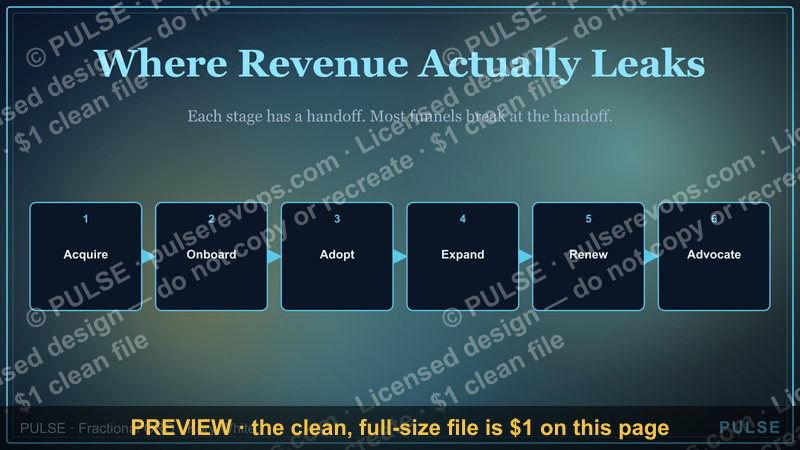
This process flowchart maps the Customer Lifecycle Funnel as a single horizontal chain of stages, from first anonymous touch through purchase, onboarding, adoption, renewal, and advocacy. Each stage carries the entry signal, the exit criteria, and the metric that gates progression, so marketing, sales, onboarding, support, and success teams all read the same picture and argue about the same numbers.
What it is and why it matters
The Customer Lifecycle Funnel is the operating model that tracks a person from stranger to repeat buyer to referrer. It is deliberately wider than a marketing funnel (which usually stops at lead capture) and wider than a sales pipeline (which usually stops at closed-won). A pipeline answers "will this deal close this quarter." A Lifecycle Funnel answers "is this person moving toward durable value, and where do they stall." Those are different questions, and companies that only run pipelines routinely lose accounts they already won.
The distinction matters because revenue in most subscription and repeat-purchase businesses is back-loaded. If a typical contract is $12,000 in year one and the gross margin on renewal is 80%+ while the gross margin on the initial sale might be 40% after acquisition cost, then the second and third years carry most of the profit. A funnel that stops measuring at signature is blind to exactly where the money is.
Three things make the Lifecycle Funnel a genuinely different instrument from a pipeline:
It is time-based, not just value-based. Pipeline stages advance on buyer actions (demo booked, proposal sent). Lifecycle stages advance on elapsed behavior — days to first login, days to first integration, weeks to first realized outcome. A deal can close in 30 days and still be a failed Customer if nobody logs in for six weeks afterward.

It is owned by multiple teams across one shared definition. Marketing owns awareness and acquisition, sales owns purchase, onboarding owns activation, support owns resolution, customer success owns adoption and renewal, and marketing re-enters at advocacy. If each team keeps its own stage names, handoffs leak. The single most common failure is that "qualified" means one thing to marketing and another to sales, so the handoff is measured against two different denominators.
It is circular, not linear. The advocacy stage feeds new prospects back into awareness. Referrals and case studies are not a nice-to-have; they are the cheapest acquisition channel in the model, and a Lifecycle Funnel that treats advocacy as an afterthought will show rising acquisition cost over time.
Why it matters operationally: without one shared funnel, you cannot answer "where do we lose the most people" with a number. With one, you can. If 1,000 people enter awareness, 220 become leads, 60 become opportunities, 18 close, 14 activate, 9 adopt, 7 renew, and 2 refer, you now have a conversion rate at every seam. You can compute that the biggest absolute drop is awareness-to-lead (780 lost) but the biggest percentage drop is opportunity-to-close (70% lost), and those two facts justify completely different investments.
The step-by-step process
The funnel below shows the canonical seven-stage progression. Read it left to right as a person's journey, and read each arrow as a measurable conversion with an owner.

The advocacy-to-awareness loop is the part most teams forget to instrument. When it works, it lowers blended acquisition cost; when it is unmeasured, you cannot tell whether referrals are growing or quietly dying.
Here is the same funnel expressed as a working sequence with owners, entry signals, exit criteria, and the metric that gates each step. This is the version to actually put in a spreadsheet.
Step 1 — Awareness. Owner: marketing. Entry signal: any impression, session, or mention. Exit criteria: the person is identifiable (cookie, form, or self-identified). Gating metric: reach and branded search volume. Typical range: 2–8% of raw reach becomes identifiable in a given quarter for mid-market B2B; consumer products run far lower on identifiable rate but far higher on volume.
Step 2 — Lead. Owner: marketing, with sales development support. Entry signal: contact information captured. Exit criteria: fit criteria checked against an ideal customer profile. Gating metric: marketing-qualified lead rate. Typical range: 15–30% of identified contacts pass a basic fit screen.
Step 3 — Qualified. Owner: sales development or a qualification function. Entry signal: fit confirmed. Exit criteria: a real problem, a real budget signal, and a real timeline. Gating metric: qualification-to-opportunity rate. Typical range: 25–40%.
Step 4 — Opportunity. Owner: account executive. Entry signal: active evaluation with a named champion. Exit criteria: commercial terms accepted. Gating metric: win rate. Typical range: 15–30% for mid-market, higher for self-serve motions, lower for enterprise.

Step 5 — Customer (first purchase). Owner: sales, handing to onboarding. Entry signal: signature or first payment. Exit criteria: kickoff complete. Gating metric: time-to-kickoff. Typical range: 1–10 business days.
Step 6 — Activation. Owner: onboarding or implementation. Entry signal: kickoff. Exit criteria: the first value moment — first integration live, first report run, first campaign launched, first invoice processed. Gating metric: activation rate within 30 days. Typical range: 55–75% for products with a clear setup path; much lower for products that require data migration.
Step 7 — Adoption. Owner: customer success. Entry signal: activated. Exit criteria: habitual use across the buying team, not just one power user. Gating metric: weekly active usage among licensed seats, or breadth of features used. Typical range: 40–60% of purchased seats active weekly is a common healthy band.
Step 8 — Renewal. Owner: customer success, with commercial support. Entry signal: contract 90–120 days from expiry. Exit criteria: renewal signed or repeat order placed. Gating metric: gross revenue retention and net revenue retention. Typical range: gross retention 85–92% for mid-market SaaS; net retention above 100% requires expansion.
Step 9 — Advocacy. Owner: marketing and customer success jointly. Entry signal: a successful renewal or a strong outcome. Exit criteria: public review, referral, or referenceable case study. Gating metric: referral-sourced pipeline share. Typical range: 10–25% of new pipeline for companies that actively run a referral program.
The handoffs are where the funnel actually lives or dies. Three specific handoff rules worth writing down:

- Sales to onboarding: a signed deal is not handed off until the onboarding team has the technical contact, the success criteria in writing, and a scheduled kickoff. Deals handed off without success criteria activate at noticeably lower rates.
- Onboarding to success: activation is defined by a specific, agreed event, not by "the customer seems happy." If the event has not happened by day 30, the account enters an escalation path.
- Success to marketing: every renewal above a satisfaction threshold triggers an advocacy ask. Do not ask everyone; ask the accounts that hit the value milestone.
If you are starting from nothing, the fastest way to build this is to pull 12 months of historical data and place every account into exactly one stage as of today. You will immediately see two things: stages that are empty (meaning nobody owns them) and stages that are backed up (meaning a handoff is broken).
Costs, timelines, and typical ranges
The honest answer on cost is that the funnel itself is free and the instrumentation is not. What you spend depends on how much of the journey you already instrument.
Tooling cost. A CRM with lifecycle stage fields (Salesforce, HubSpot, Pipedrive, and similar) is the baseline. Expect $25–$150 per user per month for mid-tier CRM seats, plus a product analytics tool for activation and adoption tracking at $200–$2,000 per month depending on event volume, plus a customer success platform if you are managing hundreds of accounts. A lean build for a 20-person revenue team typically lands between $1,500 and $5,000 per month all-in. Do not buy a customer success platform before you have clean stage definitions — you will just automate a broken model.
Build timeline. A realistic phased timeline:

- Weeks 1–2: define stages, entry signals, exit criteria, and owners in a single document. This is the highest-leverage work and it costs nothing but argument.
- Weeks 3–4: map existing data to the new stages. Expect 10–20% of records to be ambiguous or missing required fields.
- Weeks 5–8: build the reporting layer — one dashboard per stage with a conversion rate and a volume number.
- Weeks 9–12: instrument activation and adoption events in the product if they are not already tracked. This is usually the longest pole.
- Month 4 onward: run the funnel as a weekly operating review, not a quarterly report.
Realistic conversion ranges to sanity-check against. For B2B SaaS selling to mid-market, a full-funnel view often looks like: 1,000 identified leads → 250 qualified → 80 opportunities → 20 closed-won → 15 activated → 11 adopted → 9 renewed → 2–3 referrals. That is a 2% identified-lead-to-Customer rate and roughly 90% gross retention. If your numbers are wildly outside these bands in either direction, check your definitions before you celebrate or panic.
Cost of getting it wrong. The expensive failure is not a missing dashboard; it is misallocated spend. If a team believes its bottleneck is lead volume when the real bottleneck is activation, it will spend on acquisition to fix a retention problem. At a $3,000 customer acquisition cost, buying 100 extra leads to close 2 extra Customers costs $150,000 to fix a problem that a $20,000 onboarding redesign might have solved. That is the trade-off the funnel exists to make visible.
Time-to-value benchmarks worth tracking. Days from close to kickoff (target under 5 for self-serve, under 10 for assisted). Days from kickoff to activation (target under 30 for most products). Days from activation to first expansion conversation (typically 90–180). Months from first purchase to first referral (typically 6–12, which is why advocacy programs take a year to show compounding returns).
Where teams get it wrong

Mistake 1: Treating the funnel as linear when it is circular. Teams build beautiful left-to-right diagrams and then never instrument the advocacy loop. The result is an acquisition cost that creeps up year over year because the cheapest channel is being ignored. Fix: put referral-sourced pipeline on the same dashboard as paid pipeline.
Mistake 2: One funnel for wildly different segments. A self-serve $50/month product and a $150,000 enterprise contract do not share conversion rates, timelines, or stage definitions. Forcing them into one funnel produces averages that describe nobody. Fix: run segmented funnels with the same stage names but separate benchmarks.
Mistake 3: Defining activation by internal completion, not customer value. "Onboarding call completed" is an internal milestone. "First invoice processed" is a customer value moment. Teams that measure the former report high activation and still see churn. Fix: define activation as the earliest event that correlates with renewal, and validate that correlation against 12 months of history before you commit to it.
Mistake 4: Letting stage definitions drift across teams. Marketing says a lead is qualified when a form is filled; sales says it is qualified when a budget is confirmed. Both are reasonable, but if they are not the same definition, every conversion rate at that seam is fiction. Fix: one written definition per stage, reviewed quarterly, with a single owner.
Mistake 5: Measuring only the stages that are easy to measure. Awareness and advocacy are the hardest to instrument, so they get skipped, and the funnel becomes a lead-to-renewal funnel pretending to be a lifecycle model. Fix: accept imperfect proxies for the hard stages — branded search volume for awareness, referral code usage for advocacy — rather than leaving them blank.
Mistake 6: Optimizing the wrong seam. Teams usually optimize the stage with the worst percentage conversion. But the right target is the stage with the largest recoverable absolute loss multiplied by the value of a recovered Customer. A 70% drop at a stage with 20 people in it is 14 people; a 20% drop at a stage with 2,000 people in it is 400 people. The second is almost always the better investment.

Mistake 7: Reporting the funnel quarterly. Lifecycle problems compound slowly and then suddenly. A weekly or biweekly review of stage volumes catches a stalled handoff in week three rather than quarter three. The cadence is part of the design, not an afterthought.
Mistake 8: Confusing revenue retention with Customer retention. A company can show 105% net revenue retention while losing 20% of its logos, because a few large accounts expanded enough to cover the losses. Both numbers belong on the dashboard. Logo retention and dollar retention tell different stories, and the gap between them is a concentration risk signal.
Mistake 9: Asking for advocacy too early or too broadly. Requesting a review at signature produces low-quality reviews. Requesting one from every account produces fatigue and dilutes the reference pool. Fix: gate advocacy asks on a value milestone plus a satisfaction signal, and cap the ask frequency per account.
Decision framework: when to choose what
The funnel shape you build should match your business model. The flowchart below routes you to the right configuration based on two questions: how complex is the purchase, and how much of the value is realized after the sale.
When to run the full seven-stage model. Complex purchases with post-sale value realization — enterprise software, implementation-heavy services, anything with a data migration. You need dedicated owners at activation and adoption because those stages carry the renewal risk.
When to run a compressed model. Low-complexity, high-volume purchases where value is immediate — transactional e-commerce, single-seat tools. Measuring awareness and advocacy still matters, but activation and adoption collapse into a single post-purchase check, and success is a pooled function rather than a named owner per account.

When to make activation the primary gate. Product-led motions where the buyer can self-serve. Here the funnel narrows sharply at activation, and the highest-leverage investment is almost always reducing time-to-first-value. Success becomes a pooled, triggered function: reach out when an account stalls, not on a fixed schedule.
When to skip the middle entirely. Pure transactional businesses can run a three-stage model — awareness, purchase, advocacy — and still get most of the value, provided advocacy is genuinely instrumented. Adding stages you do not act on creates reporting overhead with no decision attached.
A practical test for any configuration: for every stage, name the person who owns it and the decision that stage's metric informs. If a stage has no owner or its metric drives no decision, cut it or merge it. A five-stage funnel that everyone acts on beats a nine-stage funnel that nobody reads.
Related questions
What is the difference between a lifecycle funnel and a sales pipeline?
A pipeline tracks a deal from first contact to signature and stops there. A Lifecycle Funnel continues past the sale through activation, adoption, renewal, and advocacy. Pipelines are quarterly forecasting instruments; lifecycle funnels are retention and compounding-growth instruments. Most companies need both, reporting against shared stage definitions at the overlap.
How many stages should a Customer Lifecycle Funnel have?
Five to nine. Fewer than five and you cannot isolate where value leaks; more than nine and nobody maintains the definitions. Start with seven, then merge any stage that has no owner or whose metric drives no decision. Segment-specific funnels can have different counts as long as stage names stay consistent across the organization.
Which stage usually has the worst conversion?

It varies by model, but activation is the most commonly under-instrumented and therefore the most commonly underestimated. Many teams spend heavily on acquisition, then lose 30–45% of new Customers before they reach first value. Fixing activation frequently produces more revenue than any acquisition improvement.
How often should the funnel be reviewed?
Weekly or biweekly for stage volumes and handoff health, monthly for conversion trends, quarterly for stage definitions themselves. Weekly reviews catch stalled handoffs early. Quarterly definition reviews prevent drift, which is the slowest and most damaging failure mode.
Can one company run multiple funnels?
Yes, and most should. Segment by purchase complexity or deal size rather than by product name. Keep stage names identical across segments so you can roll up to a company view, but set separate benchmarks. Averaging a self-serve and an enterprise funnel into one set of rates produces numbers that describe neither.
FAQ
What is a Customer Lifecycle Funnel? It is the end-to-end model of how a person moves from first awareness through purchase, activation, adoption, renewal, and advocacy. It differs from a marketing funnel or sales pipeline by continuing past the sale and by looping advocacy back into awareness. It exists so every revenue team measures the same stages against the same definitions.
Why does the funnel loop back instead of ending at renewal?

Because advocacy is an acquisition channel. Referrals, reviews, and case studies generate new awareness at a lower cost than paid acquisition. A funnel that terminates at renewal hides that channel, and companies that hide it typically see blended acquisition cost rise over time as paid channels saturate and get more expensive.
What is the single most important metric in the funnel? There is no universal answer, but the highest-value metric for most subscription businesses is activation rate within the first 30 days, because it correlates most strongly with renewal and is the stage teams most often fail to instrument. Track it alongside gross revenue retention so you can see whether activation improvements actually flow through to retention.
How do we define activation? Find the earliest event that statistically predicts renewal. Pull 12 months of history, compare the behavior of renewed and churned accounts in their first 30 days, and identify the event with the strongest separation. Common examples: first integration live, first report shared, first invoice processed, first campaign launched. Validate the correlation before committing.
How long does it take to build a working funnel? Two weeks to define stages and owners, four to eight weeks to map data and build reporting, and up to twelve weeks if you need to instrument product events from scratch. The definition work is fast and cheap; the instrumentation is the long pole. Expect the first useful operating review around month three.
What is the difference between logo retention and revenue retention? Logo retention counts how many Customers stayed. Revenue retention counts how many dollars stayed, including expansion and excluding churn. A company can retain 80% of logos and 105% of revenue if large accounts expand enough to offset losses. Both belong on the dashboard because the gap between them signals concentration risk.
Sources
- HubSpot — Customer Lifecycle Stages
- Salesforce — What Is a Sales Funnel?
- McKinsey — The Value of Getting Personalization Right
- Harvard Business Review — The Value of Keeping the Right Customers
- Gartner — Customer Retention and Growth
- Bain & Company — The Economics of Customer Loyalty
- Product Marketing Alliance — Customer Lifecycle Guide
- Forrester — Customer Experience Research
Related on PULSE
This page will be disappearing soon. Save it to your device for $1 — or read it free while it is here.
@Kory-White- · if Venmo asks, the last 4 of my number are 2012
This page is gone.
This one is off the shelf now. $1 keeps it on your phone for good — the whole page, pictures and diagrams included.
 graphicMarketing Funnel — TOFU MOFU BOFU
 graphicSales Funnel — 5 Stages
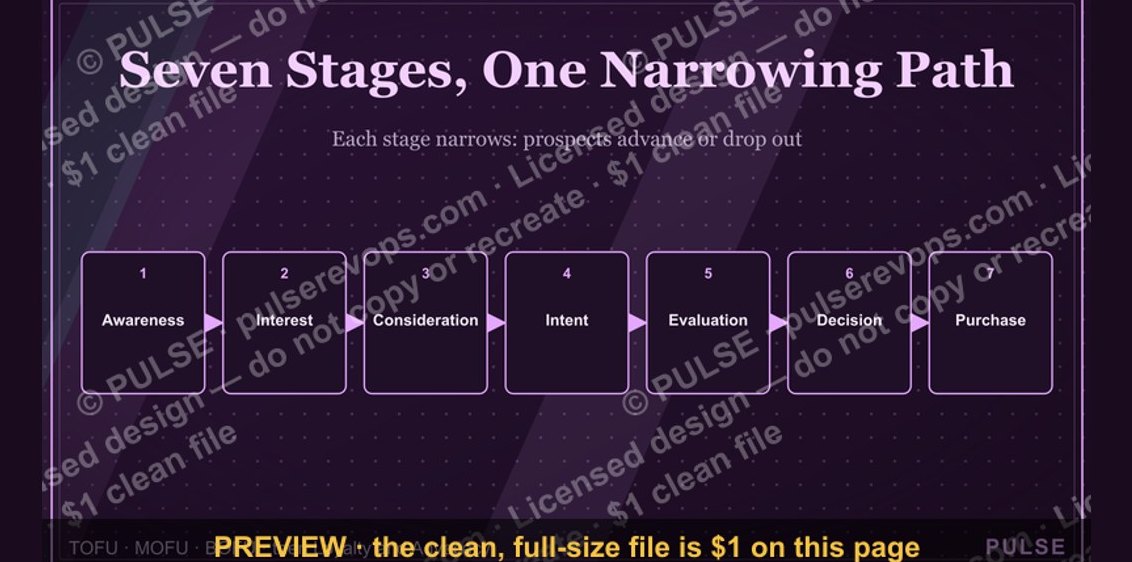 graphicSales Funnel — 7 Stages
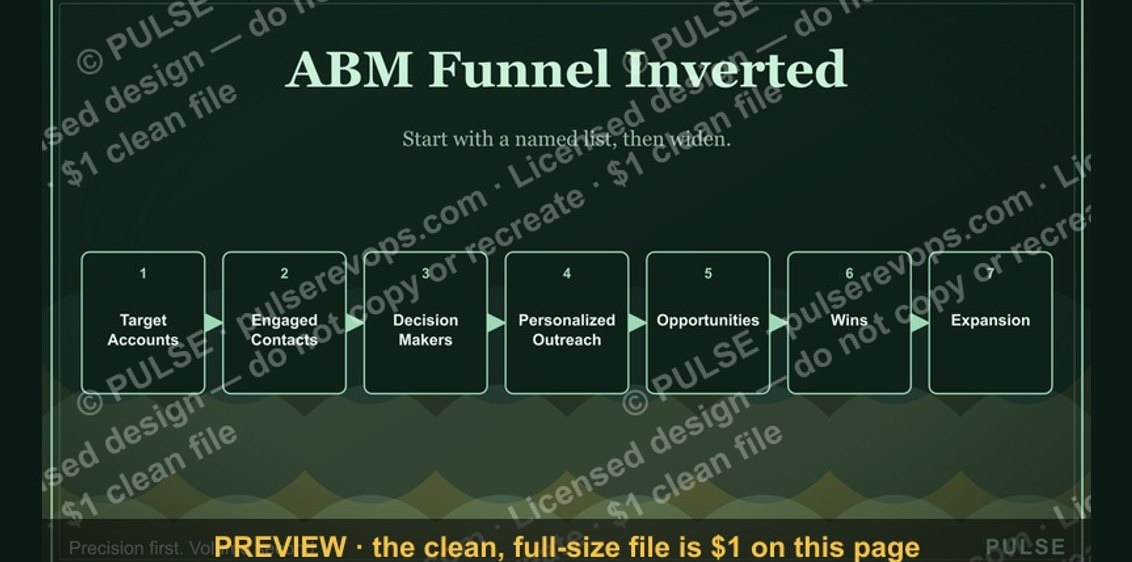 graphicABM Funnel Inverted
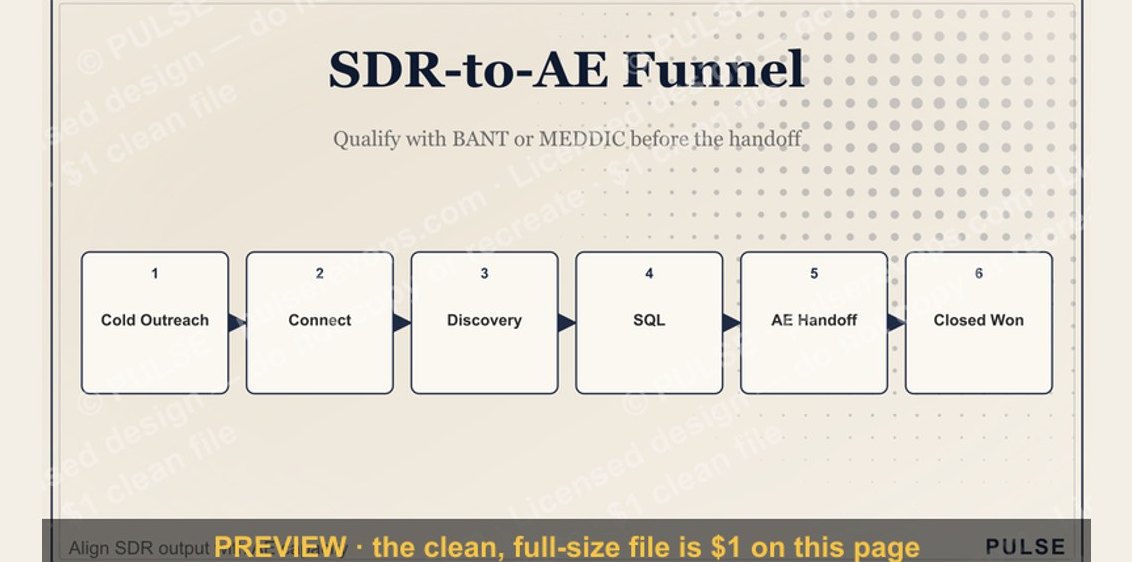 graphicSDR-to-AE Funnel
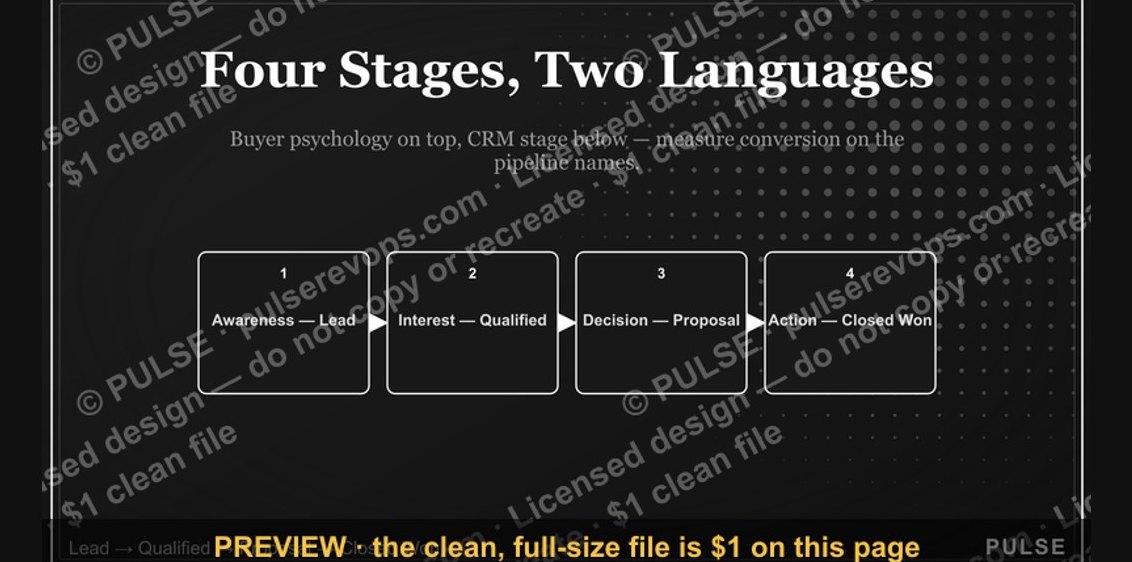 graphicSales Funnel — 4 Stages
 graphicPLG Conversion Funnel
 graphicLaunch / Growth Rocket Icon — Icon / Clip Art
 graphicThe Customer Journey — Infographic
 graphicSales Ops Analyst — LinkedIn Banner