


PLG Conversion Funnel
Quality
Certified

This is a process flowchart titled "PLG Conversion Funnel" that maps the self-serve journey from visitor to referral across seven stages: Visitor, Sign Up, Activation, First Value, Retention, Expansion, and Referral. Download it free as a PNG from this page and use it in onboarding decks, RevOps reviews, or growth planning sessions to align teams on where product-led Conversion actually happens.
Comparing self-serve and sales-assisted funnels
A PLG Conversion Funnel is not one funnel — it is a choice between two operating models that share the same top stages and diverge sharply after activation. The first option is a pure self-serve Funnel, where the product alone moves a user from sign-up to payment with no human touch. The second is a sales-assisted Funnel, where the product pre-qualifies accounts and a sales or success rep closes the deal. Most mature PLG companies run both simultaneously, routing accounts by signal rather than by segment label.
The pure self-serve model works when the product delivers value inside a single session, the buyer and the user are the same person, and the price point sits low enough that a credit card swipe needs no approval. Think collaboration tools, design software, developer utilities, and lightweight analytics. The entire Funnel is instrumented inside the product: sign-up forms, onboarding checklists, usage limits, in-app upgrade prompts, and a billing page that closes the loop. Sales headcount is minimal or zero, and the growth team owns the Conversion numbers end to end.
The sales-assisted model works when the product needs configuration, the buyer is a committee, or the contract value crosses the threshold where procurement gets involved. Here the product still drives acquisition and activation, but the Funnel hands off at a defined trigger — usually a usage or team-size signal — to a human who removes friction around security review, legal terms, and pricing negotiation. The product-qualified lead, or PQL, becomes the unit of handoff rather than the marketing-qualified lead.
The trade-offs are concrete. Self-serve scales without headcount but caps deal size and struggles with compliance-heavy buyers. Sales-assisted unlocks larger contracts but adds cost per acquisition and risks slowing the very velocity that made PLG attractive. The mistake most teams make is choosing one model globally instead of routing accounts dynamically. A 3-person startup and a 3,000-person enterprise can sign up for the same product on the same day, and the Funnel should treat them differently the moment their behavior diverges.
How to decide between them

The routing decision is the heart of a working PLG Conversion Funnel. You are not choosing a company-wide strategy — you are choosing, per account, whether the product closes the deal or a human does. The flowchart below shows the decision logic most teams converge on: score the account on usage depth, team expansion, and feature exploration, then route.
The logic is deliberately simple because complex scoring models rot. Three signals do most of the work: activation speed, team expansion, and exploration of admin-level features. An account that activates within 24 hours, adds five or more users, and pokes at security settings is screaming purchase intent. An account that activates but stays solo and never leaves the core feature is a perfect self-serve candidate — pushing sales at them wastes rep time and often annoys the user.
The decision also depends on your price point. Below roughly $500 per month, self-serve almost always wins on unit economics because the cost of a sales touch exceeds the first-year contract value. Above roughly $2,000 per month, sales-assisted wins because the deal size justifies human involvement and buyers expect a conversation. The messy middle — $500 to $2,000 — is where routing signals matter most, and where most teams get the balance wrong by applying a blanket rule.

One more input: buyer identity. If the person who signs up is also the person who holds the budget, self-serve can close. If the user is an individual contributor and the budget sits with a VP or procurement, the Funnel needs a handoff no matter how small the deal looks. This is why "team size 5+" appears in the flowchart — it is a proxy for the moment a budget holder enters the picture.
Concrete numbers behind each option
Benchmarks anchor the routing decision, but only if you read them as directional ranges rather than targets. Across B2B SaaS products, the median activation rate — the share of sign-ups who complete the aha-moment action in their first session — sits between 15% and 25%. Top-quartile products hit 30% to 40%. Anything below 10% almost always points to a specific friction: excessive data entry, an unclear value proposition, or a product that cannot deliver value within five minutes.
The activation-to-first-value stage leaks hardest. Only 8% to 15% of activated users typically reach a meaningful first value event — creating a project, inviting a teammate, generating a report — within seven days. Best-in-class products reach 20% to 25% here by embedding the value event directly into onboarding rather than gating it behind separate steps. This single stage is where most PLG Conversion improvement work pays off, because the drop is steep and the fix is usually product design, not spend.

Free-to-paid Conversion varies sharply by pricing model. Usage-based pricing — per seat or per action — converts a median of 3% to 6% of all sign-ups, with top performers at 8% to 12%. Time-limited freemium, such as a 14-day trial, converts higher at 10% to 18% but carries elevated post-conversion churn risk because the urgency was artificial. Sales-assisted Conversion adds another 2% to 5% on top of self-serve, but only when the product has already shown clear usage signals. Handing off cold accounts converts at a fraction of that.
Expansion revenue is the quiet engine of a healthy PLG Funnel. Well-run products generate 20% to 40% of new revenue from expansion — upgrades, add-ons, seat growth — within the first year. Products with strong network effects, especially collaboration tools, see expansion rates as high as 60%. Below 15% expansion usually means pricing lacks natural upgrade triggers or the product never surfaces unmet needs. Median time from signup to first payment runs 14 to 30 days for B2B PLG; beyond 60 days, either the product is not delivering ongoing value or the price threshold sits too high relative to perceived value.
For the sales-assisted path specifically, well-designed handoffs convert at 15% to 25% because the user already treats the product as essential. A healthy PLG-to-sales Funnel closes 20% to 30% of handoff-triggered accounts within 30 days, compared with 5% to 10% for cold outbound. Track the handoff efficiency ratio — the share of sales time spent on accounts that eventually convert. Below 50%, your trigger criteria are too loose and reps are chasing curiosity rather than intent.
Implementation details and sequencing
Building the Funnel is a sequencing problem, not a tooling problem. Teams that instrument everything at once drown in dashboards and change nothing. The order below is the one that consistently produces measurable Conversion gains fastest, because each step removes the single biggest leak before moving on.
Step one is defining the aha moment in a single sentence your whole team agrees on. Not "users who engage" but "users who create a project and invite one teammate within 48 hours." Vague definitions make every downstream metric meaningless. Step two is instrumenting the events that track that definition — sign-up, first action, core action, second value, payment — in a tool like Mixpanel or Amplitude. Without event tracking, funnel audits are guesswork.
Step three fixes the empty state. The single largest drop-off happens immediately after sign-up, when users land on a blank dashboard with no idea what to do. Replace it with a guided template, a sample project, or one clear "do this first" call to action. Products that drop users into a pre-populated environment see 40% to 60% higher activation than those that dump them on a generic homepage.
Step four reduces onboarding tax. After the first action, many products bury users in feature tours, tooltips, and modal popups. This overload causes 20% to 35% of users to abandon within ten minutes. Use progressive disclosure: show features only when behavior signals need, track which features correlate with retention, and hide everything else until the core action is complete.
Step five adds a return trigger. Users who complete the core action once often never come back, because nothing pulls them in within 24 to 48 hours. Build a notification, a weekly activity digest, or a collaborative feature that requires another person to respond. Products with a return trigger see two to three times higher Day 7 retention. Step six removes pricing friction: simplify the pricing page, drop the credit card gate for the first 14 days, and use in-app messaging to show exactly what the user is missing — "you've used 80% of your free limit."
Step seven sets the PQL threshold using the routing signals from the flowchart above. Step eight builds the handoff itself — progressive in-app prompts, a personalized email referencing specific usage, or a calendar link on the billing page. Never gate features behind "talk to sales." Step nine is the discipline that makes the rest work: run a funnel audit monthly, calculate Conversion between each stage, and fix whichever stage drops below 20% first. Most teams find that repairing the single biggest leak improves overall Funnel Conversion by 30% to 50% without any other change.
Related questions
What is the difference between a PLG funnel and a traditional sales funnel?
A PLG Funnel lets the product drive acquisition, activation, and Conversion with minimal human touch. A traditional sales Funnel relies on marketing and reps to push leads through stages. PLG pre-qualifies through usage; traditional models qualify through discovery calls and manual scoring.
Which stage of a PLG funnel leaks the most?
Activation to first value leaks hardest. Only 8% to 15% of activated users reach a meaningful value event within seven days. The fix is embedding the value event inside onboarding rather than gating it behind separate steps, which lifts that stage to 20% to 25% for top performers.
Can a PLG funnel work for enterprise deals?
Yes. Many enterprise products run PLG for initial adoption, then layer sales on top once usage signals appear. Handoff-triggered accounts convert at 15% to 25%, and the product pre-qualifies leads so reps spend time on accounts that already love the product.
What is a product-qualified lead?

A product-qualified lead is an account whose in-product behavior signals purchase intent — typically daily active use for 14+ days, five or more users, or exploration of admin and security settings. PQLs replace marketing-qualified leads as the handoff unit in a PLG Funnel.
How long should signup-to-payment take?
Median time from signup to first payment is 14 to 30 days for B2B PLG products. Beyond 60 days, either the product is not delivering ongoing value or the price threshold is too high relative to perceived value. Shorten it by tightening activation, not by discounting.
FAQ
What is a PLG conversion funnel? A PLG Conversion Funnel maps the self-serve journey from visitor to paid customer and beyond, through stages like sign-up, activation, first value, retention, expansion, and referral. The product itself drives movement between stages rather than sales outreach, and Conversion is measured at every boundary.
What are the key stages in a PLG conversion funnel? The seven stages shown in this process flowchart are Visitor, Sign Up, Activation, First Value, Retention, Expansion, and Referral. Activation and First Value are the most critical, because that is where users experience core value and where most Funnels leak the most volume.

How do you measure conversion rates in a PLG funnel? Instrument events at each stage and calculate the ratio between consecutive stages. Typical free-to-paid Conversion ranges from 2% to 10% depending on pricing model, with usage-based pricing at 3% to 6% and time-limited trials at 10% to 18%.
What factors most influence PLG conversion success? Onboarding quality, time-to-value, frictionless sign-up, and well-timed in-app upgrade prompts. The empty state after sign-up and feature overload during onboarding are the two most common killers, and both are product design problems rather than marketing problems.
How is a PLG funnel different from a traditional sales funnel? In a PLG Funnel the product drives acquisition, retention, and Conversion, often without direct sales intervention. Traditional Funnels rely more on marketing and sales teams to push leads through stages, which raises cost per acquisition and slows velocity.
Can a PLG funnel work for enterprise products? Yes. Enterprise products commonly use PLG for initial adoption, then layer sales for larger deals. This hybrid approach sees Conversion rates from self-serve to sales-assisted ranging from 5% to 20% depending on product complexity and deal size.
Sources
- OpenView Partners — product-led growth benchmarks and PQL frameworks: https://openviewpartners.com
- Product-Led Growth Collective — community case studies on PLG metrics: https://productled.com
- ChartMogul — subscription analytics and funnel metric definitions: https://chartmogul.com
- Intercom Blog — user onboarding and conversion guides: https://intercom.com/blog
- HubSpot Blog — SaaS conversion funnel and PLG strategy articles: https://blog.hubspot.com
- Harvard Business Review — growth model and funnel optimization perspectives: https://hbr.org
- Amplitude — product analytics documentation on funnel and retention analysis: https://amplitude.com
- Mixpanel — event tracking and funnel audit documentation: https://mixpanel.com
Related on PULSE
This page will be disappearing soon. Save it to your device for $1 — or read it free while it is here.
@Kory-White- · if Venmo asks, the last 4 of my number are 2012
This page is gone.
This one is off the shelf now. $1 keeps it on your phone for good — the whole page, pictures and diagrams included.
 graphicSales Funnel — 7 Stages
 graphicSales Funnel — 5 Stages
 graphicSDR-to-AE Funnel
 graphicMarketing Funnel — TOFU MOFU BOFU
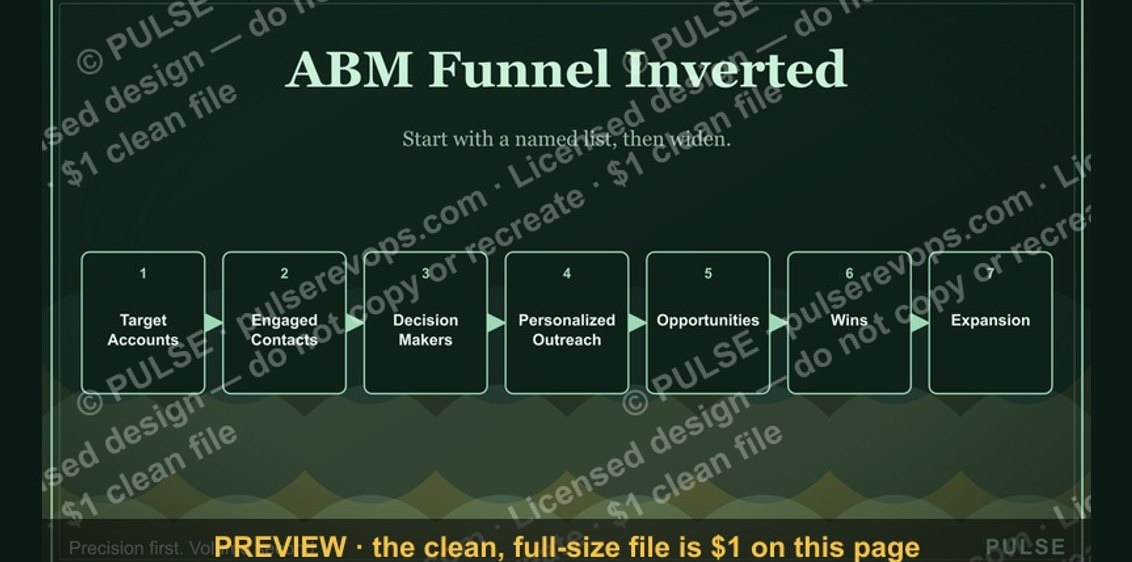 graphicABM Funnel Inverted
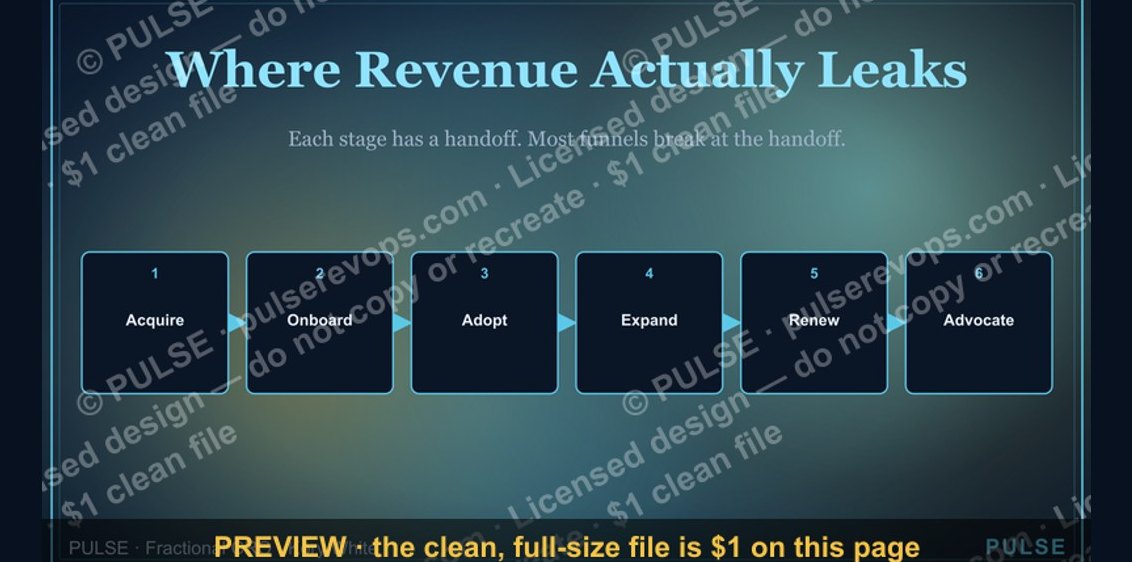 graphicCustomer Lifecycle Funnel
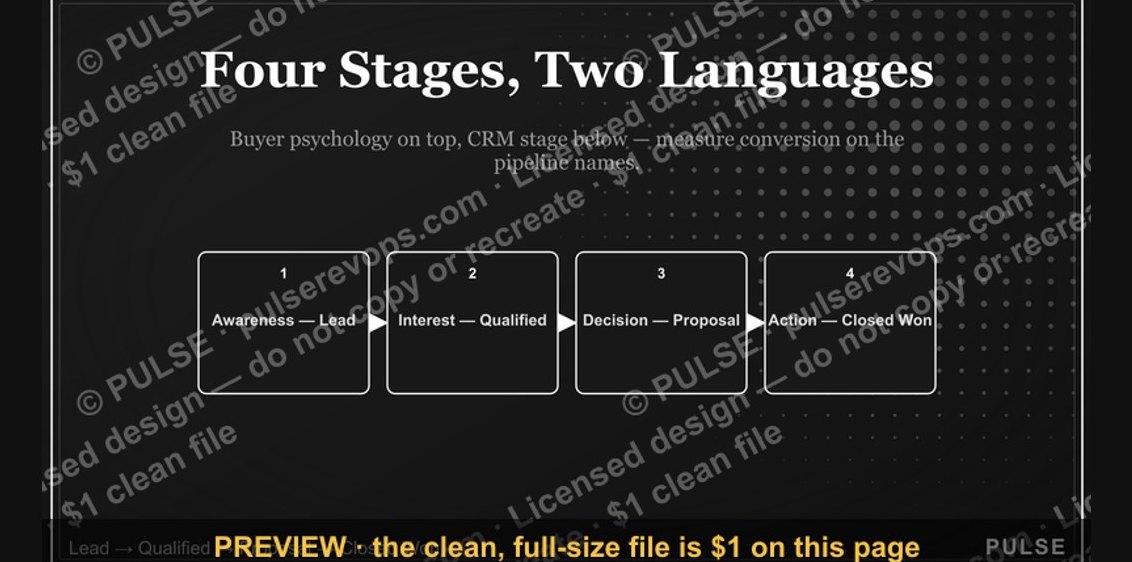 graphicSales Funnel — 4 Stages
 graphic“Slow is smooth. Smooth is fast.” — Quote Card
 graphicSales Enablement — LinkedIn Banner
 graphic“Qualify hard. Close easy.” — Quote Card