


Pipeline Coverage Gauge


A Pipeline Coverage Gauge measures one number: open qualified pipeline ÷ quota (or revenue target) for the same period. If you need $1M this quarter and you have $3M in active, qualified opportunities, your coverage is 3x.
Most B2B teams treat 3x to 5x as healthy at the *start* of a period, but the "right" number is derived, not borrowed. The math is simple: a team that closes 25% of its qualified pipeline needs roughly 4x coverage (1 ÷ 0.25) just to break even on target; a team closing 33% needs about 3x. Multiply by a safety buffer for slippage and stalled deals and you get your floor. Longer sales cycles and lower win rates push the number up; fast, transactional motions with high win rates can run as low as 2x.
The gauge is a *leading indicator*, not a guarantee. Use weighted pipeline (each deal × its stage win-rate) for the honest reading, and read it against your own history rather than a generic benchmark.
Pipeline Coverage Gauge

Speedometer-style pipeline coverage gauge showing 3x / 4x / 5x coverage ratios with safe-zone highlight.
Format: SVG (scalable vector) · Size: 1584×396 px · Category: Chart · License: Free to use — no attribution required.
The first diagram shows how the gauge is calculated and what each zone tells you to do. The second shows the *weighted* version — the reading you should actually trust.
Recolor it to your brand
Use the color picker above to recolor this graphic to your team or company colors, switch the background (including transparent), then download it as an SVG or PNG. No sign-up, no watermark.
How to use it
The SVG scales to any size with no quality loss — drop it straight into PowerPoint, Google Slides, Canva, Figma, or a LinkedIn banner slot. The PNG export is ready to upload anywhere that wants a raster image.

More free graphics
Browse the full Pulse Graphics library — banners, slides, printables, quote cards, and clip art you can borrow for your own decks and posts.
Related on PULSE
- Revenue Gauge (KPI) — Icon / Clip Art
- KPI Gauge Icon — Icon / Clip Art
- Pipeline Health Dashboard
- Pipeline Aging Heatmap
- Forecast First, Pipeline Second — Banner
- Pipeline Council — Team Banner
Why the Coverage Ratio Beats Raw Pipeline Dollars
Most sales leaders fixate on the absolute dollars in their pipeline, but the Pipeline Coverage Gauge surfaces a more useful signal: pipeline value *relative to target*. A ratio that consistently sits at 2x or below means you're operating with almost no margin for error — one lost deal or one slipped close can sink the quarter. A ratio that runs above 5x isn't automatically good news either; it often means qualification is too loose and reps are carrying deals that will never close.
The gauge separates "pipeline wealth" from "pipeline health." A team with a $1M target and $3M in pipeline looks comfortable at 3x — but if $2.5M of that sits in early discovery with no champion and no technical validation, the *effective* coverage is far thinner. That's why the weighted reading matters: multiply each deal by its stage win-rate and sum the result. A 3x unweighted gauge can collapse to 1.8x weighted, and that gap is the difference between a forecast and a wish.
The ratio also doubles as an early-warning system for capacity. If coverage drops below your floor for two consecutive months, top-of-funnel is underperforming or SDR output is short. If it spikes well above your ceiling, reps may be hoarding low-probability deals instead of working the winnable ones. Read low → invest in pipeline generation; read high → shift toward closing and enablement.
Setting Your Thresholds From Win Rate and Cycle Length
The generic 3x is a starting point; your real target is a function of win rate and sales-cycle length. A 90-day SaaS cycle can usually live at 3x because there's time to move deals. A 180-day enterprise cycle wants 4x–5x, because the longer the cycle, the more deals stall or slip. A 14-day transactional motion can run near 2x because pipeline replenishes quickly.
Build the threshold from your own stage win rates, then split the gauge into three zones: green (at or above your derived floor on weighted coverage), yellow (one band below), red (below your minimum). Green → accelerate and pursue expansion. Yellow → raise prospecting and re-check qualification. Red → pause non-essential work and route capacity into pipeline generation: outbound, partner referrals, and re-engaging stalled opportunities.
Account for seasonality. Many B2B teams see coverage dip in Q4 on budget freezes and recover in Q1. A static threshold makes you panic every December. Use a rolling 90-day average and compare to the same window last year. Segmenting by source helps too — if inbound coverage falls it's usually a marketing problem; if outbound falls it's a sales-development problem — so you apply the right fix instead of a blanket one.
Common Pitfalls When Reading the Gauge
Treating it as static. A 3x reading on day one of the quarter is not the same as 3x on the last day, when many of those deals can no longer close in time. Weight deals by close date so in-quarter opportunities count more than next-quarter ones.
Ignoring aging. If 60% of a 4x pipeline has sat in the same stage for 60+ days, those deals are likely dead and they're inflating the gauge. Set a stale-deal threshold (e.g., 30 days without movement mid-stage), then exclude or discount those deals so the reading stays honest.
Using it to set quotas instead of to coach. A red gauge tempts leaders to demand more activity, but the cause is often qualification, not effort. A rep with 50 early-stage deals at a 10% close rate has worse real coverage than a rep with 20 qualified deals at 40%. Drill into stage mix and win rate per rep: the gauge should start a conversation, not issue a command.
Comparing to benchmarks without context. 3x may be right for a steady SaaS motion, 5x for a startup whose target doubles each quarter, and 1.5x for a services business renewing 95% of its book. Set your own baseline over three to six months and adjust from actual outcomes.
Common Pitfalls When Using a Pipeline Coverage Gauge
A coverage gauge is only as reliable as the data feeding it. Three frequent mistakes distort the reading:
- Including unqualified or early-stage pipeline. A $500k deal that hasn't passed discovery or budget validation inflates coverage artificially. Many teams report 5x or 6x coverage, only to see it collapse to 2x once they apply stage-gate criteria. Always filter for deals that have reached at least a "qualified lead" or "demo completed" stage before counting them.
- Using unweighted totals. A $100k deal at 10% close probability contributes the same as a $100k deal at 70% in an unweighted gauge. Weighted coverage (sum of deal values × stage win-rate) typically runs 40–60% lower than raw coverage. If your raw gauge shows 4x but weighted shows 1.8x, you're likely under-covered.
- Ignoring time decay. Coverage measured at the start of a quarter erodes as deals slip or get lost. A 3x gauge in week one can become 1.5x by week six. Leading teams re-measure coverage weekly or bi-weekly, not monthly, and set triggers: if coverage drops below 2x, they initiate pipeline generation immediately rather than waiting for month-end.
How to Set Your Own Coverage Target (Not a Benchmark)
Generic benchmarks (3x–5x) are starting points, not destinations. Derive your own target using three inputs:
- Historical win rate on qualified pipeline. If your team closes 20% of qualified opportunities, your base multiplier is 5x (1 ÷ 0.20). If you close 40%, it's 2.5x.
- Average sales cycle length. Longer cycles (90+ days) need a buffer for deals that stall or extend. Add 0.5x to 1x to the base multiplier for cycles over 60 days.
- Quarterly quota attainment variability. If your team hits quota 70% of quarters or less, add another 0.5x buffer. Teams with consistent attainment above 85% can subtract 0.5x.
Example: A team with a 25% win rate (4x base), a 75-day cycle (add 0.75x), and 65% attainment consistency (add 0.5x) arrives at 5.25x as their healthy start-of-quarter target. This number is specific to their reality, not borrowed from a blog post.
The Gauge as a Diagnostic, Not a Dashboard Ornament
Beyond a simple number, the pipeline coverage gauge reveals systemic issues when tracked over time:
- If coverage is high (6x+) but attainment is low: The problem isn't pipeline volume—it's deal quality, conversion, or sales execution. Reps may be loading the pipeline with unqualified or low-probability deals. Focus on stage-gate enforcement and coaching, not more leads.
- If coverage is low (under 2x) but attainment is fine: You're running lean, which works until one or two deals slip. This signals a lack of pipeline depth and high dependency on a few large opportunities. The risk is sudden underperformance if those key deals fall through.
- If coverage drops sharply mid-quarter: This often indicates deals are being removed (lost or disqualified) faster than new ones are added. It's a leading indicator of a coming shortfall, giving you 3–6 weeks to launch targeted generation efforts before the quarter ends.
Use the gauge as a weekly pulse check, not a quarterly retrospective. When it changes direction, investigate the *why* before adjusting your target.
Sources
- HubSpot — Sales Pipeline Management resources and Sales Blog — practical guidance on pipeline coverage, stage definitions, and pipeline-to-quota ratios for B2B teams. (hubspot.com)
- Salesforce — "What Is a Sales Pipeline?" and sales-management guides — definitions and best practices for pipeline stages, weighted pipeline, and forecasting. (salesforce.com)
- Gartner for Sales — research on sales forecasting and pipeline analytics — analyst guidance on pipeline coverage, forecast accuracy, and revenue operations. (gartner.com)
- Forrester — B2B revenue and sales operations research — frameworks connecting pipeline coverage to forecast reliability and revenue-process design. (forrester.com)
- Clari — Revenue operations and pipeline/forecasting content — practitioner material on coverage ratios, pipeline inspection, and weighted forecasting. (clari.com)
- Harvard Business Review — sales pipeline and forecasting articles — research-backed perspectives on pipeline discipline and why coverage quality outperforms raw volume. (hbr.org)
FAQ
What exactly does the Pipeline Coverage Gauge measure? It measures open qualified pipeline divided by your quota or revenue target for the same period, expressed as a ratio. A 3x reading means you have three times your target in active pipeline. It tells you whether you have *enough* opportunity to plausibly hit the number.
What is a healthy pipeline coverage ratio? There's no universal figure — derive it from your win rate. A team closing 25% of qualified pipeline needs roughly 4x to break even, plus a buffer for slippage. Most B2B teams land between 3x and 5x at the start of a quarter, but longer cycles and lower win rates push it higher.
How is weighted coverage different from raw coverage? Raw coverage counts every open deal at full value. Weighted coverage multiplies each deal by its stage win-rate before dividing by target, so early-stage deals count less than late-stage ones. A 3x raw gauge can read 1.8x weighted — and the weighted number is the one to forecast against.
How often should I check pipeline coverage? Weekly is standard, with daily checks during end-of-quarter pushes. Pair the snapshot with a rolling 90-day average so normal week-to-week noise and seasonal dips don't trigger false alarms.
Does hitting my coverage ratio guarantee I'll make my number? No — it's a leading indicator, not a promise. Even at 4x, weak win rates, stalled deals, or pipeline that can't close in-period will cause a miss. Read it alongside conversion rates, deal aging, and velocity.
My coverage is in the red — what do I fix first? Check whether it's a *volume* or *quality* problem before adding activity. If qualification is sound, drive top-of-funnel: outbound, partner referrals, and reactivating stalled deals. If stage win rates are low, tighten qualification and coach closing — adding more weak deals only inflates the gauge without moving the forecast.
This page will be disappearing soon. Save it to your device for $1 — or read it free while it is here.
@Kory-White- · if Venmo asks, the last 4 of my number are 2012
This page is gone.
This one is off the shelf now. $1 keeps it on your phone for good — the whole page, pictures and diagrams included.
 graphicSales Velocity Components
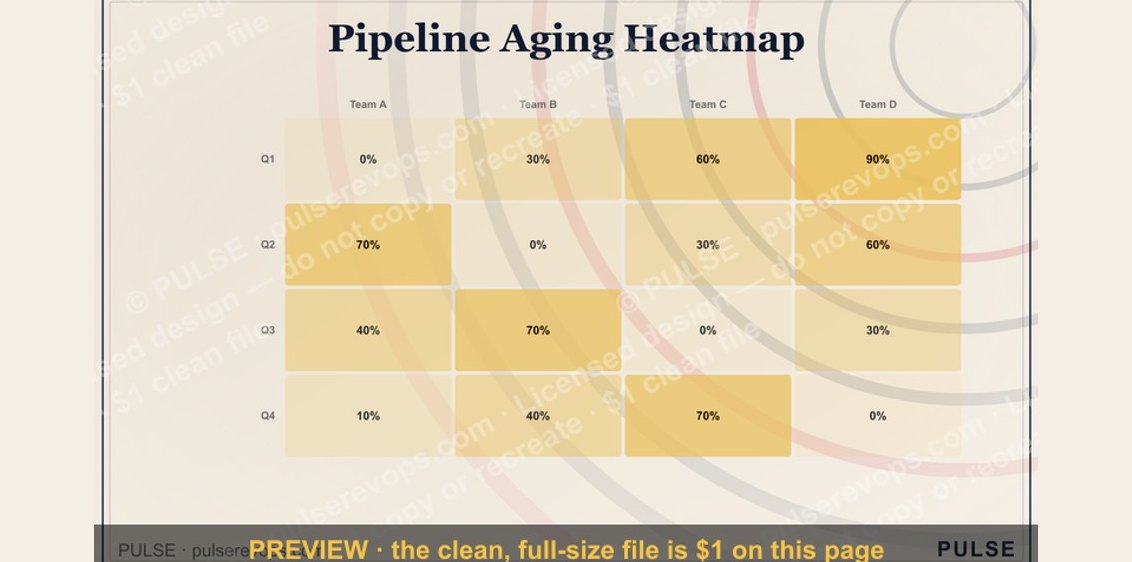 graphicPipeline Aging Heatmap
 graphicRevenue by Channel Pie
 graphicWin Rate by Segment Bar Chart
 graphicWin Rate by Stage Bar Chart
 graphicChurn by Segment Bar Chart
 graphicForecast Commit / Best Case / Upside
 graphicMRR Growth Trend Line
 graphicDeal Stage Progression Bar
 graphicCAC Payback Visualization