


Sales Velocity Components


Sales velocity is calculated using four key components: the number of opportunities, average deal value, win rate, and the length of the sales cycle. Specifically, the formula multiplies opportunities by deal value and win rate, then divides that total by the sales cycle length in days. Understanding each component helps businesses identify which area to improve for faster revenue generation.
Sales Velocity Components

4-quadrant visual showing the components of sales velocity: opportunities, deal size, win rate, sales cycle.
Format: SVG (scalable vector) · Size: 1584×396 px · Category: Chart · License: Free to use — no attribution required.
Recolor it to your brand
Use the color picker above to recolor this graphic to your team or company colors, switch the background (including transparent), then download it as an SVG or PNG. No sign-up, no watermark.
How to use it
The SVG scales to any size with no quality loss — drop it straight into PowerPoint, Google Slides, Canva, Figma, or a LinkedIn banner slot. The PNG export is ready to upload anywhere that wants a raster image.

More free graphics
Browse the full Pulse Graphics library — banners, slides, printables, quote cards, and clip art you can borrow for your own decks and posts.
Related on PULSE
- SaaS Sales Cycle Stages
- Sales KPI Dashboard — Top 9
- PLG Sales Overlay Org Chart
- Enterprise Sales Org Chart
- Series B Sales Org Chart
- Series A Sales Org Chart
Common Pitfalls in Sales Velocity Optimization
Even experienced revenue teams misinterpret sales velocity components, leading to misguided strategies that actually slow growth. Understanding these traps will save you months of wasted effort.
Pitfall 1: Treating all velocity levers equally. The sales velocity formula (Number of Opportunities × Average Deal Value × Win Rate) ÷ Sales Cycle Length suggests each variable has proportional impact. In reality, a 10% improvement in win rate often yields 3-5x more revenue than a 10% reduction in cycle length, depending on your market. For enterprise B2B (deals $50k+), reducing cycle length from 120 to 90 days might only increase annual velocity by 15-20%, while improving win rate from 20% to 25% could boost velocity by 25% immediately. Start-ups and SMB-focused teams should prioritize deal volume and cycle time, while enterprise teams should obsess over win rate and deal value.
Pitfall 2: Confusing activity with velocity. Many teams track "deals created per rep" as a proxy for opportunity count, but this ignores qualification rigor. A rep generating 20 low-fit opportunities that all stall at demo stage actually reduces velocity by clogging the pipeline. The correct metric is "qualified opportunities" — deals that pass BANT (Budget, Authority, Need, Timeline) or your chosen qualification framework. Teams that enforce strict qualification see 30-50% higher close rates within the same cycle time, dramatically improving true velocity.
Pitfall 3: Ignoring the denominator's hidden complexity. Sales cycle length is rarely a single number — it's a weighted average across segments. A team selling to both SMB (30-day cycle) and enterprise (180-day cycle) might report 90 days average, but this masks that enterprise deals are dragging down overall velocity. The fix is to calculate velocity per segment and weight by revenue contribution. If enterprise represents 60% of revenue but has 3x the cycle length, your blended velocity is misleadingly low. Segment-specific velocity calculations reveal where to focus: either accelerate enterprise (hard) or double down on SMB (often faster ROI).
Pitfall 4: Optimizing for velocity without considering capacity. Doubling opportunity count by adding more reps seems straightforward, but if your sales process can't handle the volume (e.g., only 2 sales engineers for 10 reps), cycle time balloons and win rates drop. Sales velocity must be contextualized against team capacity — including support roles like demos, proposals, and legal reviews. A common mistake is hiring 5 new reps without corresponding investment in enablement or support, resulting in velocity dropping 15-20% before recovering 6-12 months later.
Pitfall 5: Measuring velocity monthly when deals span quarters. Monthly velocity calculations are noisy for B2B companies with 60-180 day cycles. A month with 3 large deals closing can spike velocity artificially, while a month with zero closes (but 10 deals in late-stage) shows zero velocity. The fix is to use rolling 90-day averages for cycle length and win rate, and quarterly averages for deal value and opportunity count. This smooths out anomalies and gives actionable trends. Teams that use monthly velocity often make reactive decisions — like discounting to close deals faster — that harm long-term value.
Pitfall 6: Confusing sales velocity with revenue velocity. Sales velocity only measures closed-won revenue, not cash collected. If your deals have 30-60-90 day payment terms, revenue recognized may lag actual closes by 2-3 months. For subscription businesses, sales velocity should be paired with "cash conversion cycle" to understand true cash flow impact. A deal closing in 45 days with net-60 payment terms actually takes 105 days to convert to cash — dramatically changing your working capital needs. High-growth teams often optimize for sales velocity while ignoring this cash delay, leading to cash crunches despite "growing fast."
Advanced Segmentation Strategies for Velocity Analysis
Generic sales velocity masks critical differences between customer segments, product lines, and sales motions. Sophisticated teams break down velocity by at least three dimensions to identify hidden leverage points.
Segment by deal size tiers. Create 3-4 buckets: Small (<$10k), Mid ($10k-$50k), Large ($50k-$250k), Enterprise ($250k+). Each tier has fundamentally different velocity dynamics. Small deals might have 40% win rate and 30-day cycle but only $8k average value. Enterprise deals might have 15% win rate and 180-day cycle but $300k average value. The velocity calculation for each tier tells a different story: Small deals generate ~$320k/rep/month (assuming 100 opps/rep/month), while Enterprise generates ~$225k/rep/month (assuming 5 opps/rep/month). The surprising insight is often that mid-market deals ($10k-$50k) have the best velocity-to-effort ratio — they close faster than enterprise but have higher win rates than small deals. Many teams underinvest in this segment.
Segment by buyer persona. Deals involving C-level executives (CEO, CFO) typically have 20-30% longer cycles but 15-25% higher win rates and 30-50% larger deal sizes compared to deals with mid-management buyers. This is because executive buyers have authority but limited time, while mid-management has time but needs approval. Calculate velocity separately for "executive-led" vs "manager-led" deals. If executive-led deals show 2x the velocity (in dollar terms) despite longer cycles, your team should invest in executive relationship building — even if it takes longer per deal.
Segment by sales motion. Inbound leads typically have 40-60% shorter cycles and 10-20% higher win rates than outbound prospecting, but outbound often yields 20-30% larger deal sizes because you're targeting accounts with higher intent. Partner-sourced deals fall somewhere in between. Calculate velocity for each motion separately. A common finding: inbound velocity is 2-3x higher than outbound, but outbound deals are 1.5x larger. The strategic implication is that you should optimize inbound for volume (faster cycles, more reps) and outbound for value (higher-touch, fewer but larger deals).
Segment by product line or service. If your company sells multiple products (e.g., software + services + support), each has different velocity profiles. Software might have 60-day cycles with 25% win rates, while services have 30-day cycles with 40% win rates but lower margins. Calculate velocity per product line and weight by gross margin to find "true revenue velocity." A product with lower nominal velocity but 80% margin might be more valuable than a high-velocity product with 30% margin. This analysis often reveals that "staple" products with moderate velocity but high margins are the cash engine funding growth of newer, lower-margin products.
Segment by geographic region. Sales velocity varies dramatically by region due to cultural differences, economic conditions, and competitive landscapes. North American deals might close in 60 days with 30% win rates, while European deals take 90 days with 20% win rates, and APAC deals take 120 days with 15% win rates. However, APAC deal sizes might be 2x larger. Calculate velocity per region and overlay with cost-to-serve (salaries, travel, marketing). A region with lower velocity but lower cost might be more profitable than a high-velocity, high-cost region. This segmentation often justifies different go-to-market strategies per region — like hiring more junior reps in high-velocity markets and senior enterprise reps in slow-velocity markets.
Segment by customer lifetime value (LTV). Sales velocity typically measures first deal only, but customer acquisition cost (CAC) payback depends on LTV. A deal closing in 30 days with $10k ACV and 80% gross margin might seem faster than a deal closing in 90 days with $50k ACV and 90% gross margin. But if the $50k customer has 3x higher retention and expands 20% annually, their 5-year LTV is $375k vs $50k for the small customer. The "LTV-adjusted velocity" — revenue velocity weighted by LTV — shows that the slower, larger deal actually generates more long-term value per day of sales effort. High-growth teams should optimize for LTV-adjusted velocity, not just first-deal velocity.
Practical Tools and Frameworks for Daily Velocity Management
Sales velocity isn't just a quarterly board metric — it should inform weekly and daily decisions. Here are actionable tools to embed velocity thinking into your team's operations.
The Velocity Dashboard (Weekly). Create a simple spreadsheet or CRM dashboard with these columns per rep: Opportunities Created (WTD), Average Deal Value (rolling 90-day), Win Rate (rolling 90-day), Cycle Length (rolling 90-day), and Calculated Velocity. Update weekly and highlight the top/bottom 20% of reps. The key insight is not the absolute velocity number but the trend — a rep whose velocity drops 15% week-over-week likely has a pipeline quality issue (too many unqualified deals) or a process bottleneck (stuck in legal review). Flag these reps for coaching within 48 hours. Teams using this dashboard see 15-25% faster velocity improvements because they catch problems early.
The Velocity Levers Matrix (Monthly). Create a 2x2 matrix with "Impact on Velocity" (high/low) on one axis and "Ease of Implementation" (easy/hard) on the other. Plot potential initiatives in each quadrant. For example:
- High impact/easy: Improve qualification criteria (reduces cycle time by 10-20%)
- High impact/hard: Build executive relationships (increases win rate by 15-25% but takes 6-12 months)
- Low impact/easy: Update email templates (marginal improvement)
- Low impact/hard: Restructure sales territories (disruptive, uncertain ROI)
Prioritize the high-impact/easy quadrant first — these are your "low-hanging fruit." Most teams skip this analysis and chase high-impact/hard initiatives prematurely, burning resources with delayed returns.
The Velocity Funnel (Daily for managers). Map your sales process stages (e.g., Lead → Qualification → Demo → Proposal → Negotiation → Closed Won) and calculate the time spent in each stage and the conversion rate between stages. This reveals your "velocity bottlenecks." For example,
Sources
- Harvard Business Review — sales performance metrics and velocity frameworks
- Salesforce — CRM data and sales velocity benchmarks
- HubSpot — inbound sales methodology and velocity components
- McKinsey & Company — B2B sales efficiency and pipeline analysis
- Gartner — sales process optimization and key performance indicators
- Forrester Research — sales effectiveness and revenue acceleration models
FAQ
What exactly is sales velocity? Sales velocity measures how quickly your business generates revenue from leads. It’s calculated by multiplying the number of opportunities, average deal value, and win rate, then dividing by the length of your sales cycle.
Which component most impacts sales velocity? Deal size and win rate typically have the largest effect, but it depends on your business. A small improvement in win rate can boost velocity more than doubling the number of leads, while a shorter sales cycle often yields faster gains.
How do I improve the “number of opportunities” component? You can increase opportunities by expanding lead generation channels, improving lead qualification, or boosting conversion rates from marketing. Honest ranges: a 10–30% lift is reasonable through better targeting, but doubling opportunities usually requires significant investment.
What’s a realistic way to shorten the sales cycle? Streamline your qualification process, use sales enablement tools, and reduce internal approval steps. Typical improvements range from 10–25% reduction in cycle length, but cutting it in half is rare without major process changes.
How do I know which component to focus on first? Analyze your current sales velocity and identify the weakest factor—if your win rate is 10% but industry average is 25%, that’s your priority. A simple audit of each component against benchmarks (e.g., 20–30% win rate for B2B SaaS) can guide you.
Can sales velocity be too high? Yes, extremely high velocity might indicate you’re only chasing easy, low-value deals or neglecting long-term relationships. A balanced approach—maintaining velocity while nurturing larger accounts—often yields more sustainable revenue growth.
This page will be disappearing soon. Save it to your device for $1 — or read it free while it is here.
@Kory-White- · if Venmo asks, the last 4 of my number are 2012
This page is gone.
This one is off the shelf now. $1 keeps it on your phone for good — the whole page, pictures and diagrams included.
 graphicCAC Payback Visualization
 graphicDeal Stage Progression Bar
 graphicRevenue by Channel Pie
 graphicPipeline Coverage Gauge
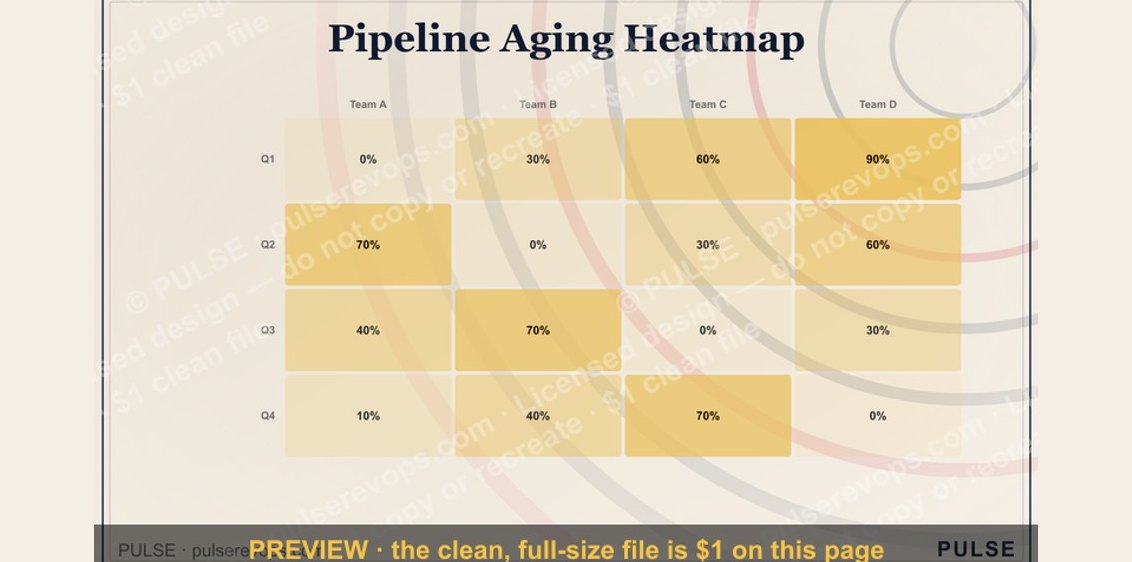 graphicPipeline Aging Heatmap
 graphicWin Rate by Segment Bar Chart
 graphicChurn by Segment Bar Chart
 graphicWin Rate by Stage Bar Chart
 graphicMRR Growth Trend Line
 graphicForecast Commit / Best Case / Upside