


Series B Sales Org Chart
Quality
Certified
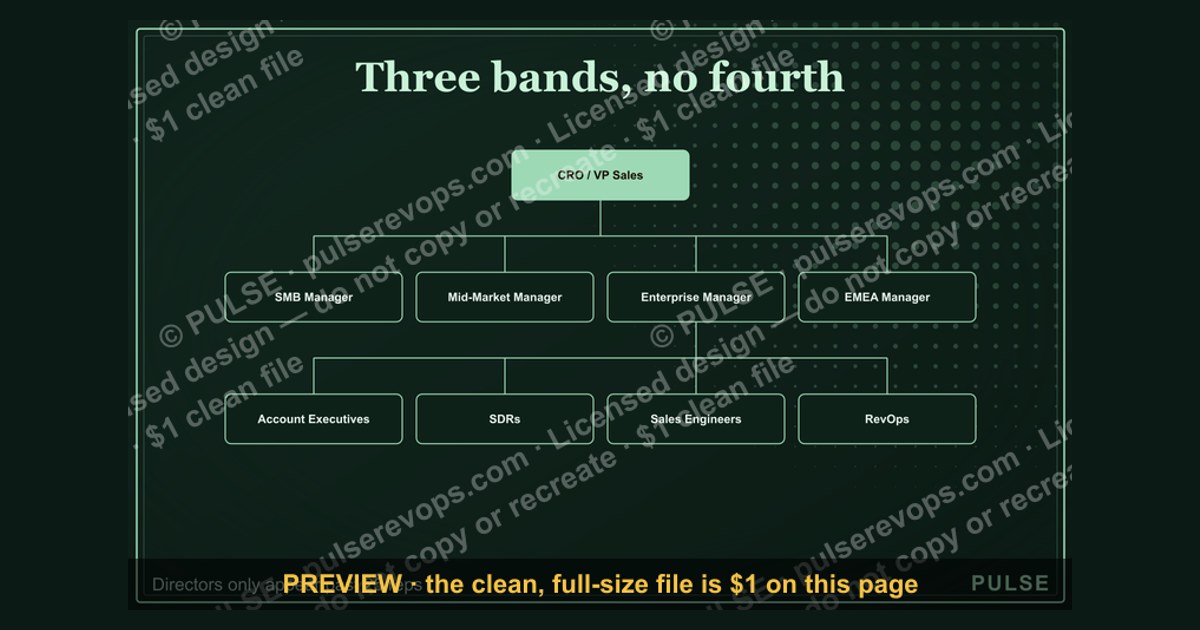
A Series B sales org chart usually shows one VP of Sales or CRO over two to four first-line managers, each carrying five to eight account executives, with SDRs, sales engineering, and RevOps drawn as parallel branches rather than nested under quota-carrying reps. Total sales headcount typically lands between 20 and 45 people.
The outcome you should expect from a Series B org chart
The chart is not a decoration for the board deck. Drawn correctly, it forces three decisions you would otherwise defer until they become expensive: who owns the number, how many people any one manager can actually coach, and which functions sit inside the sales line versus beside it. A Series B company that draws its chart honestly discovers within an afternoon whether it has a management gap, a support gap, or a segmentation problem it has been papering over with heroics from two strong reps.
Expect the finished chart to have three horizontal bands and no more. Band one is the revenue leader — a VP of Sales if the CEO still runs marketing and success, a CRO if all three roll up to one person. Band two is first-line management, typically two to four managers split by segment (SMB, mid-market, enterprise) or by geography (East, West, EMEA) depending on whether your deal sizes cluster or your buyers do. Band three is the individual contributors: account executives, SDRs, and sales engineers. If you find yourself drawing a fourth band — a director sitting between the VP and the managers — you almost certainly have fewer than 25 sales people and are building overhead ahead of load.
Expect spans of control between five and eight. Below five direct reports, the manager becomes a super-rep who takes over deals instead of coaching them, and you are paying a $200K+ loaded salary for what is functionally an AE with a title. Above eight, one-on-ones compress to status updates, pipeline inspection turns into spreadsheet review, and ramping reps get the least attention exactly when they need the most. The five-to-eight window is where a manager can run weekly one-on-ones, sit in on two to three live calls per rep per month, and still own their team's forecast.

Expect the support functions to be visible as their own nodes. At Series A, "sales ops" is a founder with a spreadsheet and "enablement" is a Notion page. At Series B, both become real lines on the chart because the cost of not having them shows up as forecast variance and six-month ramp times. The chart should make it obvious whether RevOps reports into sales, into finance, or sits neutral — that reporting line determines whether your pipeline numbers get argued about or trusted.
Finally, expect the chart to have a shelf life of roughly two quarters. A Series B org chart is a snapshot of a company that is intentionally changing shape. The useful artifact is not the boxes; it is the annotated version showing which boxes are filled, which are open reqs, which are backfills, and which are aspirational hires gated on hitting a revenue milestone. Boards read the second version. Teams need the second version too, because an empty box with a hiring date attached is a promise, while an empty box with nothing attached is a rumor.
What drives the shape of the chart
Four inputs determine the structure, and they interact. Change any one and the chart redraws itself.

Average contract value sets the ratio of support roles to closers. Under roughly $15K ACV, you are running a velocity motion: more SDRs than AEs is unusual, but a 1:1 SDR-to-AE ratio is common, sales engineers are rare or shared, and one manager can run eight reps because deals are short and inspection is fast. Above $75K ACV, the ratio inverts — you need a sales engineer for every two to three AEs, SDR support thins out in favor of marketing-sourced and partner-sourced pipeline, and spans tighten toward five because each deal has more stakeholders and more ways to stall.
Sales cycle length sets how deep your management layer needs to go. A 30-day cycle means a manager can diagnose a bad quarter inside the quarter. A 180-day cycle means the mistakes you are making now surface two quarters out, which is exactly why enterprise-motion Series B companies invest earlier in deal-review discipline and pipeline hygiene than their velocity-motion peers. Longer cycles justify a dedicated deal desk or a proposal specialist far sooner than headcount alone would suggest.
Segmentation choice is the single most contested line on the chart. Splitting by company size creates clean quota logic and clean compensation, but produces territory disputes every time a customer grows across the boundary. Splitting by geography respects buyer time zones and travel, but mixes deal sizes inside one team and makes it hard to compare rep performance. Splitting by vertical produces the best win rates when your product genuinely behaves differently per industry, and the worst pipeline coverage when it does not, because each rep's addressable market shrinks. Most Series B companies land on size-based segmentation with a geographic sub-split inside the largest segment.

Where expansion revenue lives quietly determines whether your chart has three branches or four. If account executives own renewals and upsells, customer success sits outside the sales chart as a retention and adoption function. If a separate account management team owns expansion, it appears as a peer branch under the same revenue leader, and you now need a handoff protocol drawn as a dotted line — because an undocumented handoff is where net dollar retention goes to die.
Notice what the diagram does not show: dotted lines. In practice, sales engineers are frequently a shared pool reporting to one leader but deployed across both AE teams, and enablement has a functional relationship with every manager on the chart. Draw those as dotted lines on your internal version. A solid line means "sets your priorities and writes your review." A dotted line means "you owe them responsiveness." Confusing the two is how sales engineers end up with five bosses and no clear quarter goals.
Benchmarks and realistic ranges
Treat these as calibration ranges, not targets. The right number for your company depends on ACV, motion, and how much of your pipeline marketing produces.
Headcount. Series B sales organizations commonly run 20 to 45 people total across all sales-adjacent roles. A typical mid-market composition: one VP, three managers, 14 to 18 AEs, eight to 12 SDRs, two to four sales engineers, and two to three RevOps and enablement staff. Enterprise-motion companies land lower in absolute headcount but higher in cost per head. Velocity-motion companies land higher in headcount with a heavier SDR weighting.
Spans of control. Five to eight direct reports per first-line manager is the working range. Ratios of one manager per six reps are the most common landing spot. If you are running one manager per 10 or 12, you are under-managed and will see it first in ramp times and in the bottom quartile of your rep distribution.

Ratios between roles. SDR-to-AE ratios of 1:1 up to 2:1 are typical in velocity motions; 0.3:1 to 0.5:1 in enterprise motions where partners and marketing carry more of the top of funnel. Sales engineer coverage of one SE per three to five AEs is common in technical products, and effectively zero in self-serve-adjacent products. RevOps typically runs one person per 15 to 25 revenue-team employees at this stage.
Ramp and productivity. New AEs commonly need three to six months to reach full productivity, with technical or enterprise products at the longer end. A reasonable ramp schedule holds quota at zero for months one and two, roughly a quarter to a half of full quota in months three and four, and full quota by month six or seven. Companies that skip a formal ramp plan tend to pay for it twice: once in missed forecast, once in attrition of hires who never got a fair shot.
Quota coverage and pipeline. Pipeline coverage of roughly 3x quota for the quarter is the conventional planning assumption, adjusted up if your win rates run below 25% and down if they run well above. Rep-level pipeline generation should be a tracked number, not an inferred one — if a rep needs to close a given amount and your win rate is one in four, the arithmetic on required pipeline is not optional.
Manager cost load. Every management layer you add costs roughly the fully loaded price of a senior AE without carrying a direct quota. That is the honest trade: you are betting that a manager lifts six reps' attainment by more than one rep's worth of production. At six reps, the manager needs to add roughly 17% lift across the team to break even. Coaching-trained managers clear that bar. Promoted-top-rep managers with no coaching support frequently do not, which is an argument for training investment rather than for skipping the layer.

Distribution health. A healthy Series B team has most reps clustered near attainment rather than a bimodal split of two heroes and a long tail. When a third or more of the team sits far below target, the problem is rarely individual — it is territory design, lead distribution, qualification standards, or a quota set from a board deck rather than from territory math.
Risks, edge cases, and failure modes
Hiring management ahead of load. The most common and most expensive Series B org mistake is adding a director layer, a second VP, or a regional leader before there are enough reps to justify them. Each premature leader adds fixed cost, adds a meeting layer, and — worse — creates a political incentive to grow their team so the role looks proportionate. If a manager has three reps, you do not need a director above them; you need three more reps.
Promoting your best rep into management by default. Selling and coaching are different jobs with partially opposed instincts. The strongest closer's reflex is to take the wheel on a stalled deal, which produces one saved deal and one rep who learned nothing. If you promote internally — and there are good retention reasons to — pair it with real coaching training and an explicit expectation that the manager's number is their team's number, not their own.
Segmentation that fights the compensation plan. If you split by segment but pay a single flat commission rate, your enterprise reps will resent longer cycles and your SMB reps will out-earn them on volume, or vice versa. The chart and the comp plan have to be designed together. Similarly, if two teams can both legitimately claim an account, you need written rules of engagement before the first dispute, not after.

Support functions treated as overhead. RevOps and enablement are the first roles cut when a board asks about burn, and the cut is usually a false economy. Without RevOps, forecast accuracy degrades and every leader builds their own spreadsheet, which means the weekly revenue meeting becomes an argument about whose numbers are right. Without enablement, ramp stretches and every manager reinvents onboarding.
The undrawn handoff. Every boundary on the chart is a handoff, and every undocumented handoff leaks. SDR to AE, AE to implementation, AE to customer success, sales to finance for contracting — each needs an owner, an entry condition, and an exit condition. The failure is silent: nobody reports a broken handoff, they just report a slow quarter.
Over-specialization too early. Splitting roles into narrow specialties works at scale, but at 20 people it creates coordination overhead that exceeds the efficiency gain. A dedicated deal desk, a dedicated proposal writer, a dedicated demo engineer, and a dedicated onboarding specialist is a fine 200-person structure and a poor 30-person one.
Territory design by convenience. Territories carved by whoever was hired first, or by an alphabetical account split, produce wildly unequal opportunity. Two reps with identical skill and identical effort will post different numbers, and you will draw the wrong conclusion about both. Rebalance territories on a set cadence, communicate the logic, and protect reps from losing in-flight deals when lines move.
Ignoring the adjacent org. The sales chart does not exist in isolation. If marketing is producing a share of pipeline, marketing's team shape constrains yours — a two-person demand gen team cannot feed 15 AEs, no matter how the sales boxes are drawn. The same applies downstream: if implementation is a bottleneck, closing faster just grows a queue and eventually shows up as churn. Draw the adjacent functions in gray on the same page and the constraints become obvious.

Geography and remote reality. Distributed teams change span math. A manager running six reps across four time zones has meaningfully less coaching bandwidth than one running six reps in one office. Cluster reporting lines by time zone where you can, and if you cannot, budget a smaller span.
A practical rollout plan
Redrawing an org chart is an organizational change, not a diagramming exercise. Sequence it.
Start with the math, not the boxes. Take next year's revenue target, divide by realistic quota per rep, and adjust for ramp — a rep hired in month seven contributes a fraction of a year's quota. That gives you required productive rep-years, which converts to a hiring plan with dates. Only then do you know how many managers you need, because manager count is a function of rep count and your chosen span.
Audit the current state honestly. List every person, their actual function (not their title), their real reporting line (not the one in the HRIS), and their attainment. Titles drift at startups; the audit usually surfaces two or three people doing jobs nobody realizes they are doing, and one function everybody assumed was owned that is not.
Choose the segmentation before you choose the people. Decide size, geography, or vertical based on where your win rates actually differ. Pull the last several quarters of closed-won and closed-lost data and look for the cut that produces the biggest spread. If no cut produces a meaningful spread, do not segment yet — a single team with one manager per six reps is a legitimate structure.

Draw the target chart and the bridge chart. The target is where you intend to be in four quarters. The bridge is what you will actually run next quarter, with open reqs marked and dates attached. Share both. People handle change well when they can see the destination and the sequence.
Fix the comp plan in the same cycle. New territories with old quotas produce immediate unfairness. Recalculate quota from territory potential, set accelerators above target, and communicate the plan before the quarter starts, not three weeks in.
Communicate individually before you communicate broadly. Anyone whose manager, territory, or scope changes hears it in a one-on-one first. An all-hands reveal where someone learns they have a new boss from a slide is a resignation-generating event.
Instrument it, then review on a cadence. Weekly: pipeline coverage, stalled deals, activity against ramp plan. Monthly: stage conversion, cycle length, attainment distribution. Quarterly: span of control, territory balance, ramp time trend, and voluntary attrition. Those quarterly numbers are the ones that tell you when the chart needs to change again.
Related questions
How is a Series B chart different from a Series A chart?
Series A typically has a founder or single sales leader managing everyone directly, with 10 or fewer reps and no formal support functions. Series B introduces a real first-line management layer, segmented teams, and dedicated RevOps and enablement roles.
Should we hire a CRO or a VP of Sales?

A VP of Sales owns the sales team; a CRO owns sales, marketing, and often customer success together. Most Series B companies hire the VP first and add or promote to CRO once the functions are large enough to need a single coordinating owner.
Where should RevOps report?
Under the revenue leader if you need speed and tight alignment with sales priorities; under finance or a neutral operations function if forecast credibility with the board matters more. The trade-off is responsiveness versus perceived independence of the numbers.
Do SDRs report to sales or marketing?
Both work. Reporting to sales keeps qualification standards aligned with what AEs will accept; reporting to marketing keeps messaging and campaign integration tighter. Pick based on which handoff is currently leaking more, and revisit annually.
How often should the chart be redrawn?
Formally once or twice a year, tied to planning. Informally, revisit any time a manager's span drifts outside five to eight, a segment's win rate diverges sharply from the others, or headcount grows by more than about a third.
FAQ
What roles belong on a Series B sales org chart beyond AEs?
First-line sales managers, sales development representatives, sales engineers or solutions consultants, and revenue operations. Enablement often appears as a shared function rather than a full team. Customer success may sit on the same chart or beside it, depending on whether it carries an expansion number.
How many management layers should there be?

Two to three between the top revenue leader and an individual contributor is typical at this stage — commonly VP, first-line manager, rep. Adding a director layer before you have roughly 25 to 30 reps usually creates a bottleneck and fixed cost without a corresponding gain in coaching capacity.
Should the chart split by segment or by geography?
Split by whichever dimension your win rates actually differ along. Segment splits give cleaner quota and comp logic; geographic splits respect buyer time zones and travel. Many companies combine both — segment at the top level, geography as a sub-split inside the largest segment.
What span of control should each manager have?
Five to eight direct reports. Fewer than five and the manager tends to sell instead of coach; more than eight and one-on-ones degrade into status updates. Distributed teams spread across many time zones should sit at the lower end of that range.
How do we show open roles on the chart?
Use a distinct visual treatment — dashed outline, gray fill, or an explicit "open" tag — and attach a target start date and the milestone that unlocks the hire. An open box with a date is a plan; an open box without one becomes a source of speculation.
Does the chart need dotted lines?
Yes, for any shared or matrixed function. Sales engineers deployed across multiple teams, enablement supporting every manager, and deal desk relationships all warrant dotted lines. Keep the meaning strict: solid means priority-setting and performance review, dotted means an obligation to respond.
Sources
- https://hbr.org/ — Harvard Business Review, organizational design and sales force structure research
- https://www.saastr.com/ — SaaStr, B2B SaaS sales org structure, hiring, and scaling benchmarks
- https://www.gartner.com/en/sales — Gartner sales practice, org benchmarks and role definitions
- https://openviewpartners.com/ — OpenView, SaaS operational and go-to-market benchmark reports
- https://www.bvp.com/atlas — Bessemer Venture Partners Atlas, SaaS growth and efficiency metrics
- https://a16z.com/ — Andreessen Horowitz, go-to-market and sales hiring guidance for growth-stage companies
- https://www.pavilion.com/ — Pavilion, revenue leadership community research and compensation practices
- https://www.forentrepreneurs.com/ — For Entrepreneurs, SaaS sales capacity and quota planning models
Related on PULSE
This page will be disappearing soon. Save it to your device for $1 — or read it free while it is here.
@Kory-White- · if Venmo asks, the last 4 of my number are 2012
This page is gone.
This one is off the shelf now. $1 keeps it on your phone for good — the whole page, pictures and diagrams included.
 graphicPLG Sales Overlay Org Chart
 graphicGTM Org Wheel
 graphicSeries A Sales Org Chart
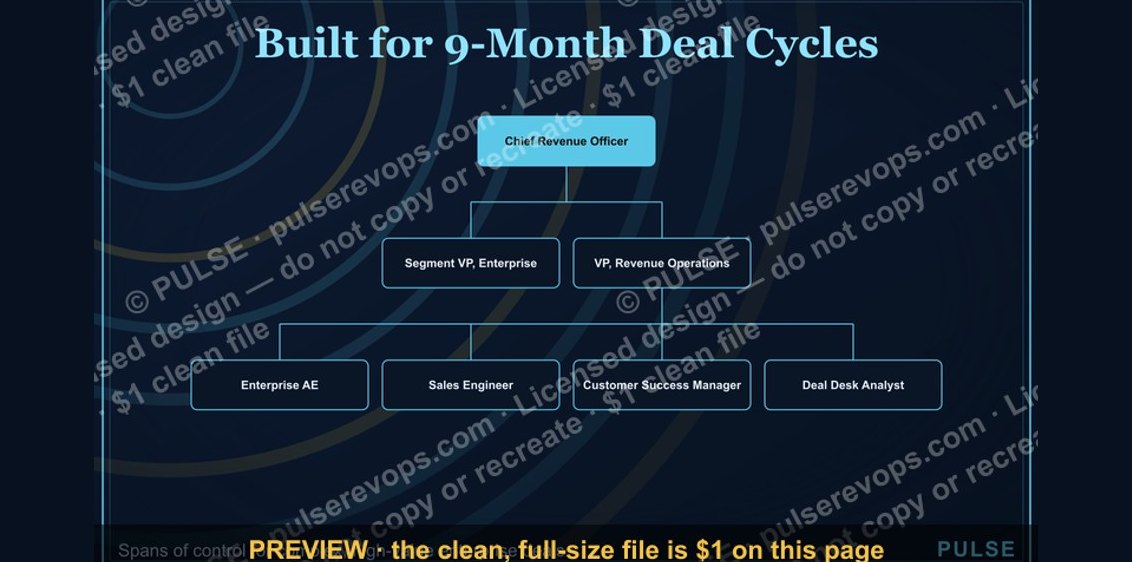 graphicEnterprise Sales Org Chart
 graphicRevOps Team Structure
 graphic“Slow is smooth. Smooth is fast.” — Quote Card
 graphicFractional CRO — LinkedIn Banner
 graphicPipeline Stages — Icon / Clip Art
 graphicMarketing Funnel — TOFU MOFU BOFU
 graphicLaunch / Growth Rocket Icon — Icon / Clip Art