


Enterprise Sales Org Chart
Quality
Certified
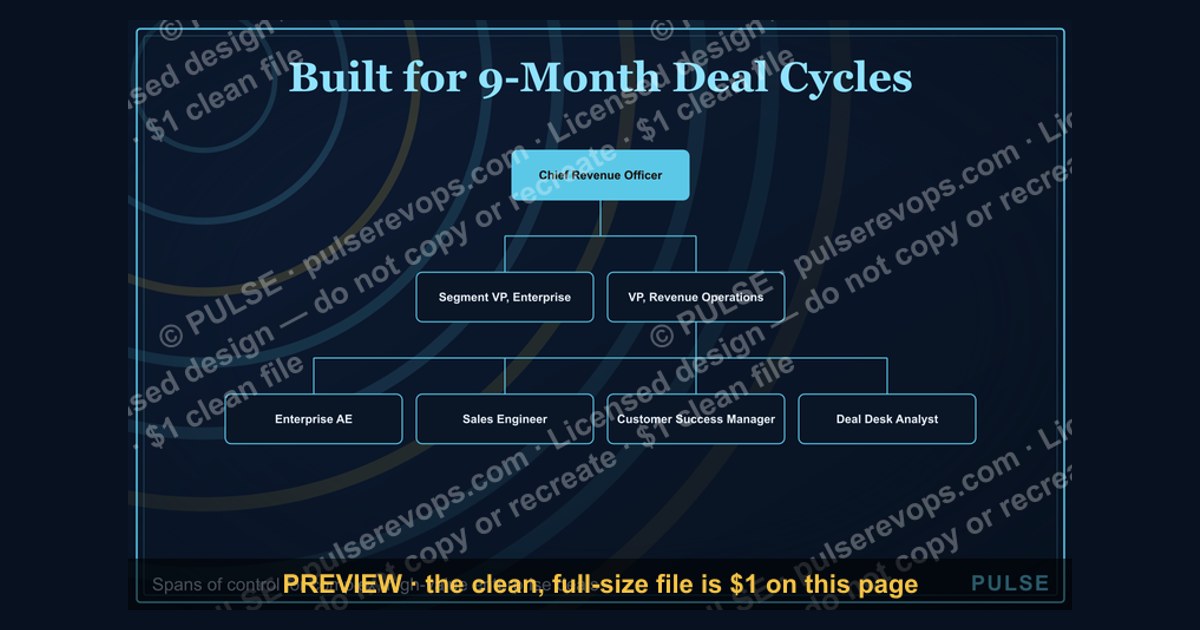
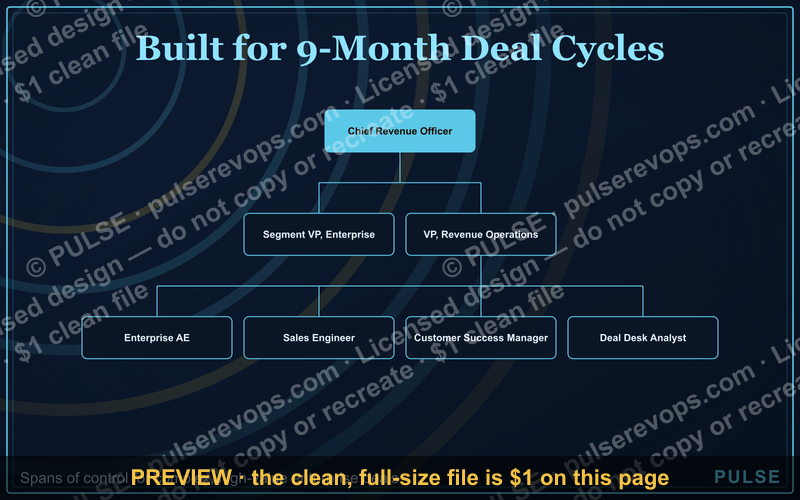
An enterprise sales org chart is a hierarchical map of the roles, reporting lines, and spans of control required to sell complex, high-value products to large organizations. It typically places a Chief Revenue Officer or VP of Sales at the top, supported by regional or segment VPs, directors, enterprise account executives, sales engineers, customer success managers, and revenue operations teams.
The Moment Your Sales Team Outgrows Itself
Picture a software company that has spent three years selling to mid-market customers with a flat team of five sellers. Then the company lands its first two enterprise accounts—each worth $400,000 in annual recurring revenue. The founder quickly discovers that these deals require security questionnaires, procurement negotiations, legal redlines, and executive sponsorship calls. The generalist account executives who thrived on 30-day sales cycles are now managing 9-month deal cycles with 11 stakeholders per opportunity. The part-time sales operations person cannot keep up with forecasting, territory assignments, and commission calculations. The customer success manager is spending all their time on onboarding the new enterprise accounts and has no capacity for renewals.
This scenario is the exact moment when a formal enterprise sales org chart becomes necessary. The structure that worked for small deals actively breaks under enterprise deal complexity. The org chart is not a bureaucratic exercise—it is the answer to specific operational failures: unclear deal ownership, missing technical support during evaluations, no one accountable for post-sale expansion, and no system for forecasting accuracy.
The transition typically happens when annual recurring revenue reaches roughly $5 million to $10 million, or when the average deal size exceeds $100,000. At that point, the cost of a dedicated enterprise structure—which can run 20 percent to 30 percent of revenue—becomes cheaper than the cost of lost deals, stalled negotiations, and customer churn from poor handoffs.

How the Enterprise Sales Org Chart Actually Works
The enterprise sales org chart differs from SMB or mid-market structures in several fundamental ways. The first difference is the separation of roles that were previously combined. In a small team, one person might handle prospecting, demos, negotiations, and account management. In an enterprise structure, these functions split into distinct roles because each one requires different skills, tools, and performance metrics.
The second difference is the depth of the hierarchy. Enterprise org charts typically have five to seven levels between the CEO and the individual contributor, compared to three or four levels in mid-market organizations. This depth exists because enterprise deals require specialized expertise at each stage of the sales cycle, and no single person can credibly handle all of it.
The third difference is the presence of support roles that do not exist in smaller structures. Sales engineers, solution consultants, revenue operations analysts, sales enablement specialists, and dedicated customer success managers are all standard in enterprise org charts. These roles exist to handle the technical complexity, data requirements, and ongoing account management that enterprise customers demand.

The reporting lines in this structure are not always simple solid lines. Many enterprise org charts use dotted-line reporting for matrixed roles. A sales engineer might have a solid reporting line to a Director of Solutions Engineering but a dotted line to the regional VP for day-to-day priorities. A customer success manager might report to the VP of Customer Success but work closely with the enterprise account executive on renewal strategy. Revenue operations often reports to the CRO but also serves the CFO for forecasting and commission accuracy.
The span of control—the number of direct reports each manager oversees—is a critical design parameter. In enterprise sales, the typical span of control for a first-line sales manager is five to eight account executives. Beyond eight, coaching quality degrades and forecasting accuracy drops. Regional VPs typically oversee three to five directors or a larger group of account executives if the structure is flatter. The CRO typically has three to eight direct reports, including functional heads for sales, customer success, marketing, and revenue operations.
Real Numbers, Ranges, and Benchmarks
The enterprise sales org chart is ultimately a budget allocation decision, and the numbers vary predictably by company stage, deal size, and sales cycle length. Understanding these benchmarks helps leaders design structures that are neither overstaffed nor under-resourced.
Compensation benchmarks. Enterprise account executives typically earn between $200,000 and $400,000 in on-target earnings, with a 50/50 or 60/40 split between base salary and variable compensation. Top performers at large enterprise software companies can exceed $500,000. Regional VPs earn $300,000 to $600,000 in OTE. Sales engineers earn $180,000 to $300,000, with a higher base component—typically 70 to 80 percent—because their role is less transactional. Customer success managers earn $100,000 to $180,000 base with OTE up to $220,000. Revenue operations leaders earn $180,000 to $300,000, and their analysts earn $80,000 to $150,000. A CRO at an enterprise SaaS company earns $250,000 to $500,000 in base salary, with total compensation including equity reaching $1.5 million or more.

Headcount ratios. The ratio of supporting roles to account executives is one of the most debated numbers in enterprise sales design. A common starting point is one sales engineer for every two to three account executives in complex technical sales, and one for every four in simpler environments. The SDR-to-AE ratio ranges from 1:2 to 1:4, depending on whether the company relies primarily on inbound leads or outbound prospecting. Customer success managers typically handle 10 to 30 enterprise accounts each, depending on account complexity and renewal risk. Revenue operations staff should represent roughly one person for every 15 to 20 total sales headcount in mature organizations.
Cost per seller. The fully loaded cost of one enterprise account executive—including salary, benefits, tools, travel, and training—typically exceeds $300,000 per year. A full enterprise sales organization for a $10 million new ARR target might include one CRO, two regional VPs, eight account executives, four sales engineers, four SDRs, one revenue operations manager, and two customer success managers. That is 22 people with an annual cost of $5 million to $7 million.
Productivity expectations. Enterprise account executives are typically expected to generate five to ten times their OTE in new annual recurring revenue. An AE earning $300,000 in OTE should produce $1.5 million to $3 million in new ARR annually. This productivity expectation drives the headcount math—if the company needs $20 million in new ARR, it needs roughly 8 to 13 enterprise AEs, assuming average productivity.
Sales cycle and pipeline ratios. Enterprise deals take 6 to 18 months from initial contact to closed-won. The win rate for enterprise deals is typically 20 to 30 percent for qualified opportunities. This means an AE needs roughly four to five qualified opportunities in the pipeline for every deal they expect to close. With an average deal size of $250,000 and a 25 percent win rate, an AE needs $4 million in qualified pipeline to hit a $1 million quota. Sales leaders use these ratios to set pipeline targets and to determine how many SDRs and marketing leads are needed to feed the organization.

Attrition benchmarks. Enterprise sales organizations typically see 10 to 20 percent annual turnover among account executives, with higher turnover in the first 12 months. Sales engineers and customer success managers tend to have lower turnover—8 to 15 percent—because their compensation is more stable and their skills are more specialized.
Trade-offs and Alternatives
There is no single correct enterprise sales org chart. The right structure depends on the company's product complexity, target customer profile, sales cycle length, and growth stage. Leaders should understand the trade-offs between common structural alternatives before committing to a design.
Named account versus territory model. In a named account model, each AE owns a specific list of 15 to 30 high-value accounts. This works well when the company has a small number of large, strategic targets—for example, a company selling to the Fortune 500 might have 200 total target accounts, so each of 10 AEs owns 20 accounts. The trade-off is that named account models are inefficient when the target market is large and undifferentiated. A territory model, where AEs own all accounts in a geographic region, works better for broader markets but can create coverage gaps for strategic accounts that fall between territories. Many enterprise organizations use a hybrid: named accounts for the top 50 to 100 strategic targets, and territory coverage for the rest.
Vertical specialization versus generalist AEs. Some enterprise org charts organize AEs by industry—healthcare, financial services, manufacturing, and so on. This vertical model works well when the product has deep vertical-specific features, compliance requirements, or integration needs. The trade-off is that vertical specialization reduces flexibility; if one vertical underperforms, those AEs cannot easily cover another vertical's territory. Generalist AEs are more flexible but require more sales engineering support to handle industry-specific questions.

Centralized versus embedded support roles. Sales engineers, SDRs, and customer success managers can be organized centrally—reporting to their functional leaders—or embedded within regional sales teams. Centralized structures create consistency, shared best practices, and easier training, but they can create friction when regional VPs need to prioritize resources. Embedded structures give regional leaders more control but risk inconsistent practices across regions and underutilization of specialized talent.
Inside sales versus field sales. Enterprise org charts also differ by whether AEs work remotely or travel to meet customers in person. Field sales—where AEs travel to customer sites—is still common for large enterprise deals, especially in industries like manufacturing, healthcare, and government. Inside sales, where AEs work remotely and use video conferencing, has grown significantly since 2020 and reduces cost per seller by 20 to 40 percent. The trade-off is that inside sales can be less effective for building deep executive relationships in complex, multi-stakeholder deals.
Span of control trade-offs. A flatter org chart—where one director manages 10 to 12 AEs directly—reduces management cost and speeds decision-making, but it limits coaching quality and creates bottlenecks during forecasting cycles. A deeper org chart—where directors manage five to six AEs, and regional VPs manage three to four directors—improves coaching and accountability but adds 15 to 20 percent to management overhead. Most mature enterprise organizations settle on a middle ground: first-line managers with six to eight direct reports, and second-line leaders with four to six direct reports.

Build versus buy for support functions. Some enterprise organizations hire full-time sales engineers, while others rely on product specialists from the engineering team who join sales calls on an ad-hoc basis. Full-time sales engineers are expensive but provide consistent technical support and better discovery. Ad-hoc product specialists are cheaper but create scheduling conflicts and inconsistent messaging. Similarly, some organizations build an in-house revenue operations team, while others rely on external consultants or fractional RevOps support until they reach sufficient scale.
The overlay model. Some enterprise org charts include an "overlay" team—specialists who do not own quota but support the core AEs. Overlay roles include product specialists, industry experts, competitive intelligence analysts, and executive relationship managers. The trade-off is that overlay teams add headcount without directly owning pipeline, which can create tension with quota-carrying AEs. The benefit is that overlays provide expertise that generalist AEs cannot develop on their own.
Common Pitfalls and How to Avoid Them
Enterprise sales org charts fail in predictable ways. Understanding these failure modes helps leaders design structures that avoid the most common problems.
Pitfall one: Promoting your best AE to sales manager without training. The most common error is taking the top-performing account executive and making them a first-line manager without any management training. The result is a manager who still acts like an AE—jumping into deals, doing demos, and negotiating directly—while their team receives no coaching or pipeline support. The fix is to invest in management training, establish clear expectations for the manager's role, and measure them on team performance rather than personal production.

Pitfall two: Under-investing in sales engineering. Many enterprise org charts start with a ratio of one sales engineer for every five or six AEs, which leads to AEs running demos themselves or sales engineers being booked solid for weeks. The result is lower win rates on technical evaluations and longer sales cycles. The fix is to staff sales engineering at a ratio of one to two or one to three AEs in complex technical sales, and to track sales engineer utilization to identify bottlenecks.
Pitfall three: No clear handoff between sales and customer success. When the enterprise org chart has no defined handoff process—or the handoff happens after the contract is signed without a formal onboarding plan—customers experience a "cliff" where they lose momentum after purchase. The fix is to define a formal handoff at a specific milestone (for example, after the kickoff call or after the first 30 days), and to ensure the AE and CSM share account context through a documented transition process.
Pitfall four: Ignoring revenue operations until it is too late. Enterprise sales organizations generate massive amounts of data—pipeline, forecasts, territories, commissions, win-loss analysis, and customer health scores. Without a dedicated RevOps function, this data lives in spreadsheets, forecasts are inaccurate, and commission disputes consume leadership time. The fix is to hire a RevOps lead before the sales team reaches 15 to 20 people, and to give them authority over CRM administration, forecasting processes, and compensation design.
Pitfall five: Creating too many layers. Some enterprise org charts add layers to create promotion paths, resulting in seven or eight levels between the CEO and the AE. Each layer slows decision-making, adds cost, and distorts information as it travels up and down. The fix is to keep the org chart as flat as possible while maintaining reasonable spans of control—typically no more than five or six layers between the CEO and the individual contributor.

Pitfall six: Mismatched compensation structures. When the org chart separates roles but the compensation structure does not reward collaboration, the structure fails. For example, if AEs are paid purely on new business and CSMs are paid purely on renewals, neither has an incentive to coordinate on expansion opportunities. The fix is to design compensation that rewards shared outcomes—such as giving AEs a smaller accelerator on renewals or giving CSMs a component tied to net revenue retention.
Pitfall seven: Failing to evolve the org chart. Enterprise org charts are often created once and then treated as permanent. But the sales organization needs to change as the company enters new markets, launches new products, or shifts its go-to-market strategy. The fix is to review the org chart at least quarterly, and to conduct a formal redesign whenever there is a major change in product strategy, target market, or company stage.
Pitfall eight: Copying a competitor's org chart. It is tempting to replicate the org chart of a successful competitor, but org charts are context-specific. A competitor with a $500 million revenue base, a mature product, and a global footprint has different needs than a company at $20 million revenue with a single product. The fix is to design the org chart based on your specific deal size, sales cycle, product complexity, and growth targets, using industry benchmarks only as reference points.
Related questions
What is the typical span of control for enterprise sales managers?
First-line enterprise sales managers typically oversee five to eight account executives. Regional VPs usually manage three to five directors or a larger group of AEs in flatter structures. The CRO typically has three to eight direct reports including functional heads. Spans beyond eight AEs per manager degrade coaching quality and forecasting accuracy.
How many sales engineers should an enterprise sales team have?
A common benchmark is one sales engineer for every two to three account executives in complex technical sales, and one for every four in simpler environments. Under-staffing sales engineering leads to longer sales cycles and lower win rates on technical evaluations. Track sales engineer utilization to identify bottlenecks.
What is the difference between an enterprise sales org chart and a mid-market one?

Enterprise org charts are deeper, with five to seven levels between the CEO and individual contributors, and include specialized roles like sales engineers, revenue operations, and dedicated customer success managers. Mid-market structures are flatter, with three to four levels and more generalist roles combining prospecting, selling, and account management.
How do you calculate headcount for an enterprise sales organization?
Start with the new ARR target and divide by expected productivity per AE—typically five to ten times OTE. Then add supporting roles using standard ratios: one SE per two to three AEs, one SDR per two to four AEs, one manager per five to eight AEs, and one RevOps person per 15 to 20 total headcount.
When should a company build an enterprise sales org chart?
Build a formal enterprise sales org chart when average deal size exceeds $100,000, sales cycles stretch beyond six months, or annual recurring revenue reaches roughly $5 million to $10 million. The transition is driven by operational failures like unclear deal ownership, missing technical support, and poor forecasting.
FAQ
What is an enterprise sales org chart?
An enterprise sales org chart maps the hierarchy, roles, and reporting lines within a sales organization that sells complex, high-value products to large organizations. It typically includes leadership like a Chief Revenue Officer or VP of Sales, regional VPs, directors, enterprise account executives, sales engineers, customer success managers, and revenue operations teams.
How is an enterprise sales org chart different from a small business one?

Enterprise charts are more layered, with five to seven levels between the CEO and individual contributors, and include specialized roles for functions like sales engineering, revenue operations, and customer success. Small business charts are flatter, with three to four levels and generalist roles that combine prospecting, selling, and account management.
What are typical roles in an enterprise sales org chart?
Common roles include the CRO or VP of Sales, regional VPs, directors of enterprise sales, enterprise account executives, sales engineers, sales development representatives, customer success managers, and revenue operations analysts. Some organizations also include solution architects, channel managers, and sales enablement specialists.
How do you build an enterprise sales org chart?
Start by defining your go-to-market model—named account, territory, vertical, or hybrid. Then determine headcount based on revenue targets and productivity expectations. Map reporting lines with clear solid and dotted lines, define escalation paths, and establish spans of control of five to eight AEs per manager.
Why is an org chart important for enterprise sales?
It provides clarity on roles, responsibilities, and decision-making authority, which is critical for managing complex, multi-stakeholder deals. It also helps identify gaps in coverage, improve communication, and scale the sales organization efficiently as the company grows.
How often should an enterprise sales org chart be updated?
Review the org chart at least quarterly, and conduct a formal redesign whenever there is a major change in product strategy, target market, company stage, or go-to-market approach. The org chart should evolve as the company enters new markets, launches new products, or shifts its sales model.
Sources
- Gartner — enterprise sales organizational structures and best practices: https://www.gartner.com/en/sales
- Harvard Business Review — sales team design and performance metrics: https://hbr.org/topic/sales
- Salesforce — enterprise sales roles and org chart templates: https://www.salesforce.com/resources/articles/org-chart/
- McKinsey & Company — sales force effectiveness and organizational models: https://www.mckinsey.com/capabilities/growth-marketing-and-sales/our-insights
- LinkedIn Sales Solutions — B2B sales team structures: https://business.linkedin.com/sales-solutions
- Forrester Research — enterprise sales process and organizational benchmarks: https://www.forrester.com/research/
- SaaStr — SaaS sales org design and compensation benchmarks: https://www.saastr.com/
- Pavilion — RevOps and sales leadership community resources: https://www.joinpavilion.com/
Related on PULSE
This page will be disappearing soon. Save it to your device for $1 — or read it free while it is here.
@Kory-White- · if Venmo asks, the last 4 of my number are 2012
This page is gone.
This one is off the shelf now. $1 keeps it on your phone for good — the whole page, pictures and diagrams included.
 graphicSeries A Sales Org Chart
 graphicGTM Org Wheel
 graphicPLG Sales Overlay Org Chart
 graphicRevOps Team Structure
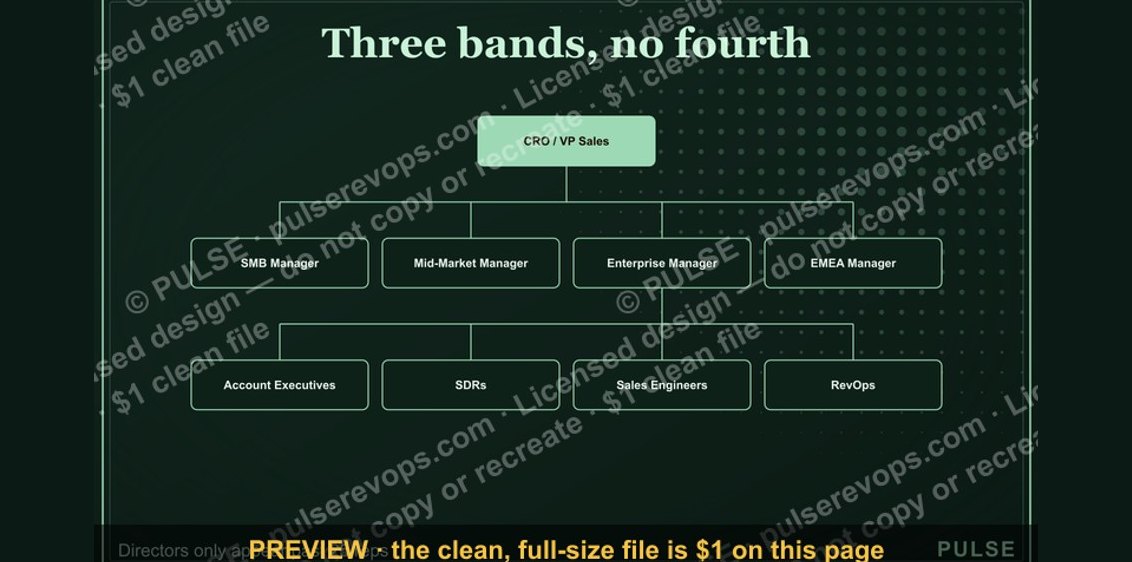 graphicSeries B Sales Org Chart
 graphic“SHOULD DO IT” — Sales Meme
 graphic“Every no is closer to a yes.” — Quote Card
 graphicSales Enablement — LinkedIn Banner
 graphicDeal Stage Progression Bar
 graphicClosed-Won Check Icon — Icon / Clip Art