


PLG Sales Overlay Org Chart

A PLG sales overlay org chart typically includes a VP of Sales or Revenue, underneath whom sit managers for sales development, customer success, and account management, with individual contributors like sales development reps, customer success managers, and account executives. The overlay structure layers specialized sales roles—such as expansion or enterprise reps—on top of the core product-led growth team to handle high-touch deals. Exact team sizes and reporting lines vary widely by company stage and product complexity.
PLG Sales Overlay Org Chart

PLG-overlay sales org chart: Growth team + Inside Sales team + Customer Success Engineering layout.
Format: SVG (scalable vector) · Size: 1584×396 px · Category: Org Chart · License: Free to use — no attribution required.
Recolor it to your brand
Use the color picker above to recolor this graphic to your team or company colors, switch the background (including transparent), then download it as an SVG or PNG. No sign-up, no watermark.

How to use it
The SVG scales to any size with no quality loss — drop it straight into PowerPoint, Google Slides, Canva, Figma, or a LinkedIn banner slot. The PNG export is ready to upload anywhere that wants a raster image.

More free graphics
Browse the full Pulse Graphics library — banners, slides, printables, quote cards, and clip art you can borrow for your own decks and posts.
Related on PULSE
- PLG Conversion Funnel
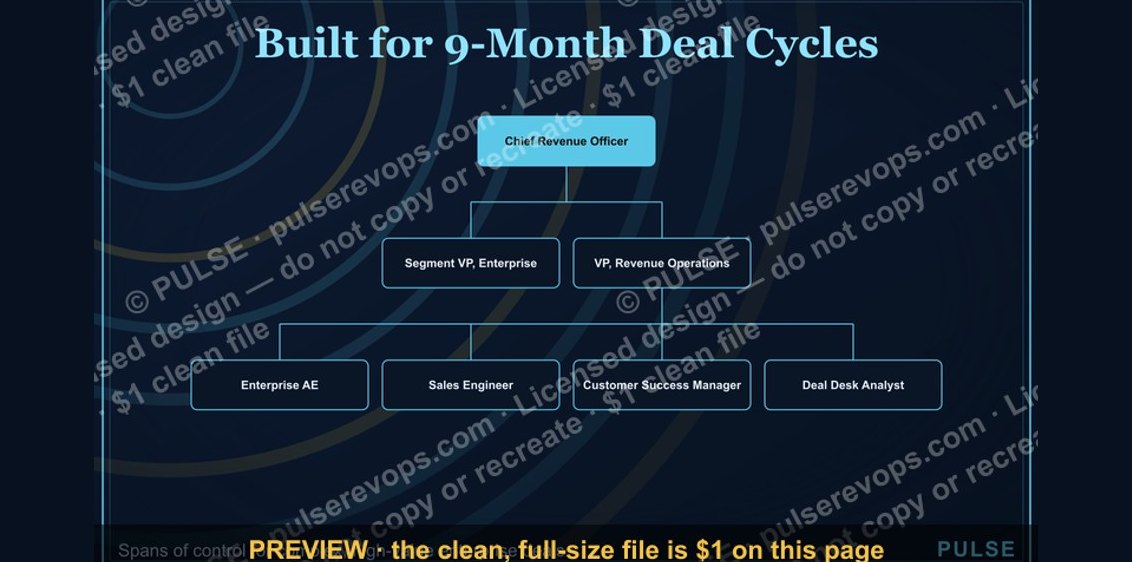
- Enterprise Sales Org Chart
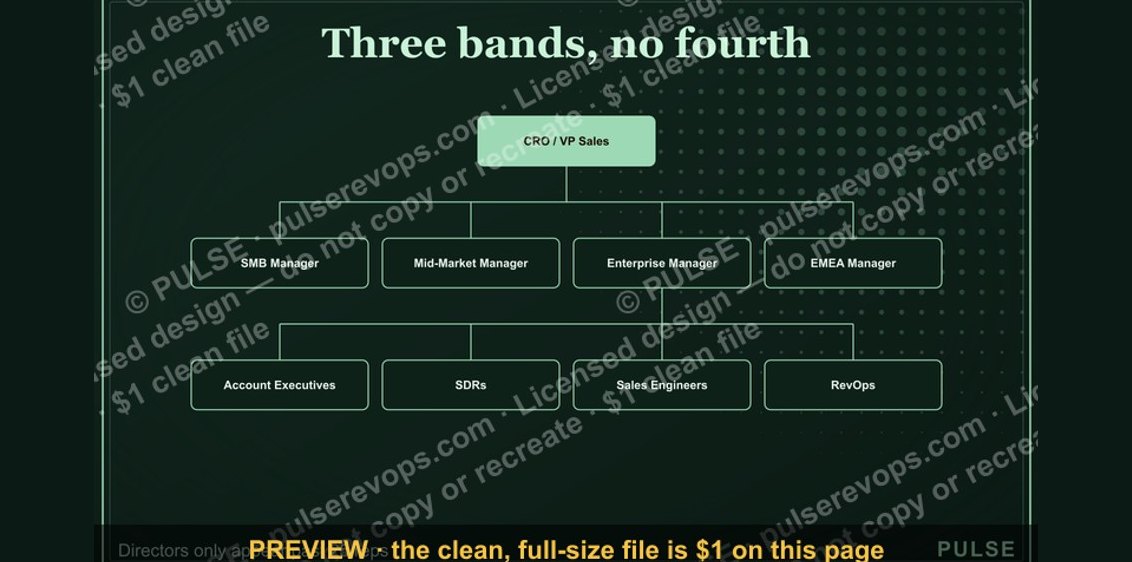
- Series B Sales Org Chart
- Series A Sales Org Chart
- GTM Org Wheel
- Churn by Segment Bar Chart
Key Roles and Responsibilities in a PLG Sales Overlay
A well-structured PLG sales overlay org chart typically includes several specialized roles that work in concert with product-led growth motions. The most common positions you’ll see in mid-to-late-stage PLG companies (those with $10M–$100M+ ARR) include:
Sales Development Representatives (SDRs) – Product-Qualified Lead Focus Unlike traditional SDRs who cold-call lists, PLG overlay SDRs work almost exclusively with product-qualified leads (PQLs). Their primary responsibility is to identify users who have hit key engagement thresholds—such as using a specific feature 5+ times, inviting 3+ team members, or reaching 80% of a usage limit—and then reach out to convert them into paid accounts. These SDRs typically carry quotas of 15–25 qualified meetings per month and use tools like Pendo, Amplitude, or Mixpanel to prioritize their outreach.
Account Executives (AEs) – Self-Serve to Sales-Assisted Bridge PLG overlay AEs don’t manage a traditional pipeline of inbound leads. Instead, they focus on accounts where product usage indicates high intent but the user hasn’t converted to a paid plan. For example, an AE might work with a team that has 50 active users on a free tier but hasn’t upgraded to a business plan. These AEs are measured on conversion rates from PQL to paid, average deal size (typically $5K–$50K ACV for mid-market), and time-to-close. They’re expected to close deals in 14–30 days, much faster than enterprise cycles.
Customer Success Managers (CSMs) – Expansion and Retention In a PLG overlay, CSMs don’t just handle support tickets. They monitor product usage across accounts to identify expansion opportunities—like a team using 80% of their storage limit or a department that hasn’t adopted a premium feature. CSMs also run health scores based on login frequency, feature adoption, and NPS surveys. Their compensation is often tied to net revenue retention (NRR), with targets of 110%–130% being common for mature PLG companies.
Product Managers (PMs) – Data Feedback Loop While not always on the org chart, a dedicated PM for PLG sales overlay is becoming more common. This role analyzes which product behaviors correlate with conversion and feeds that data back to the sales team. For instance, if users who complete an onboarding checklist within 3 days convert at 40% higher rates, the PM works with engineering to surface that insight in the CRM. This role typically reports to the VP of Product or directly to the Chief Revenue Officer.
Sales Operations – Workflow and Tooling PLG overlay sales ops manages the tech stack that connects product data to sales workflows. They configure tools like Salesforce, HubSpot, or Outreach to trigger tasks when product events occur (e.g., “user created 10 projects → assign to SDR”). They also build dashboards that show PQL volume, conversion funnel metrics, and sales velocity. A typical PLG sales ops team for a $20M ARR company might have 1–2 analysts dedicated to this function.
How to Structure Your PLG Sales Overlay by Company Stage
The size and shape of your PLG sales overlay org chart should evolve as your company grows. Here’s a practical breakdown by stage:
Early Stage ($1M–$5M ARR): The Founder-Led Overlay At this stage, you likely don’t have dedicated sales roles. The CEO or a founding team member handles the overlay directly. They’ll manually review product usage data (from tools like PostHog or Heap) and reach out to the top 10–20 most engaged free users each week. The goal is to validate that a sales-assisted motion can increase conversion rates by 15–30% compared to pure self-serve. You might hire your first SDR or AE when you’re consistently seeing 50+ PQLs per month that aren’t converting automatically.
Growth Stage ($5M–$30M ARR): The Dedicated Pod This is where you build a 3–5 person overlay team. A common structure is 2 SDRs, 2 AEs, and 1 CSM, all reporting to a Head of PLG Sales or a Revenue Operations Lead. Each SDR handles 100–200 active PQLs per month, while each AE manages a book of 50–80 target accounts. The CSM focuses on the top 20% of accounts by usage. At this stage, you’ll also want a part-time sales ops person to build automated workflows. The team should be generating 20–40 new meetings per month, with a 20–30% close rate on those meetings.
Scale Stage ($30M–$100M+ ARR): The Specialized Department Here, your PLG sales overlay becomes a full department with 15–30+ people. You’ll have teams of 5–8 SDRs focused on different segments (e.g., SMB vs. mid-market), 4–6 AEs, 3–5 CSMs, and 2–3 sales ops analysts. You might also add a dedicated Product-Led Growth Manager who runs experiments (e.g., testing different pricing pages or in-app upgrade prompts). The department head typically reports to the CRO or VP of Sales. At this scale, the overlay should be generating 100+ meetings per month and contributing 20–40% of total new revenue.
Enterprise Stage ($100M+ ARR): The Integrated Model At this point, the PLG sales overlay often merges with the enterprise sales team. You’ll have overlay specialists embedded within existing sales pods, working alongside field AEs. The org chart becomes matrixed—an AE might handle both inbound enterprise leads and PQLs from their territory. The overlay team’s metrics shift from PQL conversion to total contract value (TCV) influenced by product usage. You’ll also see dedicated roles like “PLG Enablement Manager” who trains the broader sales team on product-led selling techniques.
Common Pitfalls and Best Practices for PLG Sales Overlay Teams
Building a PLG sales overlay org chart isn’t just about hiring the right roles—it’s about avoiding mistakes that can kill the motion. Here are the most common pitfalls and how to address them:
Pitfall 1: Treating PQLs Like MQLs Many teams make the mistake of applying traditional lead scoring to product-qualified leads. A PQL isn’t just someone who visited your pricing page—it’s a user who has demonstrated product value through behavior. If your SDRs are calling PQLs with the same script they use for cold leads, you’ll annoy users and kill conversion. Instead, train your team to start conversations with value-based language like, “I noticed your team has been using our reporting feature heavily—would you like help setting up automated dashboards for your executives?”
Pitfall 2: Over-Hiring Before You Have Data It’s tempting to build a large overlay team after seeing early success, but this can backfire. If you don’t have enough PQLs to keep 3+ SDRs busy (typically 200+ per month), you’ll end up with reps chasing low-quality leads. A better approach: start with 1 SDR and 1 AE, track conversion metrics for 3 months, and only scale when you see consistent 20%+ conversion from PQL to paid.
Pitfall 3: Ignoring Product Feedback Loops Your overlay team will uncover patterns about why users don’t convert—maybe the pricing page is confusing, or a key feature is buried. If you don’t feed this back to product, you’re leaving money on the table. Set up a weekly 30-minute sync between sales and product teams where they review the top 3 reasons for non-conversion. At many companies, this feedback loop has led to changes that increased self-serve conversion by 10–25% without any sales effort.
Pitfall 4: Compensating Like Traditional Sales PLG overlay salespeople need different incentive structures. If you pay them purely on closed deals, they’ll focus on the easiest conversions rather than nurturing high-potential accounts. Consider a hybrid model: 50% base salary, 30% commission on closed deals, and 20% bonus tied to PQL engagement metrics (e.g., number of qualified meetings set or accounts moved from free to trial). For CSMs, tie 40% of variable comp to NRR and 60% to product adoption scores.
Best Practice: Use Tiered Outreach Sequences Not all PQLs are equal. Build a tiered approach: Tier 1 (high intent—e.g., team with 10+ users and 90% feature adoption) gets a personal email from an AE within 24 hours. Tier 2 (medium intent—e.g., single user with moderate usage) gets an automated email sequence with a calendar link. Tier 3 (low intent—e.g., signed up but barely used) gets a nurture campaign with product tips. This prevents your overlay team from wasting time on low-probability leads.
Best Practice: Measure What Matters Beyond basic conversion rates, track these PLG-specific metrics: Time from PQL creation to first contact (target: <24 hours), PQL-to-meeting conversion rate (target: 20–35%), meeting-to-paid conversion rate (target: 25–40%), and average days from PQL to closed-won (target: 14–30 days). Also track “self-serve vs. sales-assisted” revenue split—aim for 30–50% of new revenue coming from sales-assisted PQLs in a mature overlay.
Best Practice: Invest in Tooling Your overlay team needs a tech stack that connects product data to sales workflows. Essential tools include a product analytics platform (Amplitude, Mixpanel, or Heap), a CRM with PQL tracking (Salesforce or HubSpot with custom objects), a sales engagement platform (Outreach or SalesLoft), and a customer data platform (Segment or Rudderstack) to sync events. Budget $20K–$50K per year for this stack at the growth stage, scaling to $100K+ at the enterprise level.
Sources
- Gartner — research on sales and marketing organizational structures, including PLG and sales overlay models.
- Harvard Business Review — articles on go-to-market strategies and sales team design.
- Product-Led Growth Collective — insights and case studies on PLG implementation and org charts.
- SaaStr — community and resources on SaaS sales models, including overlay roles.
- Forrester — analysis of sales and product-led growth frameworks.
- LinkedIn Sales Solutions — reports on sales team structures and PLG best practices.
FAQ
What is a PLG Sales Overlay Org Chart? It’s a visual structure showing how a product-led growth (PLG) company layers a sales team on top of its self-serve motion. The chart typically maps roles like sales development, account executives, and customer success, and shows where they interact with product signals and user data.
When should a PLG company add a sales overlay? Most teams consider it when they see a meaningful number of high-intent users—often in the hundreds or low thousands—who aren’t converting to paid on their own. A rough range might be when monthly active users exceed a few thousand and free-to-paid conversion rates plateau below 5–10%.
What roles are typically in a PLG sales overlay? Common roles include a product-qualified account (PQA) rep, a sales development rep focused on inbound product signals, and an account executive for larger deals. Some orgs also add a customer success manager to handle expansion, but the exact mix depends on deal size and user volume.
How does a sales overlay differ from a traditional sales org? In a PLG overlay, sales reps rely heavily on product usage data—like feature adoption or time-to-value—rather than cold outreach. Their workflows are often triggered by automated scoring, and they typically handle fewer, warmer leads compared to a top-of-funnel sales team.
What metrics matter most for a PLG sales overlay? Key metrics include product-qualified lead (PQL) conversion rate, time from sign-up to first sales touch, and expansion revenue from existing users. Teams also track average deal size and sales cycle length, which can vary widely—from a few hundred to tens of thousands of dollars annually.
What are common pitfalls when building a PLG sales overlay? A frequent mistake is layering on sales too early, before product signals are reliable. Another is failing to align incentives—if sales reps are compensated purely on closed deals, they may ignore smaller, high-potential users. Teams also struggle with data integration between product analytics and CRM systems.
This page will be disappearing soon. Save it to your device for $1 — or read it free while it is here.
@Kory-White- · if Venmo asks, the last 4 of my number are 2012
This page is gone.
This one is off the shelf now. $1 keeps it on your phone for good — the whole page, pictures and diagrams included.
 graphicEnterprise Sales Org Chart
 graphicGTM Org Wheel
 graphicSeries A Sales Org Chart
 graphicSeries B Sales Org Chart
 graphicRevOps Team Structure
 graphic5 Stages of a Healthy Pipeline — Infographic
 graphicSales Funnel — 5 Stages
 graphic“Sell things worth buying.” — LinkedIn Banner
 graphicSDR Manager — LinkedIn Banner
 graphicFractional CRO — LinkedIn Banner