


GTM Org Wheel
Quality
Certified

A GTM Org Wheel is a circular map of go-to-market functions — marketing, sales, customer success, RevOps, product — arranged around the customer rather than stacked in a reporting hierarchy. It shows where work hands off, who owns each stage, and how revenue accountability is shared, making handoff friction visible instead of political.
The outcome you should expect
The honest promise of a GTM Org Wheel is narrow: it does not create revenue, it makes the seams where revenue leaks visible. Teams that build one well typically report three concrete changes within a quarter or two.
First, handoff arguments become data arguments. Before the Wheel, the recurring meeting is "marketing sends junk leads" versus "sales doesn't work them." After the Wheel, the same meeting is about a specific, named boundary — say, "MQL → SDR accept" — with a defined trigger, a required payload of fields, and a response-time expectation. The disagreement doesn't disappear, but it becomes falsifiable. You can pull thirty records and adjudicate them.
Second, ownership gaps surface. Almost every org that draws its Wheel honestly discovers at least one stage with no owner. Common orphans: post-sale technical validation between the signed contract and the first successful implementation milestone; the renewal conversation that starts 90 days out but belongs to neither the CSM nor the AE; and competitive win-loss capture, which everyone agrees matters and nobody is measured on. Drawing the circle forces the question "whose name goes here?" for every arc.

Third, headcount arguments get anchored to stages rather than to titles. Instead of "we need three more AEs," the conversation becomes "the evaluation stage is the bottleneck — is that an AE problem, a solutions-consultant problem, or a content problem?" That reframing routinely changes the hiring answer.
What you should *not* expect: a Wheel does not fix misaligned compensation, it does not substitute for a functioning CRM data model, and it does not survive contact with a reorg unless someone owns maintaining it. Treat it as a living operating document reviewed on a fixed cadence, not a slide that gets drawn once during planning season and never opened again.
A reasonable success bar for the first 90 days: every stage has a named owner, every adjacent pair has a written handoff definition, and at least one previously invisible drop-off is now instrumented in your CRM funnel report. If you can't point to those three things, the Wheel is decoration.
What drives that outcome
The Wheel works — when it works — because of four underlying mechanisms, not because circles are prettier than boxes.

Sequencing follows the buyer, not the org chart. The most common failure is drawing your existing departments around a circle and calling it a GTM Wheel. That reproduces your silos in a new shape. The correct starting point is the buyer's actual path: how they discover the category, how they evaluate options, who signs, who implements, who renews. Map five to seven buyer-side stages first, then assign internal ownership to each. If your ideal customer profile needs heavy education before they'll take a demo, that education stage is a real arc on the Wheel — usually staffed by technical marketers or solutions consultants — and pretending it belongs to "SDR outreach" is why the SDR conversion rate looks broken.
Explicit handoff contracts replace implicit assumptions. For each adjacent pair of arcs, three things must be written down: the trigger (what event moves a record forward), the payload (what data must travel with it — source, persona, intent signals, discovery notes), and the service level (how fast the receiving team must act). Unwritten handoffs default to whoever complains loudest.
Feedback arcs, not just forward flow. A one-way clockwise Wheel is a conveyor belt with a nicer logo. The versions that change behavior include reverse arrows: onboarding friction routed back to product, objection patterns routed back to marketing messaging, expansion triggers routed back to sales. The simplest mechanism is a standing monthly review where each arc names one thing it needs from the arc before it and one thing it will improve for the arc after it.

Shared metrics across arcs, not private metrics within them. If marketing is measured on MQL volume and sales on closed-won, the boundary between them is a place to dump risk. Metrics that span the boundary — pipeline that survives to a qualified stage, net revenue retention shared between CS and sales — remove the incentive to hand off garbage.
Benchmarks and realistic ranges
Numbers here should be treated as design targets you calibrate against your own baseline, not industry law. The useful discipline is measuring the same three things consistently.
Arc count. Practical Wheels run four to nine arcs. Below four, you've drawn a funnel and gained nothing. Above nine, no one remembers the model and the handoff contracts stop being maintained. Early-stage companies typically live at four to five arcs (awareness, evaluation, purchase, onboarding, expansion). Enterprise motions with procurement, security review, and formal implementation phases justify seven to nine. If you find yourself at eleven, you're describing a process map, not an org model — build both, but don't confuse them.
Time-in-arc. Track the median, not the mean, since a handful of stalled deals will wreck the average. The signal you want is the ratio of median time-in-arc to your target. Anything running two to three times target is where you focus. A common pattern: the evaluation arc balloons because technical validation has no dedicated owner, and AEs are improvising security questionnaires between calls.

Waste rate per arc. The share of records that enter an arc and exit without progressing — gone dark, disqualified late, or recycled. Every arc has a nonzero waste rate and that's fine; what matters is whether one arc is dramatically worse than its neighbors and whether the rate is trending. Late-stage waste is far more expensive than early-stage waste, because it consumed solution-consulting and legal time.
Handoff acceptance rate. Of records passed across a boundary, the share the receiving arc accepts. If marketing passes 100 and sales works 60, that's a 60% acceptance rate and a concrete agenda item. The fix is usually one of three things: the qualification criteria are stale, the payload is missing a field the receiving team needs to prioritize, or the receiving team lacks capacity and is silently rationing. Diagnose before you change scoring models.
Review cadence. Monthly for handoff metrics, quarterly for Wheel structure, and immediately after any material change — a funding round, a new product line, a pricing model change, or a headcount jump large enough to change span of control. Re-drawing the Wheel more often than quarterly usually signals that the arcs were defined around people rather than stages.
Instrumentation reality check. Most of these measurements require stage-stamped timestamps in your CRM and a consistent definition of "accepted." If your CRM doesn't record when a record entered and left each stage, that's your first project — everything else is guesswork dressed up as a dashboard.
Risks, edge cases, and failure modes

The template trap. Copying a well-known company's Wheel imports their ACV, sales cycle, and buying committee alongside their diagram. A self-serve motion with a sub-$2K annual contract has no business running a nine-arc enterprise Wheel with a dedicated procurement stage, and an enterprise security vendor with a nine-month cycle will not survive a four-arc flywheel. Match the archetype to your economics: product-led motions concentrate weight in acquisition, activation, and monetization arcs with sales as a small escalation path; high-touch enterprise motions need distinct arcs for executive engagement, technical validation, and legal or security review; partner-led motions reorganize arcs around partner recruitment, enablement, and co-sell rather than around buyer stages; hybrid motions run an inner self-serve loop and an outer assisted loop with an explicit routing rule between them.
Routing ambiguity in hybrid models. The hybrid archetype fails most often at the boundary between self-serve and sales-assisted. If the escalation rule is vague ("when an account looks strategic"), reps cherry-pick and self-serve customers get pestered. The rule must be mechanical and behavioral — seat count, usage threshold, repeated pricing-page visits, an inbound contact request — and it must be reversible, since accounts that get escalated and don't convert need a defined path back.

The Wheel as political cover. When a Wheel is drawn during a reorg, arcs get sized to justify headcount and titles rather than to reflect buyer reality. The tell is arcs named after teams ("the Enterprise AE arc") rather than after stages. If leadership can't accept an arc that spans two departments, the exercise is org-chart theater.
Owner-in-name-only. Assigning an owner who has no authority over the resources in that arc produces accountability without leverage. If the onboarding arc is owned by CS but staffed by a services team reporting to the CTO, write that down explicitly and define the escalation path, or move the ownership.
Over-instrumentation. Building fifteen dashboards before fixing one handoff is a familiar avoidance pattern. Instrument the two boundaries you already suspect are broken, fix them, then expand.
Partner-led quality control. In ecosystem models, arcs you don't staff are arcs you can't directly observe. Deal registration data lags, partner-sourced discovery notes are thin, and you learn about a bad implementation from a churn notice. Compensate with mandatory registration fields, joint account reviews, and a direct-touch trigger for accounts above a revenue threshold.
Reorg decay. The Wheel silently rots when people change roles and no one updates the owner names. Assign a single maintainer — usually RevOps — and treat an unmaintained Wheel as worse than none, because people act on a map that no longer matches the terrain.
A practical rollout plan

A workable rollout runs about six weeks of part-time effort. Compressing it below three weeks usually means skipping the interviews, and the arcs end up reflecting whoever was in the room.
Week one — map the buyer. Interview six to ten recent buyers or, failing that, the reps and CSMs closest to them. Reconstruct the actual path from first exposure to renewal, including the steps you don't control: internal budget approval, security review, the champion selling internally. Write it as five to seven stages in the buyer's language.
Week two — draw the arcs and name owners. Translate buyer stages into arcs. One named human owns each arc — not a team, a person. Where an arc spans functions, name a single accountable owner and list the contributing functions beneath. Expect one or two arcs to have no obvious owner; that discovery is the highest-value output of the week.
Week three — write the handoff contracts. For each boundary, document the trigger event, the required data payload, the response-time expectation, and the rejection path (what happens when the receiving arc declines a record, and where it goes). Keep each contract to a short page. Get both owners to sign off in writing.
Week four — instrument. Add or verify stage-entry and stage-exit timestamps in the CRM, plus an explicit accept/reject field at each handoff. Build one funnel report showing volume, median time-in-arc, and acceptance rate per boundary. Resist building more than one report.

Week five — run a baseline and pick one fix. Pull four to eight weeks of historical data. Identify the single worst boundary by acceptance rate or the single worst arc by time-in-arc. Choose one intervention: rewrite the qualification criteria, add a required field, add a mandatory qualification call, or reassign ownership.
Week six — establish the cadence. Schedule the monthly Wheel review with a fixed agenda: metrics per arc, one ask from the arc before you, one commitment to the arc after you, and one decision. Put the quarterly structural review on the calendar too, and name the maintainer.
Related questions
Does a GTM Org Wheel replace the org chart?
No. The org chart shows reporting lines and compensation authority; the Wheel shows how work and revenue accountability flow between functions. Keep both. When they conflict — an arc owner with no authority over the people doing the work — that conflict is itself the finding worth escalating.
How many arcs should a Wheel have?
Four to nine. Early-stage companies usually need four or five; enterprise motions with procurement and implementation phases justify seven to nine. Past nine, handoff contracts stop being maintained and people stop remembering the model. Split an arc only when its two halves have genuinely different owners.
Who should own the Wheel itself?

RevOps, or whoever owns CRM data definitions. The Wheel depends on stage timestamps and accept/reject fields staying consistent, and that's an operations discipline. A marketing or sales leader owning it tends to bias arc definitions toward their own function's view of the funnel.
What if we're too small for this?
Under roughly ten GTM people, a four-arc Wheel on a whiteboard with named owners is enough. Skip the instrumentation phase and keep the handoff contracts to a few lines each. The value at small scale is catching orphaned stages, not measuring velocity.
FAQ
What exactly is a GTM Org Wheel?
It's a circular framework that arranges go-to-market functions — demand generation, sales development, closing, onboarding, retention, expansion, plus the RevOps layer underneath — around the customer at the center. Unlike a hierarchy diagram, it emphasizes adjacency and handoff: each arc's output is the next arc's input, and the boundaries between arcs are where the model does its real work.
Who benefits most from building one?
Founders and revenue leaders at companies scaling past the point where everyone can hear every conversation — typically once the GTM team passes fifteen to twenty people, or when a second product line or segment is introduced. Below that scale, coordination happens informally. Above it, undocumented handoffs start dropping records.
Can this work for B2C or product-led companies?

Yes, with different weighting. Product-led and consumer motions concentrate the Wheel in acquisition, activation, and monetization arcs, with product analytics rather than a sales team acting as the connective tissue. The handoff-contract discipline still applies — it just governs automated triggers and lifecycle messaging instead of human handoffs.
How do we start if our CRM data is a mess?
Start with the arcs and owners anyway, on paper. The mapping and ownership work costs nothing and surfaces orphaned stages immediately. Then use the Wheel to scope the CRM cleanup: you only need stage timestamps and accept/reject fields for the boundaries you actually intend to measure first, which is usually two of them.
How is this different from a customer journey map?
A journey map describes the buyer's experience; the Wheel assigns internal ownership and handoff rules to that experience. The journey map is the input — you build it first — and the Wheel is what you overlay on top to answer "whose job is this, and what has to travel with the record?"
How often should the Wheel change?
Metrics reviewed monthly, structure reviewed quarterly, and an immediate re-draw after any event that changes the motion: a new segment, a pricing model change, a material funding round, or a reorg. If structure is changing more often than quarterly, the arcs were probably drawn around individuals rather than around stages.
Sources
- https://www.gartner.com/en/sales — Gartner research on sales and go-to-market organizational structures
- https://hbr.org/topic/subject/sales — Harvard Business Review coverage of sales strategy and organizational design
- https://www.mckinsey.com/capabilities/growth-marketing-and-sales/our-insights — McKinsey insights on commercial excellence and GTM models
- https://www.forrester.com/blogs/category/b2b-marketing/ — Forrester analysis of B2B GTM planning and revenue operations
- https://www.salesforce.com/resources/ — Salesforce resources on sales alignment, CRM process, and funnel definitions
- https://www.saastr.com/ — SaaStr community content on SaaS go-to-market structures and scaling
- https://www.hubspot.com/resources — HubSpot resources on lifecycle stages, lead handoff, and marketing-sales SLAs
- https://openviewpartners.com/blog/ — OpenView writing on product-led growth motions and hybrid sales models
Related on PULSE
This page will be disappearing soon. Save it to your device for $1 — or read it free while it is here.
@Kory-White- · if Venmo asks, the last 4 of my number are 2012
This page is gone.
This one is off the shelf now. $1 keeps it on your phone for good — the whole page, pictures and diagrams included.
 graphicSeries A Sales Org Chart
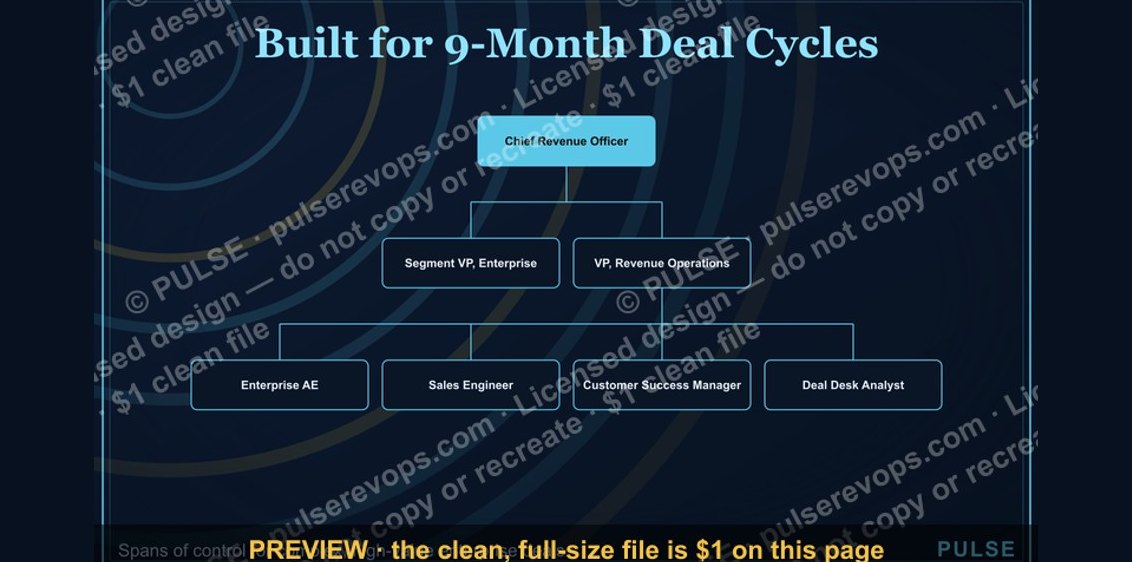 graphicEnterprise Sales Org Chart
 graphicRevOps Team Structure
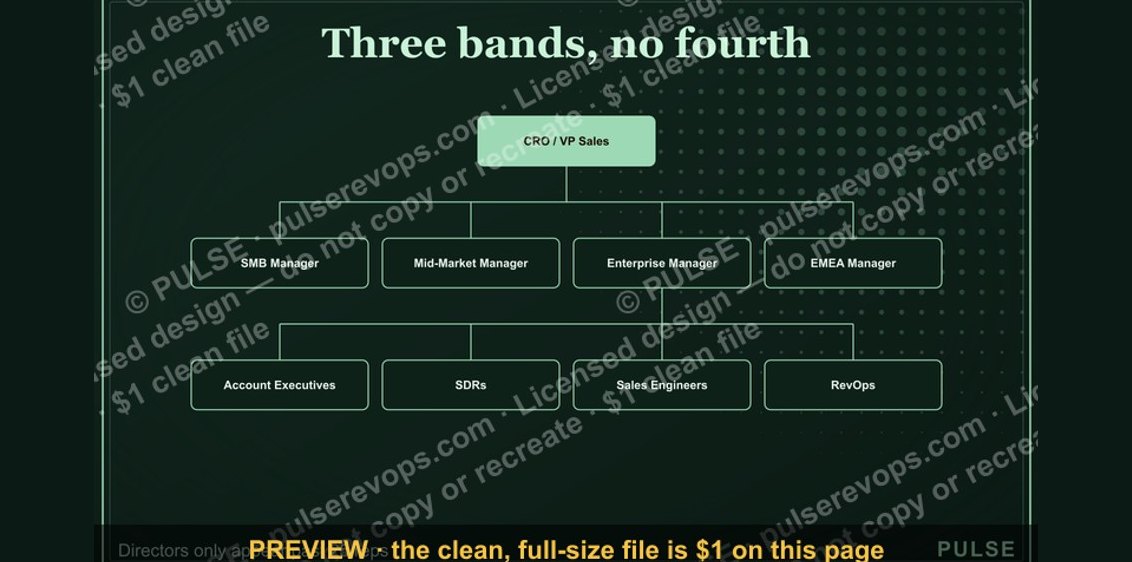 graphicSeries B Sales Org Chart
 graphicPLG Sales Overlay Org Chart
 graphic“Don't pitch. Diagnose.” — Quote Card
 graphicLead Routing Logic Diagram
 graphic“SHOULD DO IT” — Sales Meme
 graphicSDR Manager — LinkedIn Banner
 graphicThe Customer Journey — Infographic