


SaaS KPI Dashboard — Core 6

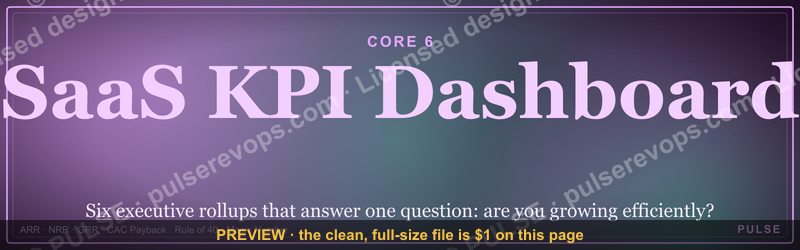
A leadership-grade SaaS KPI dashboard tracks the Core 6: Annual Recurring Revenue (ARR) growth, Net Revenue Retention (NRR), Gross Revenue Retention (GRR), CAC Payback period, the Rule of 40, and the Magic Number. Together they answer one question — *are you growing efficiently?* ARR growth shows the top line; NRR and GRR show whether you keep and expand what you've already won; CAC Payback and the Magic Number show how hard your acquisition dollars work; and the Rule of 40 balances growth against profitability so you can't buy growth by burning cash.
These six are deliberately *executive rollups*, not raw inputs. Operational metrics like MRR, logo churn, and LTV still matter — they feed the Core 6 — but they live on a secondary ops view. Common healthy markers for the Core 6: NRR above 110%, GRR above 90%, CAC payback under 18 months, Rule of 40 at or above 40%, and a Magic Number above 0.75. If all six are green, you're scaling sustainably; if growth is strong but the Rule of 40 and Magic Number are red, you're growing on borrowed time.
SaaS KPI Dashboard — Core 6

Dashboard banner with 6 KPI tiles: ARR, NRR, GRR, CAC Payback, Rule of 40, and Magic Number, shown with placeholder values.
Format: SVG (scalable vector) · Size: 1584×396 px · Category: Dashboard · License: Free to use — no attribution required.
How the Core 6 connect
The Core 6 aren't six independent gauges — they form a causal chain from growth to efficiency. ARR growth is fed by retention (NRR and GRR), and that growth is only "good" if it clears the Rule of 40 and the Magic Number.
A weekly read on the dashboard
Pull the Core 6 on the same cadence and let two questions route your decision: are you clearing the Rule of 40, and is each acquisition dollar paying back fast enough?
Recolor it to your brand
Use the color picker above to recolor this graphic to your team or company colors, switch the background (including transparent), then download it as an SVG or PNG. No sign-up, no watermark.
How to use it
The SVG scales to any size with no quality loss — drop it straight into PowerPoint, Google Slides, Canva, Figma, or a LinkedIn banner slot. The PNG export is ready to upload anywhere that wants a raster image.

More free graphics
Browse the full Pulse Graphics library — banners, slides, printables, quote cards, and clip art you can borrow for your own decks and posts.
Related on PULSE
- Lead Routing Logic Diagram
- Hire Decision Framework
- Renewal Risk Decision Tree
- Pricing Discount Decision Tree
- Touchpoint Timeline
Why These Six — and Not MRR, Churn, and LTV
Most founders start with twenty metrics and drown in noise. The Core 6 stay tight on purpose, and the question we get most is: *where are MRR, churn, and LTV?* The answer is that those are inputs, and the Core 6 are the rollups that summarize them for a board or leadership standup.
- ARR growth is MRR × 12, expressed as a growth rate so it stays meaningful as your base scales.
- NRR and GRR are the precise way to express "churn." GRR captures pure retention (it caps at 100%); NRR layers expansion on top (it can exceed 100%). Reporting both tells you whether a healthy NRR is real or is masking a leaky base.
- CAC Payback is the operator-friendly cousin of LTV:CAC. It answers "how many months until this customer pays back what I spent to win them?" — a number you can act on, where a raw LTV:CAC ratio relies on a churn assumption you may not trust yet.
- Rule of 40 and Magic Number have no granular equivalent. They exist only at the dashboard level, which is exactly why they belong here: they keep growth honest about cost.
If a metric requires six months of product work to move, it's a strategic objective, not an operational KPI. The Core 6 are designed to be reviewed weekly or monthly and acted on inside a quarter.
Healthy Ranges by Stage
A dashboard without targets is just data art. These are honest ranges, not aspirational VC headlines — drawn from public SaaS benchmark surveys (Bessemer, KeyBanc/Pacific Crest, OpenView, SaaS Capital).
ARR growth. Below $1M ARR, doubling or tripling year over year is common because the base is small. At $1M–$10M, ~100% year-over-year growth is strong. Above $10M, growth naturally decays — 50–80% is excellent, and sustained 40%+ at scale is rare and valuable. Set targets as a rate, never a dollar figure.
Net Revenue Retention (NRR). Industry average sits around 100–110%; top-quartile B2B companies reach 120%+. Below 100% means you shrink even while adding logos. For usage-based or B2C models, 100–105% is acceptable because expansion is harder to engineer.
Gross Revenue Retention (GRR). This is your retention floor — expansion can't rescue it. SMB-focused SaaS often lives at 80–85%; mid-market at 85–90%; enterprise is expected to clear 90%. A wide gap between NRR and GRR signals you're papering over churn with a few expanding accounts.
CAC Payback. SMB (low ACV) should recover CAC in under 12 months. Mid-market under 18 months is strong. Enterprise under 24 months is healthy, and longer is common with multi-year contracts. If payback runs past these, you're burning cash faster than you recoup it.
Rule of 40. Add your growth rate to your profit margin (free-cash-flow or EBITDA margin). The sum should be at or above 40. A company growing 60% while burning -20% margin clears it; so does one growing 20% at +20% margin. Below 40 means growth and profitability together aren't pulling their weight.
Magic Number. Net new ARR in a period divided by the prior period's sales-and-marketing spend. Below 0.5, reassess your go-to-market before adding spend. Between 0.5 and 0.75 is workable. Above 0.75 is efficient enough to lean in; above 1.0 is excellent and usually means you're under-investing in growth.
Don't copy benchmarks blindly. Calculate your own trailing three-month average for each metric, set a target 20–30% better than today, and re-raise the bar each quarter you hit it.
Common Dashboard Mistakes That Skew Your Core 6
Even with the right six metrics, implementation details can ruin the data.
Mistake #1 — Including one-time fees in ARR. Implementation, setup, and professional-services revenue is not recurring and must never count toward ARR. It inflates growth temporarily and creates a false sense of health. Track non-recurring revenue on a separate line.
Mistake #2 — Reporting NRR without GRR. NRR alone hides churn behind expansion. A 115% NRR can sit on top of an 80% GRR, meaning your base is leaking badly and a handful of expanding accounts are masking it. Always show the pair.
Mistake #3 — Measuring monthly when contracts are annual. If most customers are on annual plans, monthly churn is near zero for eleven months, then spikes on renewal month. Track retention on an annual cohort basis so the dashboard reflects reality instead of a calendar artifact.
Mistake #4 — Not segmenting by customer tier. A $50/month customer and a $5,000/month customer behave nothing alike. Blend them and your retention is dominated by small logos while your NRR is dominated by large ones. Segment the Core 6 by at least two tiers and you'll usually find very different action items.
Mistake #5 — Updating metrics at different cadences. If ARR refreshes daily but retention refreshes monthly, the dashboard shows conflicting signals. Standardize: update all six on the same day each week, and use trailing-30-day figures for the monthly metrics so nothing goes stale mid-view.
Mistake #6 — Ignoring data freshness. If billing updates in real time but your CRM syncs every 24 hours, your retention numbers will always lag billing reality by a day. Pin every Core 6 metric to the same as-of timestamp and reconcile billing against the CRM before you trust the dashboard — a number that's silently a day behind is worse than no number at all.
Sources
- Bessemer Venture Partners — *State of the Cloud* and the canonical definitions and benchmarks for the Rule of 40 and Magic Number.
- KeyBanc Capital Markets (formerly Pacific Crest) SaaS Survey — annual private-SaaS benchmarks for CAC payback, Magic Number, and growth efficiency.
- OpenView — research on expansion revenue, net revenue retention, and growth benchmarks by stage.
- SaaS Capital — benchmark data on retention, ARR growth, and the relationship between growth and efficiency.
- ChartMogul — analytics documentation defining ARR, NRR, GRR, and dashboard best practices.
- ProfitWell (by Paddle) — research and guides on retention, churn, and subscription unit economics.
- Gartner — industry reporting on SaaS performance indicators and subscription business models.
FAQ
What are the "Core 6" SaaS KPIs? ARR growth, Net Revenue Retention (NRR), Gross Revenue Retention (GRR), CAC Payback period, the Rule of 40, and the Magic Number. These are the executive-level rollups that summarize growth, retention, and efficiency on a single screen — the operational inputs (MRR, logo churn, LTV) feed into them on a secondary view.
Why not MRR, churn, and LTV instead? Those are inputs, and the Core 6 are the summaries leadership acts on. ARR is MRR annualized; NRR and GRR are the precise expression of "churn" plus expansion; and CAC Payback is the operator-friendly version of LTV:CAC. The Rule of 40 and Magic Number have no granular equivalent — they exist only to keep growth honest about cost.
What's a healthy Rule of 40? Add your growth rate to your profit margin (free-cash-flow or EBITDA). The sum should be at or above 40. A company growing 60% at -20% margin clears it, and so does one growing 20% at +20% margin — the point is that growth and profitability together carry the weight, so you can't buy growth purely by burning cash.
What's a good Magic Number? Magic Number = net new ARR ÷ prior-period sales-and-marketing spend. Above 0.75 is efficient enough to lean into spend; above 1.0 is excellent and often signals you're under-investing in growth. Between 0.5 and 0.75 is workable, and below 0.5 is a sign to fix go-to-market before adding budget.
What's the difference between NRR and GRR? Gross Revenue Retention measures only what you keep and caps at 100% — it's your retention floor. Net Revenue Retention adds expansion revenue on top, so it can exceed 100%. Watching both together tells you whether a strong NRR is genuine health or a few expanding accounts masking a leaky base.
What CAC Payback should I target? Under 12 months for SMB/low-ACV products, under 18 months for mid-market, and under 24 months for enterprise (where multi-year contracts make longer paybacks acceptable). If payback runs well past these ranges, you're spending cash faster than you can recoup it and should tighten acquisition efficiency before scaling spend.
This page will be disappearing soon. Save it to your device for $1 — or read it free while it is here.
@Kory-White- · if Venmo asks, the last 4 of my number are 2012
This page is gone.
This one is off the shelf now. $1 keeps it on your phone for good — the whole page, pictures and diagrams included.
 graphicSales KPI Dashboard — Top 9 in 2027
 graphicForecast Accuracy Trend
 graphicMarketing KPI Dashboard
 graphicPipeline Health Dashboard
 graphicCustomer Success KPI Dashboard
 graphic“Sell the problem, not the product.” — LinkedIn Banner
 graphicThe Ask — Section Divider Slide
 graphicPharmaceutical CRO — LinkedIn Banner
 graphicForecast Commit / Best Case / Upside
 graphicAgenda — Section Divider Slide