


Marketing KPI Dashboard
Quality
Certified

A marketing KPI dashboard is a single consolidated view of the metrics that connect marketing spend to revenue — pipeline sourced, MQL-to-SQL rate, CAC by channel, and ROAS — refreshed automatically from analytics, CRM, and ad platforms. The good ones hold eight to twelve indicators, show period-over-period movement, and drive budget decisions rather than decorate a status meeting.
The two builds you are actually choosing between
Every marketing team that sets out to build a dashboard is really picking between two architectures, and most of the pain downstream comes from picking one without knowing that a choice was being made.
Option A — the platform-native dashboard. You stay inside a tool you already own. HubSpot's reporting, Salesforce dashboards, Google Analytics 4 explorations, Looker Studio wired to native connectors. Data lives where it was created. You build with drag-and-drop, you ship in an afternoon, and nobody has to learn SQL. The trade is that your dashboard can only see what that platform sees. A HubSpot dashboard knows everything about form fills and email engagement and almost nothing about the LinkedIn spend that produced them, unless you manually stitch cost data in. A GA4 dashboard knows sessions and conversions but has no idea which of those became a closed-won deal at $48,000.
Option B — the warehouse-backed dashboard. You pipe every source into a central store — BigQuery, Snowflake, Redshift, or Postgres — normalize it, and build the view on top with Looker Studio, Tableau, Power BI, Metabase, or Hex. Ad spend, CRM records, product usage, and web analytics land in the same place with a shared date spine and a shared account key. Now "CAC by channel including sales headcount cost" is a query rather than a spreadsheet exercise. The trade is real: you need someone who can model data, a pipeline that does not silently break, and a tolerance for a build measured in weeks.

The honest framing is that Option A is not a lesser version of Option B. It is a different bet about where your bottleneck sits. If your bottleneck is *nobody looks at the numbers*, a native dashboard shipped Friday beats a warehouse shipped in Q3. If your bottleneck is *we cannot agree what a lead costs*, no amount of native dashboard polish fixes it, because the disagreement is a data-model problem and native tools cannot model across sources.
There is a third path worth naming because teams fall into it by accident rather than by decision: the spreadsheet dashboard. Someone exports four CSVs on the first Monday of the month, pastes them into a workbook with a pivot table and conditional formatting, and calls it the dashboard. It is genuinely fine at very small scale — a two-person team spending under $10K/month across two channels does not need a pipeline. It stops being fine the moment the export takes more than thirty minutes, because that is the point where the dashboard silently becomes monthly-only, and monthly-only means you find out about a broken campaign twenty-two days late.
Two adjacent decisions ride along with this one and are worth surfacing early. First, who owns the refresh — marketing ops, data engineering, or an agency. Ownership determines how fast a broken connector gets fixed, and broken connectors are the single most common cause of a dashboard quietly going stale. Second, whether the dashboard is the source of truth or a view of one. If finance reports revenue from the CRM and marketing reports revenue from the dashboard and the two disagree by 6%, the dashboard loses every argument it enters. Decide upfront that the CRM is authoritative for closed revenue and the dashboard merely displays it.
How to decide between them

The decision comes down to four inputs, and you can usually settle it in a twenty-minute conversation if you ask them in order.
Input one: how many paid channels carry meaningful spend? One or two channels means native reporting plus a monthly spend reconciliation is sufficient. Four or more channels — search, paid social, programmatic, sponsorships, events, affiliate — and the manual stitching cost crosses the threshold where a pipeline pays for itself. The rough breakpoint most teams hit is around three channels or roughly $30–50K/month in spend, because below that the analyst hours saved do not cover the tooling and maintenance cost.
Input two: how long is the sales cycle? A 14-day self-serve cycle means last-touch attribution is approximately correct and a native dashboard will not lie to you much. A 9-month enterprise cycle with eleven touchpoints across four people at the account means last-touch is actively misleading, and you need account-level joins that native tools generally cannot do. Long cycles push hard toward the warehouse.

Input three: does anyone on the team write SQL? Not "could we hire someone" — does someone, today, own a query they wrote. If the answer is no, a warehouse dashboard becomes an expensive dependency on a contractor who is not around when it breaks at 8am before a board meeting.
Input four: what decision is the dashboard supposed to change? This is the one people skip. Write the sentence out: "This dashboard exists so that we can shift budget between channels within a month instead of within a quarter." If you cannot write that sentence, you are building a report, and a report can be a Monday email.
A useful tiebreaker when the inputs conflict: build the native version first regardless of where you expect to land. It costs a few days, it forces every stakeholder to argue about metric definitions while the stakes are low, and it produces a concrete artifact you can point at when scoping the warehouse version. Teams that skip straight to the warehouse routinely spend six weeks building a beautiful pipeline for KPI definitions that get thrown out in the first review.
The reverse move — starting with a warehouse because "we'll need it eventually" — is defensible only when you already have the warehouse for another reason. Standing up Snowflake purely to make a marketing dashboard is the tail wagging the dog. If finance, product analytics, and support are all queuing for the same infrastructure, the marketing dashboard is a rider on a project that justifies itself independently, and that changes the math entirely.
The numbers behind each option, and the numbers on the dashboard

Two separate sets of numbers matter here: what each build actually costs you, and what belongs on the finished surface.
Cost and effort, honestly stated. A native dashboard in a tool you already pay for costs no incremental license and roughly two to five working days of a marketing ops person's time for the first version, plus a few hours a month to maintain. A connector-assisted build — native BI tool plus a managed ETL service pulling ad platform cost data — adds a subscription in the low hundreds per month at typical mid-market volumes, and pushes the build to one to two weeks. A warehouse-backed build adds warehouse compute and storage, an ETL tool, and typically four to eight weeks of build time with a data-capable owner. None of these numbers are the point. The point is the *ratio*: if the dashboard is meant to help you reallocate a $40K monthly budget more effectively, a build that costs a few thousand dollars amortized and saves 5% of misallocated spend pays back in months. If you are managing $4K/month in spend, it does not, and a spreadsheet is the correct answer.
What goes on the surface. Eight to twelve KPIs, no more. Fifty metrics is a data dump. A layout that works across both build types:
*Row one — the revenue line.* Pipeline sourced by marketing (dollar value of opportunities where marketing is the originating source), revenue attributed, CAC blended, and ROAS. Each with a period-over-period delta and an arrow. This is the row an executive reads in ten seconds.
*Row two — the funnel.* MQL volume, MQL-to-SQL conversion rate, SQL-to-opportunity rate, opportunity-to-closed-won rate, and cost per lead. Segment these by channel wherever the data supports it. This row tells you *where* the problem is when row one moves the wrong way.

*Row three — the leading indicators and the spend table.* Organic sessions trend, email engagement trend, and a budget-versus-actual table by channel with columns for Budget, Actual, Variance, and ROAS. Leading indicators matter because revenue is a lagging indicator that tells you about decisions made a quarter ago. If organic sessions have dropped 18% over six weeks, you can act now; if you wait for the revenue number to reflect it, you are acting in November on a July problem.
Benchmarks, with the appropriate caveat. Conversion rates and cost figures vary so widely by industry, offer, and audience that published benchmarks are close to useless as targets. The number that matters is your own trailing twelve months. Set your thresholds off your own median, not an industry average — for example, alert when CPL rises more than 25% above your trailing-90-day median, or when MQL volume drops more than 30% week-over-week. Those thresholds are self-calibrating and do not require you to trust anyone else's data.
Segment before you average. A blended CAC of a single number hides the entire story. If one channel produces cheap leads that never close and another produces expensive leads that close at 40%, the blended figure is an average of two things that should never have been averaged. Show CAC by channel and, where volume permits, by segment. Where distributions are skewed — deal size almost always is — show the median alongside the mean, or the numbers will consistently mislead you upward.
A worked example of what this catches. A team with a monthly-refresh dashboard and forty-seven metrics could not find CAC without scrolling. After cutting to ten KPIs and moving ad-spend refresh to daily, a sharp drop in MQL-to-SQL conversion became visible within a week rather than a quarter. The cause was a lead-scoring threshold that had been changed and never communicated. The lesson generalizes: the value of a dashboard is not in the metrics it displays but in the *latency* between a problem occurring and someone noticing it.
Building it and sequencing the work

The sequence matters more than the tool. Teams that build in the wrong order end up rebuilding.
Step one: write the definitions before you build anything. Get marketing and sales in a room and define, in writing, what an MQL is, what an SQL is, what "marketing sourced" means versus "marketing influenced," and who owns the handoff. Put it in a shared document and treat it as a service-level agreement with a quarterly review date. Skipping this is the single most reliable way to build a dashboard nobody trusts, because the first time sales says "those aren't real leads," the dashboard stops being evidence and becomes a position in an argument.
Step two: fix naming and tracking hygiene. Standardize UTM conventions and enforce them — a fixed pattern like 2026_Q3_brand_googleads beats free-text every time, because free-text produces Google Ads, google-ads, GoogleAds, and googleads as four separate rows in every report you ever build. Deduplicate CRM records. Confirm that every paid campaign actually carries tracking parameters. This step is unglamorous and it is the difference between a dashboard and a fiction.

Step three: build the smallest useful version. Row one only — four to six revenue-connected KPIs. Ship it, put it in front of the people who will use it, and let them tell you what is missing. Their answer will be different from what you predicted.
Step four: add funnel segmentation and channel breakdowns. Only now, once row one is trusted, add the diagnostic layer.
Step five: automate the refresh and add alerts. Set refresh cadence per metric volatility — ad spend daily, lead volume daily or weekly, revenue attribution weekly or monthly. A dashboard refreshed manually will be refreshed less often each month until it is refreshed never. Route threshold alerts to Slack or email so the dashboard pushes to people instead of waiting for them.
Step six: annotate and iterate. Add event annotations — campaign launches, pricing changes, site migrations, seasonal dips — directly on the trend charts. An unexplained 30% traffic drop generates a week of panic; an annotated one that reads "site migration, 6/14" generates a shrug. Review quarterly: what got added, what should be cut, what nobody has looked at in ninety days.
Two adjacent surfaces worth building next. Once the Marketing dashboard is stable, the same plumbing supports a pipeline health view — stage-by-stage aging, velocity, and coverage ratio — that sales leadership will care about more than any marketing metric, and a customer success view tracking retention and expansion. These share the same account keys and the same date spine. Building the marketing dashboard well makes both nearly free; building it as a one-off silo makes both start from zero.

Design details that decide whether it gets used. Different audiences need different views: a CMO wants row one and channel ROAS; a campaign manager wants CPC and CTR by ad set. Build separate views or enable drill-down rather than one dashboard that serves nobody well. Test it on a phone, because it will be opened on a phone during a meeting. Never encode status in red-and-green alone — add icons or text labels so colorblind viewers get the same information. And put a plain-language "what this means" note beside anything non-obvious; a number without an interpretation is a report, and a report is not a decision tool.
Related questions
How many KPIs should a marketing dashboard show?
Eight to twelve for the main view. Fewer than six and you lose diagnostic power; more than fifteen and readers stop scanning. Push everything else into drill-down views or a separate analyst-facing dashboard rather than deleting it outright.
Should the dashboard use last-touch or multi-touch attribution?
Last-touch is acceptable for short self-serve cycles. For multi-month B2B cycles, use a rule-based multi-touch split — first touch, last touch, and middle touches weighted — and state the model on the dashboard itself so nobody misreads the numbers.
How often should the data refresh?
Match cadence to volatility: paid spend and lead volume daily, revenue attribution weekly or monthly. A 24-hour lag is usually preferable to true real-time, which introduces noise and encourages overreacting to single-day swings.
Who should own the marketing dashboard?

Marketing operations, with a named backup. Ownership means someone is accountable when a connector breaks. Agency-owned dashboards create a dependency that becomes painful precisely when the agency relationship ends.
What is the difference between marketing-sourced and marketing-influenced revenue?
Sourced means marketing created the original opportunity. Influenced means marketing touched a deal that sales or partners originated. Report both — sourced alone undercounts contribution, influenced alone overstates it.
FAQ
What is a marketing KPI dashboard?
A single consolidated view of the marketing metrics that connect activity to revenue — traffic, conversion rates, cost per acquisition, pipeline sourced, and return on ad spend — pulled automatically from analytics, CRM, and ad platforms. It replaces the practice of assembling four separate reports to answer one question, and its real value is reducing the delay between a problem occurring and someone noticing.
Which metrics belong on it and which do not?
Include anything that would change a budget or campaign decision: pipeline sourced, CAC by channel, MQL-to-SQL rate, ROAS, cost per lead. Leave off metrics that only move sideways — raw pageviews, social follower counts, email sends — unless you can name the decision they inform. The test is simple: if a number moves 20% and nobody does anything differently, it does not belong on the main view.

Do I need a data warehouse to build one?
Not initially. With one or two paid channels and a short sales cycle, native reporting inside your CRM or analytics tool is sufficient and ships in days. A warehouse earns its keep once you have three or more channels, a long sales cycle requiring account-level joins, and someone on the team who can maintain the pipeline.
Why do my dashboard numbers disagree with the CRM?
Almost always attribution window, deduplication, or timezone. Analytics tools attribute a conversion to the session that started it; CRMs attribute to the record's created date. Decide which system is authoritative for closed revenue — normally the CRM — and configure the dashboard to display that figure rather than recomputing it.
How do I stop the dashboard from going stale?
Automate the refresh, then put a visible "last updated" timestamp on the surface. Manual refresh decays predictably: weekly becomes monthly becomes never. The timestamp matters because a stale dashboard that looks current is worse than no dashboard — it produces confident decisions on old data.
Should I set targets from industry benchmarks?
Use your own trailing twelve months instead. Published benchmarks blend industries, offers, and audiences that have nothing to do with yours. Set alert thresholds relative to your own median — for instance, flag when cost per lead exceeds the trailing-90-day median by 25% — so the thresholds recalibrate as your business changes.
Sources
- https://support.google.com/analytics/ — Google Analytics Help Center, official documentation on conversion tracking, attribution models, and reporting configuration.
- https://developers.google.com/analytics/devguides/collection/ga4 — GA4 developer documentation covering event and conversion data collection.
- https://knowledge.hubspot.com/ — HubSpot Knowledge Base, guides on reporting dashboards, lifecycle stages, and lead-status definitions.
- https://help.salesforce.com/ — Salesforce Help, documentation on reports, dashboards, and campaign influence models.
- https://support.google.com/looker-studio/ — Looker Studio Help Center, official guidance on data sources, blending, and dashboard design.
- https://learn.microsoft.com/power-bi/ — Microsoft Power BI documentation on data modeling, refresh scheduling, and report layout.
- https://help.tableau.com/ — Tableau Help, dashboard design guidance and data-connection reference.
- https://www.ama.org/ — American Marketing Association, publications on marketing measurement and metric definitions.
- https://www.marketingprofs.com/ — MarketingProfs, practitioner resources on KPI selection and measurement strategy.
Related on PULSE
This page will be disappearing soon. Save it to your device for $1 — or read it free while it is here.
@Kory-White- · if Venmo asks, the last 4 of my number are 2012
This page is gone.
This one is off the shelf now. $1 keeps it on your phone for good — the whole page, pictures and diagrams included.
 graphicForecast Accuracy Trend
 graphicCustomer Success KPI Dashboard
 graphicSaaS KPI Dashboard — Core 6
 graphicPipeline Health Dashboard
 graphicSales KPI Dashboard — Top 9 in 2027
 graphicPipeline Stages — Icon / Clip Art
 graphicOutreach / Announce Icon — Icon / Clip Art
 graphic“Never give without a get.” — LinkedIn Banner
 graphic4 Forecast Categories — Infographic
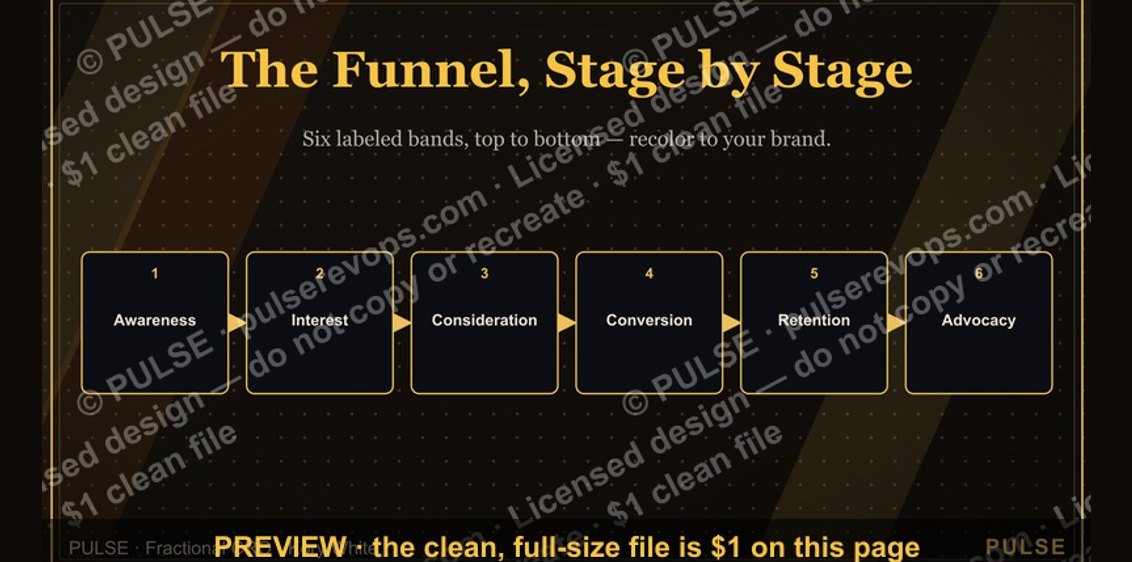 graphicThe Marketing Funnel — Infographic