


Demo Flow Diagram
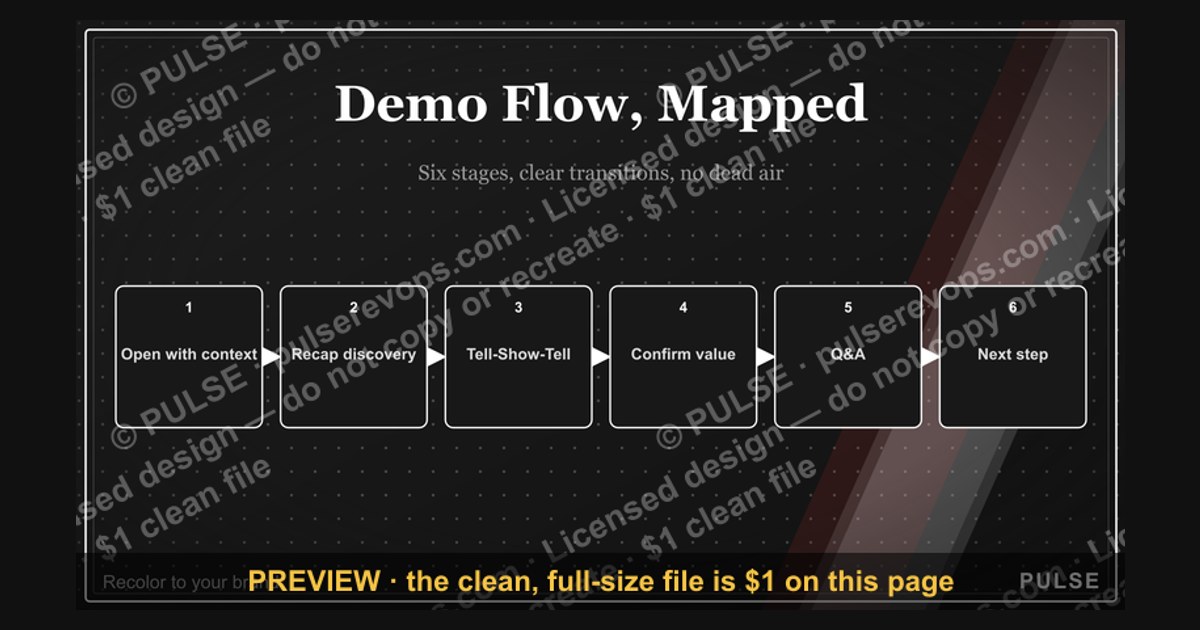
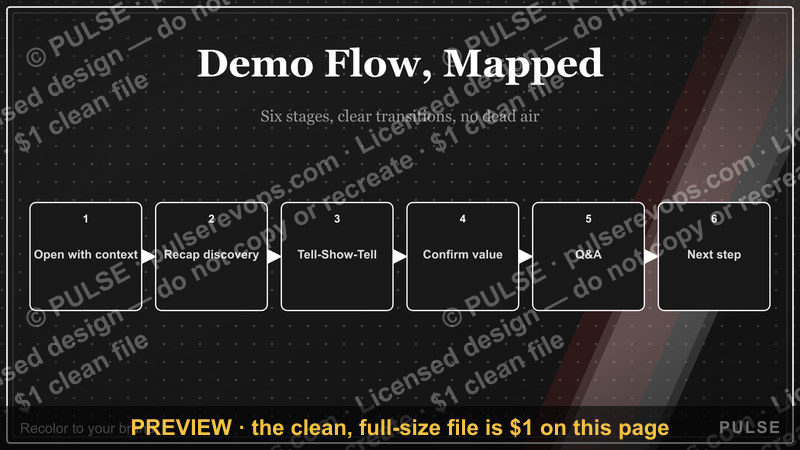
A demo flow diagram is a visual map that outlines the step-by-step sequence of a product demonstration, typically from introduction to closing. It shows the logical progression of key stages, such as setup, feature walkthrough, and Q&A, to guide a presenter. The diagram helps ensure a consistent and effective demo by clarifying transitions and timing.
Demo Flow Diagram

Demo flow: Open → Recap discovery → Tell-Show-Tell sections → Q&A → Next step.
Format: SVG (scalable vector) · Size: 1584×396 px · Category: Process · License: Free to use — no attribution required.
Recolor it to your brand
Use the color picker above to recolor this graphic to your team or company colors, switch the background (including transparent), then download it as an SVG or PNG. No sign-up, no watermark.
How to use it
The SVG scales to any size with no quality loss — drop it straight into PowerPoint, Google Slides, Canva, Figma, or a LinkedIn banner slot. The PNG export is ready to upload anywhere that wants a raster image.
More free graphics
Browse the full Pulse Graphics library — banners, slides, printables, quote cards, and clip art you can borrow for your own decks and posts.
Related on PULSE
- Discovery Call Flow Diagram
- Lead Routing Logic Diagram
- “Sell the meeting, not the demo.” — Quote Card
- The Perfect Demo — Infographic
- “Sell the meeting, not the demo.” — LinkedIn Banner
- Deal Inspection Flow
Anatomy of a Demo Flow Diagram: Key Components and Their Purpose
A well-structured demo flow diagram serves as the blueprint for your product demonstration, transforming a potentially chaotic walkthrough into a strategic, outcome-driven experience. At its core, every effective demo flow diagram contains several essential components that work together to guide both the presenter and the prospect toward a shared understanding of value.
The entry point is where every demo flow begins — typically a problem statement or a specific use case that resonates with the prospect's stated needs. This isn't a generic "welcome to our product" moment, but rather a deliberate hook that acknowledges the pain point the prospect raised during discovery. For example, if a sales team expressed frustration with manual data entry, the demo flow might start with a screen showing their current messy spreadsheet before transitioning into how your solution automates that process. This entry point should take no more than 60–90 seconds and immediately establish relevance.
Next comes the decision tree — the branching logic that determines which features to show based on prospect responses, role, or industry. A sophisticated demo flow diagram isn't linear; it anticipates multiple paths. For instance, if you're demonstrating a CRM platform, the flow might branch based on whether the prospect is a sales manager (showing pipeline views and forecasting) versus a marketing director (highlighting lead scoring and campaign attribution). Each branch should be clearly labeled with trigger conditions, such as "If prospect mentions reporting challenges → show dashboard customization module." This prevents the dreaded "demo dump" where you show everything and hope something sticks.
The value milestones section maps out 3–5 specific moments during the demo where you explicitly connect a feature to a business outcome. These are not just "show this button" points, but rather structured transitions where you pause and ask a confirmation question. For example, after demonstrating how automated email sequences save 10–15 hours per week, you might ask, "How much time does your team currently spend on manual follow-ups?" This creates a natural checkpoint where the prospect self-validates the value. Each milestone should have a corresponding success metric — a quantitative or qualitative outcome that the prospect can immediately relate to their own operations.
Finally, the exit ramp outlines how the demo concludes, including the transition to next steps. This isn't just "any questions?" — it's a structured handoff that includes a specific ask (e.g., "Based on what we've covered, would a 30-day pilot with your team make sense?"). The exit ramp should also include contingency paths for objections or delays, such as "If prospect needs budget approval → schedule follow-up with CFO." A well-designed demo flow diagram accounts for these scenarios so the presenter never feels caught off guard.
Common Pitfalls in Demo Flow Diagrams and How to Avoid Them
Even experienced sales teams fall into predictable traps when designing demo flow diagrams. Recognizing these pitfalls early can save hours of rework and prevent lost deals. The most pervasive issue is over-engineering the flow — creating diagrams so complex that they become unusable in real time. A demo flow diagram with 50+ nodes, multiple decision points per screen, and color-coded paths for every possible scenario is a liability, not an asset. Presenters can't memorize or follow such diagrams during a live demo, leading to awkward pauses, skipped sections, or visible confusion. The fix is ruthless simplification: limit decision points to no more than 3–4 per demo, and ensure the entire flow fits on a single page or screen. If you need more detail, create separate "deep dive" diagrams for specific modules or personas.
Another common mistake is building the diagram in isolation without input from actual prospects or sales reps. Product managers often design flows based on feature lists rather than real-world usage patterns. For example, a diagram might prioritize a new AI-powered analytics feature because it's technically impressive, but prospects consistently ask about basic integration capabilities. This disconnect leads to demos that feel out of touch. To avoid this, conduct 5–10 demo debrief sessions with your sales team after actual calls. Ask them which sections resonated, which fell flat, and where prospects interrupted or disengaged. Map those patterns directly onto your diagram. Additionally, record and review 3–5 actual demos (with permission) to see where the flow naturally deviates from your diagram — then update accordingly.
Ignoring the emotional journey is a subtle but costly oversight. Demo flow diagrams typically focus on logical progression (feature A → benefit B → question C), but they rarely account for the prospect's emotional state. A prospect who just sat through a 45-minute discovery call may be fatigued; one who's been burned by failed software implementations may be skeptical. Your diagram should include emotional checkpoints — moments where you gauge energy levels, address unspoken concerns, or inject humor. For instance, after demonstrating a complex configuration, you might add a note: "Pause here — ask if they've seen similar setups fail before." This turns the demo from a monologue into a collaborative exploration.
A related pitfall is failing to update the diagram as your product evolves. Many teams create a demo flow diagram during onboarding and never revisit it. Six months later, new features have been added, old ones deprecated, and the competitive market shifted — but the diagram still shows last year's workflows. Set a quarterly review cadence where you audit each node for relevance. Remove features that no longer matter to your ideal customer profile, and add new capabilities that address emerging pain points. Version control is critical here; maintain a changelog so everyone knows when and why the diagram changed.
Finally, treating the diagram as a script rather than a guide is a surefire way to kill spontaneity. The best demo flow diagrams leave room for improvisation. They include notes like "If prospect asks about security, show compliance dashboard here" or "If time is short, skip module 3 and summarize verbally." This flexibility allows the presenter to follow the prospect's lead while still maintaining structure. A good rule of thumb: your diagram should be 70% prescriptive (must-show elements) and 30% adaptive (optional paths based on cues). This balance keeps demos focused without feeling robotic.
Practical Tools and Techniques for Building Effective Demo Flow Diagrams
Creating a demo flow diagram that actually works in the field requires more than just drawing boxes and arrows. The tools you choose and the techniques you employ can dramatically impact how well the diagram translates into real-world success. Start with the right software — not every diagramming tool is suited for interactive, decision-heavy flows. Miro and Mural are excellent for collaborative whiteboarding sessions where you brainstorm paths with your sales team in real time. Their infinite canvas format lets you map out multiple branches without worrying about page limits. For more structured, presentation-ready diagrams, Lucidchart or Draw.io offer templates specifically for flowcharts and decision trees. If your team prefers something more dynamic, Whimsical allows you to add clickable links and hover-over notes, making the diagram interactive for self-paced training.
The "storyboard first, diagram second" technique is a major change. Before you draw a single box, write out the demo as a narrative — a 3–5 paragraph story that follows a character (your ideal prospect) through their journey from problem to solution. This story should include emotional beats, turning points, and a satisfying resolution. For example: "Sarah, a marketing director at a mid-size SaaS company, is drowning in manual reporting. She's tried spreadsheets, but they're error-prone and take 10 hours a week. In the demo, she sees how automated dashboards cut that to 30 minutes. She gets excited when she realizes she can export reports directly to her board deck." Once this story is solid, extract the key scenes and map them onto your diagram. This ensures the flow has narrative coherence, not just logical structure.
Role-playing your diagram is an underutilized technique that reveals gaps and confusion points. Gather 3–4 team members and have one person present the demo using the diagram while another plays the prospect with a specific persona (e.g., "budget-conscious CFO" or "tech-savvy power user"). The rest observe and take notes on where the flow breaks down — moments where the presenter hesitates, the prospect asks an unexpected question, or a decision point leads to a dead end. After the role-play, revise the diagram based on these observations. Repeat this process until the flow feels natural across at least three different prospect personas. This practice is especially valuable for new hires who need to internalize the logic before facing real prospects.
Versioning and feedback loops are essential for maintaining diagram quality over time. Use a naming convention like "DemoFlow_v2.3_2025-03-15" and store the diagram in a shared location (Google Drive, Notion, or your CRM's document repository). After each major demo cycle (quarterly or after 20+ demos), send a brief survey to your sales team asking three questions: (1) Which section of the diagram was most useful? (2) Which section did you skip or modify most often? (3) What's one thing you'd change? Aggregate the responses and update the diagram accordingly. This turns your demo flow into a living document that improves with every use.
Integrating CRM data into your diagram can make it even more powerful. For example, if your CRM shows that a prospect's company has 50–200 employees, your diagram might automatically suggest a path focused on scalability features. Some advanced teams use tools like Gong or Chorus to analyze recorded demos and identify which paths led to closed-won deals versus lost opportunities. They then overlay this data onto the diagram, highlighting high-converting paths in green and low-performing ones in red. This data-driven approach transforms the diagram from a static guide into a strategic asset that evolves with your win-loss analysis.
Finally, training your team to use the diagram effectively is just as important as the diagram itself. Schedule a 90-minute workshop where you walk through each node, explain the rationale behind decision points, and practice transitions between sections. Provide a "cheat sheet" that summarizes the diagram in one page — including key phrases to use at each milestone and common objections with pre-scripted responses. New hires should be required to present a demo using the diagram to a senior team member before they're allowed to demo to prospects. This ensures consistency without stifling individual style. Remember, the goal is not to create a rigid script but to build a shared mental model that every team member can rely on, adapt, and improve over
Sources
- International Organization for Standardization (ISO) — standards for flowchart symbols and diagram conventions
- Microsoft Corporation — official documentation for creating flow diagrams in Visio and related tools
- Lucidchart — educational resources on flow diagram design and best practices
- Harvard Business Review — articles on using process diagrams for business communication
- U.S. National Institute of Standards and Technology (NIST) — guidelines for process modeling and diagram notation
- The Open Group — specifications for business process modeling notation (BPMN)
FAQ
What is a demo flow diagram? A demo flow diagram is a visual map that shows the step-by-step journey a user takes during a product demonstration. It typically includes decision points, actions, and outcomes to help teams align on the demo experience.
How do I create a demo flow diagram? You can start by listing the key stages of your demo, then use a flowchart tool like Lucidchart, Miro, or even pen and paper to connect them. Keep it simple—focus on the main user path and one or two alternative branches.
Who should use a demo flow diagram? Sales teams, product managers, and customer success professionals benefit most from these diagrams. They help ensure everyone delivers a consistent, effective demo that highlights the product’s value.
Can a demo flow diagram replace a script? No, it complements a script rather than replacing it. The diagram provides the high-level structure and logic, while a script adds the specific wording and talking points for each step.
How detailed should a demo flow diagram be? Aim for enough detail to guide the demo without overwhelming the viewer—typically 5–10 main steps with key decision points. Overcomplicating it can make the diagram hard to follow and less useful for training.
How often should I update a demo flow diagram? Update it whenever your product, target audience, or sales process changes significantly. For most teams, reviewing and revising the diagram quarterly or after major product releases works well.
This page will be disappearing soon. Save it to your device for $1 — or read it free while it is here.
@Kory-White- · if Venmo asks, the last 4 of my number are 2012
This page is gone.
This one is off the shelf now. $1 keeps it on your phone for good — the whole page, pictures and diagrams included.
 graphicCustomer Onboarding Flow
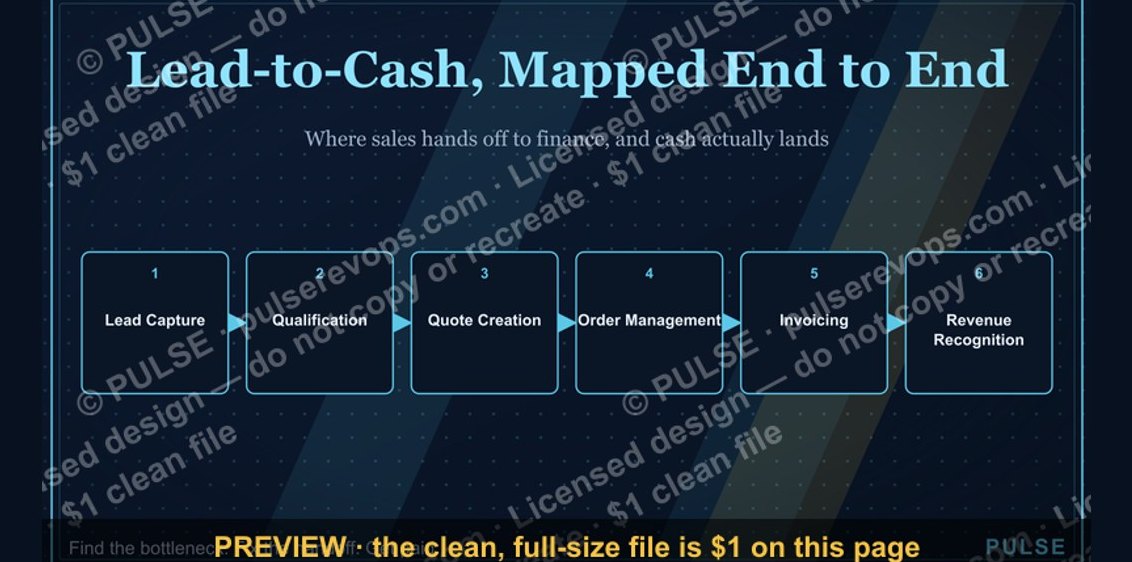 graphicLead-to-Cash Process Map
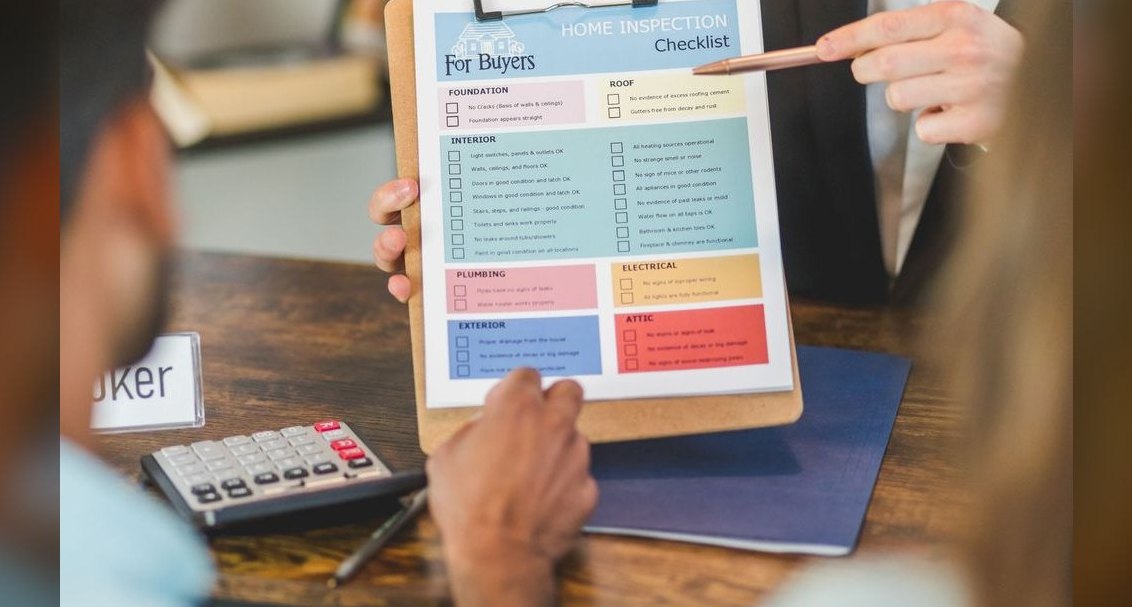 graphicDeal Inspection Flow
 graphicRenewal Process Flow
 graphicDiscovery Call Flow Diagram
 graphicLaunch / Growth Rocket Icon — Icon / Clip Art
 graphicRenewal Risk Decision Tree
 graphic“The best discovery feels like free therapy.” — Quote Card
 graphicSales Ops Analyst — LinkedIn Banner
 graphicThe Customer Journey — Infographic