


MRR Growth Trend Line
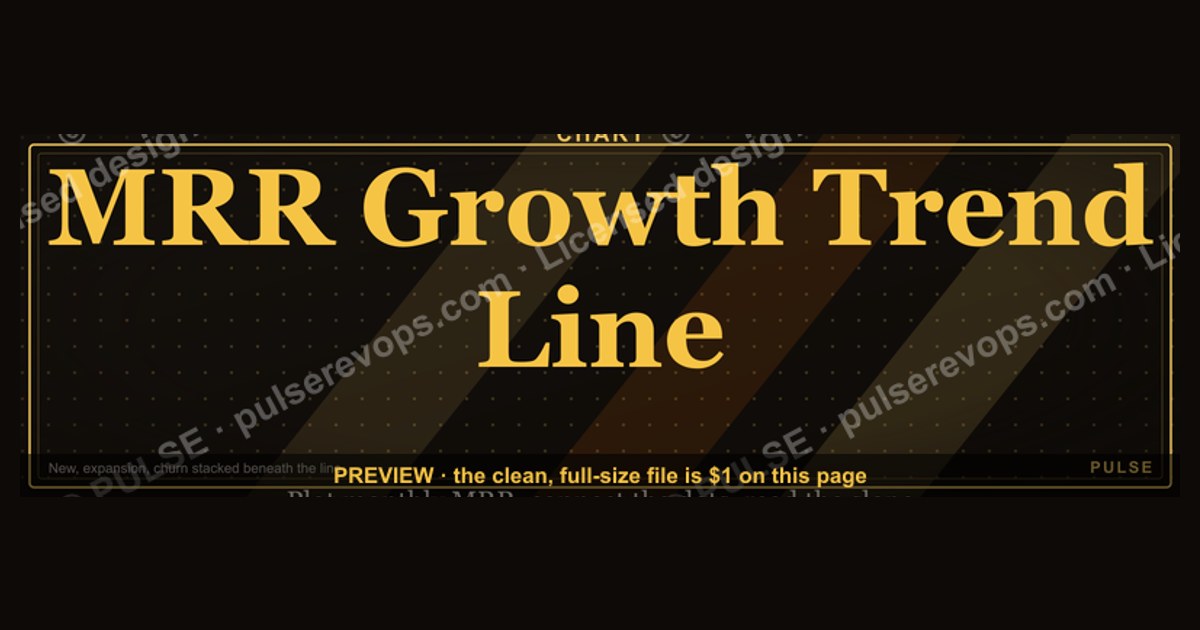

An MRR growth trend line is a visual representation of your monthly recurring revenue plotted over time, typically showing the rate at which your subscription revenue is increasing or decreasing. It is calculated by tracking your MRR at consistent intervals (e.g., monthly) and connecting these data points to reveal the overall trajectory, such as steady growth, acceleration, or stagnation. The slope of the line indicates the velocity of your revenue expansion, with a steeper upward slope suggesting faster growth, often driven by new customers, upgrades, or reduced churn.
MRR Growth Trend Line

Trend line showing MRR growth over 12 months with New / Expansion / Churn bar stacks.
Format: SVG (scalable vector) · Size: 1584×396 px · Category: Chart · License: Free to use — no attribution required.
Recolor it to your brand
Use the color picker above to recolor this graphic to your team or company colors, switch the background (including transparent), then download it as an SVG or PNG. No sign-up, no watermark.
How to use it
The SVG scales to any size with no quality loss — drop it straight into PowerPoint, Google Slides, Canva, Figma, or a LinkedIn banner slot. The PNG export is ready to upload anywhere that wants a raster image.
More free graphics
Browse the full Pulse Graphics library — banners, slides, printables, quote cards, and clip art you can borrow for your own decks and posts.
Related on PULSE
- Forecast Accuracy Trend
- Revenue Trend Icon — Icon / Clip Art
- Pipeline Growth Arrow Icon — Icon / Clip Art
- Launch / Growth Rocket Icon — Icon / Clip Art
- Growth Bar Chart Icon — Icon / Clip Art
- “You can't shrink your way to growth.” — Quote Card
How to Interpret Your MRR Growth Trend Line for Strategic Decisions
A well-constructed MRR growth trend line is more than a visual dashboard ornament — it’s a diagnostic tool that reveals the health of your recurring revenue engine. To extract actionable insights, you need to look beyond the top-line slope and understand what the underlying components (New MRR, Expansion MRR, and Churn MRR) are telling you about your business.
Start by examining the net new MRR — the difference between new and expansion MRR versus churn. A rising trend line is ideal, but the composition matters deeply. If your growth is driven primarily by new MRR from a single sales channel (e.g., outbound or paid ads), you may face concentration risk. Conversely, if expansion MRR consistently outpaces new MRR, it suggests your product has strong stickiness and upsell potential — a sign of product-market fit and a lower customer acquisition cost over time.
Look for inflection points in the trend line. A sudden flattening or dip often correlates with a specific event: a pricing change, a competitor move, a product bug, or a seasonal slowdown. Map these against your internal timeline (e.g., “July: launched new tier,” “October: major churn event from legacy customers”). This correlation helps you isolate cause and effect, so you can double down on what works and fix what doesn’t.
Another critical pattern is the churn-to-expansion ratio. If your expansion MRR is consistently lower than churn MRR, your growth is fragile — you’re running on a treadmill where new customers barely offset losses. Aim for expansion MRR to cover at least 50–80% of churn MRR for a healthy SaaS business. If it’s below that, prioritize customer success initiatives like onboarding optimization, feature adoption campaigns, or proactive support outreach.
Finally, use the trend line to set realistic growth targets. If your 12-month trend shows a 5–8% month-over-month net MRR growth, projecting 15% without operational changes is wishful thinking. Instead, set incremental goals (e.g., reduce churn by 10% over the next quarter) and track how the trend line responds. This turns the chart from a passive report into an active management tool.
Common Pitfalls When Using MRR Growth Trend Lines (and How to Avoid Them)
Even experienced founders and revenue leaders misread MRR trend lines. Avoid these frequent mistakes to ensure your data drives sound decisions.
Pitfall #1: Confusing Gross MRR with Net MRR. Gross MRR (total recurring revenue before churn) can look healthy while net MRR stagnates. If you’re only tracking gross MRR, you might miss a rising churn rate that’s eating your gains. Always display both gross and net MRR on your trend line, or at minimum, overlay the churn MRR component. This gives you a true picture of revenue retention.
Pitfall #2: Ignoring Timing Lags. MRR is a snapshot of the current month, but some events have delayed effects. A customer who signs a contract in January may not show up in MRR until February or March (due to implementation or billing cycles). Similarly, a churn event might take 30–60 days to reflect. Avoid making knee-jerk reactions based on a single month’s dip — look at a 3-month rolling average to smooth out noise and reveal the underlying trend.
Pitfall #3: Overlooking Cohort Effects. An aggregate trend line can mask divergent behavior among customer groups. For example, your enterprise segment might show strong expansion MRR, while your SMB segment bleeds churn. Segment your MRR trend line by customer cohort (e.g., by acquisition channel, plan type, or account size) to see where growth is truly coming from. A single trend line can hide a looming problem in a specific cohort.
Pitfall #4: Treating Churn as a Single Number. Churn MRR isn’t monolithic — it includes voluntary churn (customers canceling), involuntary churn (failed payments), and contraction (downgrades). If your trend line shows rising churn, drill into the subcomponents. A spike in involuntary churn might be fixable with better dunning processes, while voluntary churn signals a product or pricing issue. Without this granularity, you might waste resources on the wrong solution.
Pitfall #5: Forgetting to Normalize for Pricing Changes. If you raised prices mid-year, your MRR trend line will show a one-time jump that isn’t organic growth. Similarly, a major discount promotion can inflate new MRR temporarily. Annotate your chart with these events, or create a “same-customer, same-price” trend line to isolate true organic growth. This prevents misattributing pricing leverage to sales or product improvements.
To avoid these pitfalls, adopt a habit of monthly trend line reviews with your team. Ask: “What story is this trend line telling us? What’s the one component we need to improve most?” This turns the chart into a shared strategic language, not just a metric.
Advanced Techniques: Forecasting and Scenario Modeling with Your MRR Trend Line
Once you’ve mastered reading your MRR growth trend line, you can use it as a foundation for forward-looking analysis. Forecasting and scenario modeling transform historical data into a strategic planning tool — essential for budgeting, fundraising, and resource allocation.
Build a simple MRR forecast using the trend line. Start by calculating your average net MRR growth rate over the last 3–6 months (e.g., 6% month-over-month). Apply that rate to your current MRR to project 6–12 months forward. But don’t stop there — layer in your assumptions. For example, if you plan to hire two sales reps, estimate how much new MRR they’ll generate (typically $10k–$30k per rep per month after ramp, depending on deal size and sales cycle). Adjust the forecast accordingly. This gives you a “base case” that reflects your current trajectory plus planned changes.
Run three scenarios: optimistic, realistic, and pessimistic. Use your historical trend line to calibrate each scenario. For the pessimistic case, assume your churn rate increases by 20% (e.g., from 5% to 6% monthly) and new MRR grows at half the current pace. For the optimistic case, assume expansion MRR doubles (e.g., from 10% to 20% of existing MRR) due to a new upsell campaign. Compare these scenarios side-by-side in a spreadsheet or visualization tool. This exercise reveals your business’s sensitivity to key drivers — and helps you identify which lever (new MRR, expansion, or churn) has the biggest impact on your trajectory.
Use the trend line to model churn reduction ROI. Suppose your current churn MRR is $50k/month, and you’re considering a $30k/month customer success team. If the team can reduce churn by 30% (saving $15k/month), the net benefit is $15k/month in preserved MRR — plus compounding growth over time. Over 12 months, that’s $180k in retained revenue. Compare that to the cost of acquiring the same amount via new MRR (which might require $60k/month in ad spend). The trend line, when paired with churn data, makes this ROI calculation tangible.
Incorporate leading indicators into your forecast. The MRR trend line is a lagging indicator — it tells you what already happened. To improve your forecast accuracy, overlay leading indicators like trial signups, demo requests, or customer health scores. For example, if your trial-to-paid conversion rate drops from 20% to 15%, you can expect a dip in new MRR 30–60 days later. Adjust your forecast proactively rather than reactively.
Share your scenario models with stakeholders. Investors and board members love seeing a data-driven forecast tied to your MRR trend line. Present your base case alongside a “what-if” analysis (e.g., “If we reduce churn by 15%, our MRR at year-end increases by $120k”). This demonstrates strategic rigor and builds confidence in your ability to navigate uncertainty.
By combining your MRR growth trend line with forecasting and scenario modeling, you move from describing the past to shaping the future. The chart becomes a dynamic tool for decision-making, not just a historical record.
Sources
- SaaS industry reports (e.g., from Gartner, Forrester, or Statista) — provide benchmarks and trends for MRR growth across subscription businesses.
- Financial analysis platforms (e.g., Baremetrics, ChartMogul) — offer data and case studies on MRR metrics and growth patterns.
- Business finance publications (e.g., Harvard Business Review, Inc.) — cover strategies for revenue growth and financial performance.
- Subscription management software documentation (e.g., Stripe, Recurly) — explain MRR calculation and growth tracking methods.
- Government economic data sources (e.g., Bureau of Economic Analysis, Federal Reserve) — provide macroeconomic context for revenue trends.
- Academic journals on business or finance (e.g., Journal of Business Research) — publish studies on revenue growth models and metrics.
FAQ
What is an MRR Growth Trend Line? It’s a chart that plots your Monthly Recurring Revenue over time, typically showing the trajectory of your subscription revenue. The line helps you quickly see if your MRR is rising, flattening, or declining month over month.
How often should I update my MRR Growth Trend Line? Most SaaS teams update it monthly after final billing data is in, though some track weekly or even daily for rapid feedback. A monthly cadence is usually sufficient to spot meaningful trends without noise.
What’s a healthy MRR growth rate for a SaaS business? There’s no single number, but many early-stage companies aim for 10–20% month-over-month growth, while mature businesses may target 3–5%. Growth rates naturally slow as the revenue base expands, so context matters.
Can I use this chart if I have annual contracts or usage-based pricing? Yes, but you’ll need to normalize the data—for annual contracts, recognize the monthly portion, and for usage-based, use the recurring portion or a trailing average. The trend line is most useful when MRR reflects predictable, repeatable revenue.
What should I do if my MRR Growth Trend Line is flat or declining? First, diagnose the cause: check for churn, contraction, or stalled new sales. Then experiment with levers like improving onboarding, adjusting pricing, or launching a retention campaign. The trend line itself won’t fix the problem, but it signals when to act.
How is MRR Growth Trend Line different from a simple revenue chart? A revenue chart often includes one-time fees, hardware sales, or professional services, which can mask the underlying subscription health. The MRR Growth Trend Line isolates recurring revenue, giving a clearer view of your core business momentum.
This page will be disappearing soon. Save it to your device for $1 — or read it free while it is here.
@Kory-White- · if Venmo asks, the last 4 of my number are 2012
This page is gone.
This one is off the shelf now. $1 keeps it on your phone for good — the whole page, pictures and diagrams included.
 graphicRevenue by Channel Pie
 graphicPipeline Aging Heatmap
 graphicPipeline Coverage Gauge
 graphicChurn by Segment Bar Chart
 graphicWin Rate by Segment Bar Chart
 graphicWin Rate by Stage Bar Chart
 graphicDeal Stage Progression Bar
 graphicForecast Commit / Best Case / Upside
 graphicSales Velocity Components
 graphicCAC Payback Visualization