


B2B Buyer Journey Map
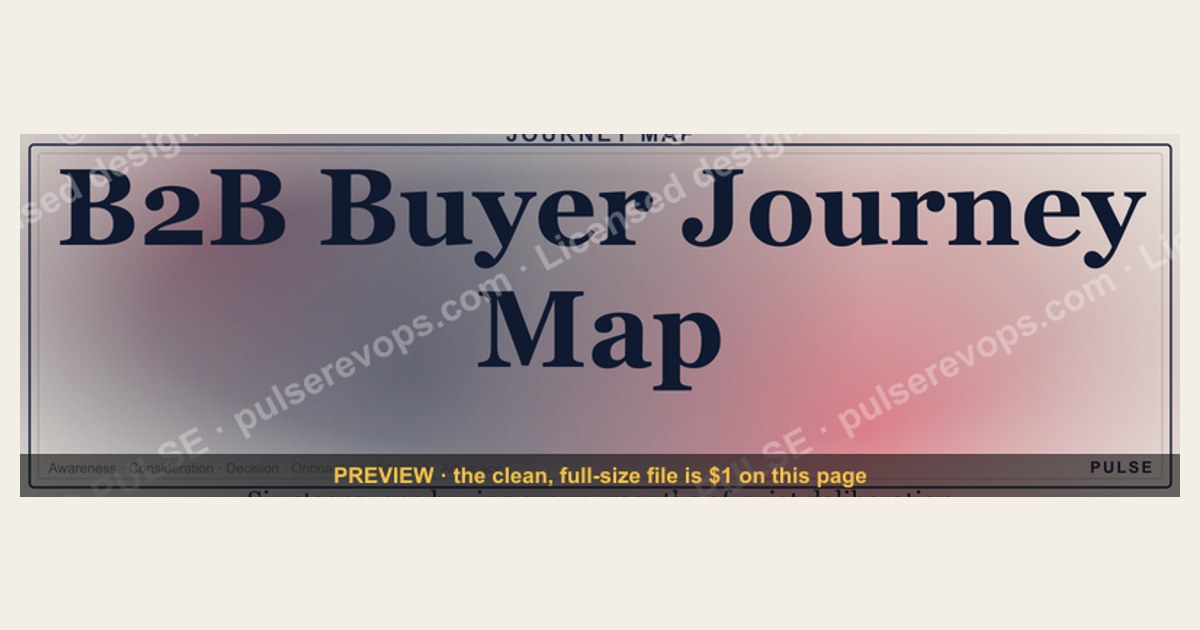
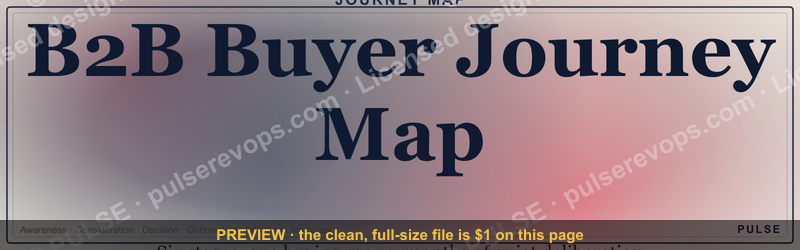
A B2B buyer journey map outlines the stages a business customer goes through, typically from awareness and consideration to decision and post-purchase. It visualizes key touchpoints, pain points, and decision-maker interactions across the buying group. Most maps include 4–6 stages, with timelines ranging from a few weeks to several months depending on deal complexity.
B2B Buyer Journey Map

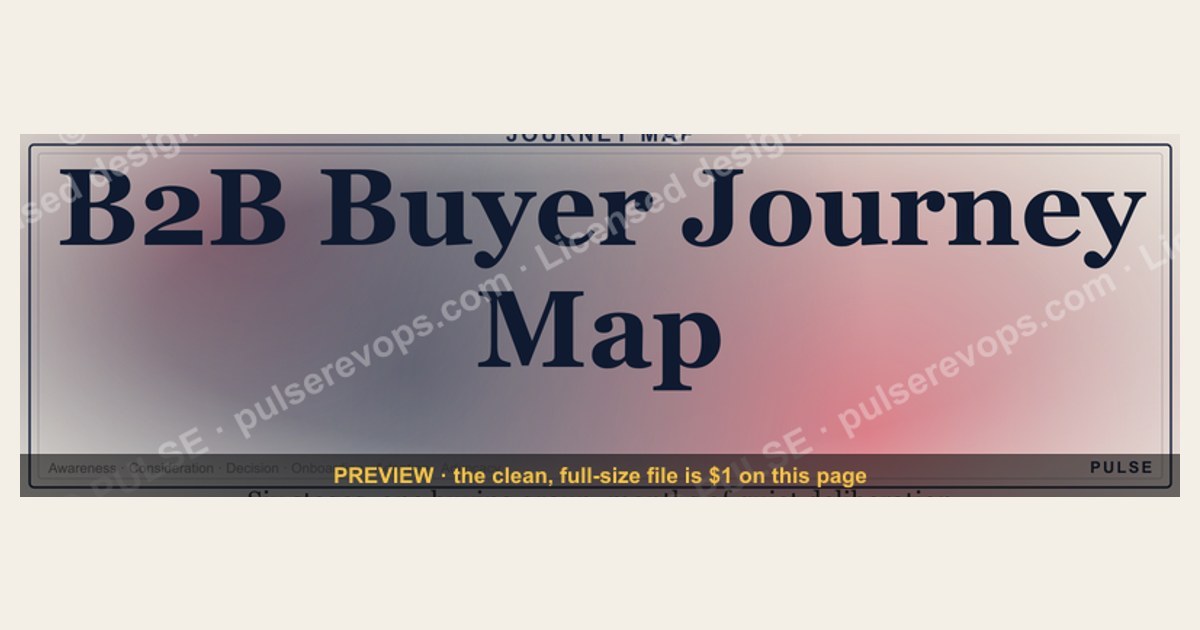
Horizontal buyer journey: Awareness → Consideration → Decision → Onboarding → Adoption → Advocacy with channels.
Format: SVG (scalable vector) · Size: 1584×396 px · Category: Journey · License: Free to use — no attribution required.
Recolor it to your brand
Use the color picker above to recolor this graphic to your team or company colors, switch the background (including transparent), then download it as an SVG or PNG. No sign-up, no watermark.
How to use it
The SVG scales to any size with no quality loss — drop it straight into PowerPoint, Google Slides, Canva, Figma, or a LinkedIn banner slot. The PNG export is ready to upload anywhere that wants a raster image.
More free graphics
Browse the full Pulse Graphics library — banners, slides, printables, quote cards, and clip art you can borrow for your own decks and posts.
Related on PULSE
- Lead-to-Cash Process Map
- B2B SaaS VP of Sales — LinkedIn Banner
- 5 Stages of the Buyer’s Journey — Infographic
- The Customer Journey — Infographic
- “Make the buyer the hero.” — Quote Card
- “A confused buyer never buys.” — Quote Card
Key Decision-Making Units Within the B2B Buying Group
Modern B2B purchases rarely involve a single decision-maker. Research consistently shows that enterprise buying decisions involve an average of 6 to 10 stakeholders across multiple departments, with some complex purchases engaging 14 or more individuals. Understanding the distinct roles and motivations within this buying group is essential for mapping an effective journey.
The Economic Buyer (typically C-suite or VP-level) focuses on ROI, total cost of ownership, and strategic alignment. This stakeholder enters the journey later but holds veto power. Their key questions revolve around payback periods (typically 12-18 months for SaaS solutions), competitive differentiation, and how the purchase supports broader business objectives like market share growth or operational efficiency.
The Technical Evaluator (IT, engineering, or security teams) prioritizes integration complexity, data migration requirements, and compliance with existing tech stacks. They often begin their independent research during the Awareness stage, evaluating technical documentation, API capabilities, and security certifications. Their influence peaks during the Consideration phase when they conduct proof-of-concept testing or security reviews.
The End User (the team that will use the solution daily) cares most about usability, workflow impact, and training requirements. Their adoption resistance or enthusiasm can make or break a deployment. Smart B2B marketers create separate content tracks for end users during the Decision stage, including video walkthroughs, peer testimonials, and sandbox environments.
The Champion (often a mid-level manager or director who initiated the search) acts as an internal advocate. They need ammunition to sell the solution upward—competitive comparison matrices, case studies from similar companies, and implementation timelines. Supporting your champion with battle cards and executive summaries reduces their friction in navigating internal politics.
The Gatekeeper (procurement, legal, or compliance) enters during the final stages, focusing on contract terms, data privacy agreements, and vendor risk assessments. Their involvement typically adds 2-6 weeks to the buying cycle. Providing pre-approved legal templates, SOC 2 reports, and pricing transparency early can prevent last-minute deal delays.
Mapping content and sales interactions to each persona’s stage-specific needs prevents the common pitfall of treating the buying group as a monolithic entity. For example, a technical whitepaper that satisfies the Technical Evaluator may overwhelm the Economic Buyer, while an ROI calculator that resonates with the Champion may lack the depth needed by the Gatekeeper.
Behavioral Triggers and Micro-Moments Across the Journey
The B2B buyer journey is not a linear progression but a series of micro-moments—intent-rich instances when a buyer turns to a device or colleague to act on a specific need. Identifying these triggers allows marketers to deliver the right information at precisely the right psychological moment.
Problem Agitation Triggers occur when an existing pain point becomes acute. Common catalysts include: a failed audit or compliance violation, a competitor announcement that creates urgency, a quarterly review revealing declining metrics, or a key employee departure that exposes process gaps. During these moments, buyers rapidly escalate from Awareness to Active Evaluation, often skipping earlier stages. Content that addresses these triggers includes diagnostic tools, industry benchmarking reports, and "cost of inaction" calculators.
Social Proof Micro-Moments happen when a buyer seeks validation from peers. This typically occurs after initial research but before a formal demo request. Buyers may search for "alternatives to [your product]" or "[competitor] vs [your product] real reviews." They visit review sites like G2, TrustRadius, or Capterra, and scan LinkedIn for mutual connections who use your solution. Ensuring your G2 profile has at least 50 verified reviews with recent dates (within 6 months) significantly impacts conversion at this stage. Case studies featuring companies of similar size and industry are particularly effective—a $50M enterprise buyer rarely relates to a $500M case study.
Budget Justification Moments arise when a champion needs to build an internal business case. This is where ROI calculators, total cost of ownership comparisons, and implementation ROI projections become critical. The best content at this stage includes 3-5 year TCO models that account for training, integration, and ongoing support costs. Buyers in this micro-moment often download pricing pages multiple times and revisit feature comparison charts.
Risk Mitigation Triggers surface during the final evaluation, typically when procurement or legal teams raise objections. Common concerns include data residency requirements, vendor lock-in fears, and contract flexibility. Providing clear exit clauses, data portability guarantees, and transparent uptime SLAs (99.9% or higher) directly addresses these triggers. Case studies showing successful migrations off your platform can paradoxically build trust by demonstrating flexibility.
Implementation Anxiety peaks immediately after purchase, representing a critical moment for retention. Buyers who experience "post-purchase dissonance" may delay implementation or seek alternatives. Proactive onboarding sequences, dedicated customer success touchpoints within the first 7 days, and quick-win milestones (e.g., "first report generated within 48 hours") reduce churn risk by up to 30% according to industry benchmarks.
Tracking these micro-moments requires behavioral analytics—monitoring page visits, content downloads, email engagement, and support ticket patterns. Tools like intent data platforms (6sense, Bombora) can identify when accounts exhibit these triggers, allowing sales teams to reach out with contextually relevant outreach rather than generic follow-ups.
Measuring and Optimizing the B2B Buyer Journey
Without measurement, a buyer journey map remains a theoretical exercise. Effective optimization requires both leading indicators (signals that predict future conversions) and lagging indicators (outcome-based metrics). The most impactful metrics vary by journey stage but share a common thread: they measure buyer behavior, not just marketing activity.
Stage Velocity Metrics track how quickly buyers move between stages. A healthy journey shows consistent compression over time—as your content and sales process improve, buyers should spend less time in Awareness and Consideration. Benchmark data suggests that best-in-class B2B organizations see 40-60% faster stage progression compared to average performers. Tools like HubSpot, Salesforce, or specialized revenue intelligence platforms can calculate stage velocity by tracking time between key events (first website visit to demo request, demo to proposal, proposal to close).
Content Engagement Scoring assigns value to specific interactions. Not all content consumption is equal—a buyer who watches a 15-minute product demo video is more engaged than one who skims a blog post. Develop a scoring model that weights actions by intent: downloading a pricing page (high intent), attending a webinar (medium), visiting the careers page (low). This scoring feeds into lead qualification models and helps prioritize sales outreach. The most sophisticated teams use predictive scoring that incorporates firmographic data (company size, industry, tech stack) alongside behavioral signals.
Drop-off Point Analysis identifies where buyers abandon the journey. Common drop-off zones include: after viewing pricing (indicating price sensitivity or lack of perceived value), during the demo request process (too many form fields or slow follow-up), and between proposal and negotiation (competitor evaluation or internal approval delays). Heat mapping tools and session recording software can reveal friction points in digital experiences. For example, if 60% of visitors abandon the pricing page after scrolling to a certain point, that section likely contains confusing or discouraging information.
Attribution Modeling connects buyer journey touchpoints to revenue. While last-touch attribution (crediting the final interaction before a sale) remains common, it undervalues early-stage content that builds awareness and trust. Multi-touch attribution models—particularly time-decay or U-shaped models—provide more accurate ROI calculations. For instance, a whitepaper downloaded 6 months before a purchase might receive 20% attribution credit, while the final demo gets 40%. This insight justifies investment in top-of-funnel content that may not show immediate returns.
Qualitative Feedback Loops supplement quantitative data. Conducting win/loss interviews with buyers (within 30 days of decision) reveals why they chose your solution or a competitor. Common themes that emerge include: "the competitor had better integration documentation," "your pricing was unclear," or "we didn't see case studies from our industry." These insights directly inform journey improvements—adding integration guides, simplifying pricing pages, or creating industry-specific content.
Optimization Cadence should follow a structured approach: monthly reviews of stage velocity and drop-off rates, quarterly deep dives into attribution and win/loss analysis, and annual journey map revisions based on market changes (new competitors, shifting buyer preferences, regulatory updates). A/B testing journey elements—such as different demo request flows, pricing page layouts, or email nurture sequences—should run continuously with statistical significance thresholds (95% confidence minimum) before implementing changes.
The most mature B2B organizations create a "journey operations" function that bridges marketing, sales, and customer success. This team owns the journey metrics, coordinates cross-functional improvements, and ensures that buyer insights translate into actionable changes across all touchpoints. Without this governance, journey maps become static artifacts rather than living tools for growth.
Sources
- Harvard Business Review — B2B buyer behavior, decision-making processes, and sales strategies
- Gartner — B2B buyer journey research, including the "buying group" and "jobs to be done" frameworks
- Forrester — B2B buyer persona development, journey mapping methodologies, and customer experience insights
- McKinsey & Company — B2B purchasing trends, digital transformation in buying, and customer journey analytics
- LinkedIn B2B Institute — B2B buyer psychology, brand building, and long-term sales funnel research
- Capterra — B2B software buyer behavior, review-driven decision-making, and purchase journey data
FAQ
What exactly is a B2B buyer journey map? A B2B buyer journey map is a visual tool that outlines the stages a business customer goes through—from initial awareness to final purchase and beyond. It typically includes key touchpoints, decision-maker roles, and emotional states at each phase. This helps teams align sales, marketing, and product efforts around the customer's real experience.
How many stages are in a typical B2B buyer journey? Most maps include three to six stages, commonly starting with awareness, then consideration, decision, and sometimes post-purchase. The exact number depends on the complexity of the product and the length of the sales cycle, which can range from a few weeks to over a year. Some organizations add stages like "problem identification" or "vendor evaluation" for more granularity.
Who should be involved in creating a B2B buyer journey map? A cross-functional team works best—including sales, marketing, customer success, and product representatives. Each group brings unique insights into how buyers actually behave, from initial research to renewal. Involving at least one person who regularly speaks with customers ensures the map reflects real experiences rather than assumptions.
How often should a B2B buyer journey map be updated? It's wise to review and update the map every six to twelve months, or whenever there's a major shift in your market, product, or customer base. Buyer behaviors and decision-making processes can change quickly, especially with new technology or economic shifts. Regular updates keep the map accurate and actionable.
What are common mistakes when building a B2B buyer journey map? A frequent error is making the map too linear or simplistic, ignoring the fact that B2B purchases often involve multiple stakeholders and looping back to earlier stages. Another mistake is relying solely on internal assumptions without validating with actual customer interviews or data. Overcomplicating the map with too many details can also make it hard to use effectively.
How does a B2B buyer journey map improve sales and marketing alignment? It provides a shared visual reference that clarifies when and how each team should engage prospects. Marketing can create content for early-stage awareness, while sales knows the right timing for demos or proposals. This reduces friction and ensures consistent messaging across all touchpoints, which can shorten sales cycles and improve conversion rates.
This page will be disappearing soon. Save it to your device for $1 — or read it free while it is here.
@Kory-White- · if Venmo asks, the last 4 of my number are 2012
This page is gone.
This one is off the shelf now. $1 keeps it on your phone for good — the whole page, pictures and diagrams included.
 graphicDecision-Maker Mapping Grid
 graphicTouchpoint Timeline
 graphicSaaS Sales Cycle Stages
 graphicPharmaceutical CRO — LinkedIn Banner
 graphicThe Customer Journey — Infographic
 graphic"Build, don't chase." — LinkedIn Banner
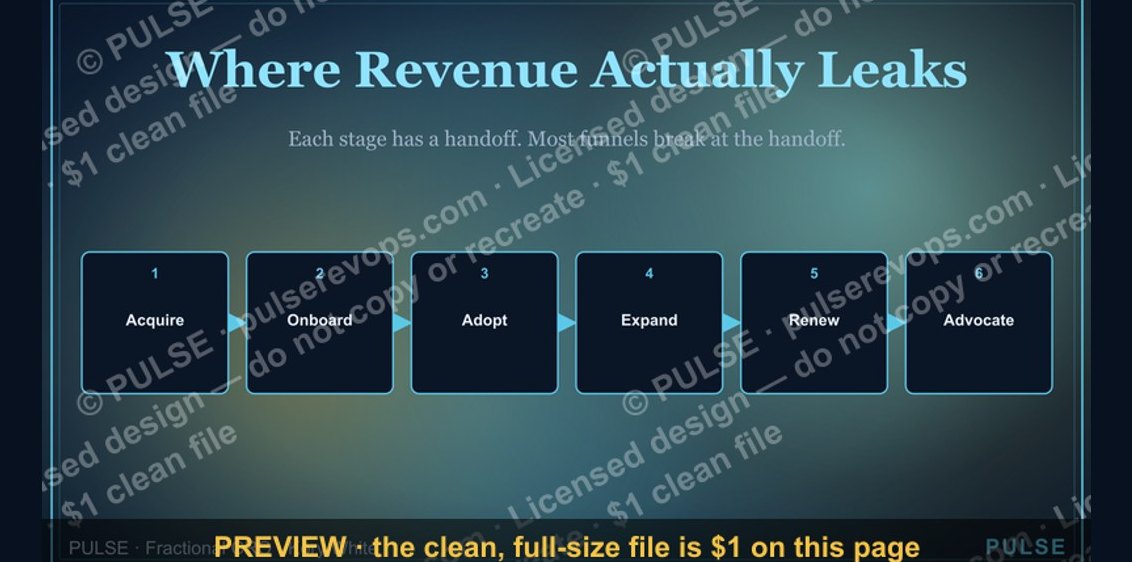 graphicCustomer Lifecycle Funnel
 graphic“The best discovery feels like free therapy.” — Quote Card
 graphic“Don't pitch. Diagnose.” — Quote Card
 graphicAgenda — Section Divider Slide