


Top 10 Sales KPIs for Agronomy & Crop Advisory Services in 2027
Quality
Certified

The key sales KPIs for the Agronomy & Crop Advisory Services industry in 2027 are acres under advisory, revenue per acre, grower retention rate, input pull-through rate, pre-plant pipeline coverage, prescription adoption rate, soil and tissue test penetration, wallet share per grower, and net new grower acres — blending professional-services metrics with distribution economics.
The outcome you should expect
When you instrument an agronomy book of business around the right numbers, the outcome is a revenue engine you can watch move in real time rather than one you only understand at year-end tax prep. The reason this matters is structural: revenue in the Agronomy & Crop Advisory Services industry is not transactional B2B selling. It is a recurring, trust-based relationship tightly coupled to the input sales — seed, fertility, crop protection — that the advice itself drives. A single grower relationship generates a small annual advisory fee and a much larger stream of influenced product spend, and the two move together, which is why any single top-line metric hides more than it reveals.
Because of that coupling, the outcome of good measurement is that you can finally separate three things generic dashboards blur into one: how many acres you cover, how much each acre is worth, and how loyal each grower is. A shop tracking only total sales might feel healthy while quietly bleeding acres and backfilling the gap with price increases. A shop tracking the full KPI set sees the acre erosion in the fall, the wallet-share slippage when a competitor undercuts fertility pricing, and the pre-plant order gap while there is still time to close it before the planter rolls.

The concrete outcome you should expect from a mature scorecard is roughly this: a grower retention rate in the high 80s to low 90s, revenue per acre climbing 8–12% year over year, and a pre-plant pipeline that is 70% or more committed before planting begins. You will also expect fewer surprises. The decisive selling window in this industry is compressed into the weeks before planting, and once the seed is in the ground the season's revenue for that grower is largely fixed. A business run on the right KPIs knows in February whether the season is on track; a business run on gut feel finds out in June when nothing more can be changed.
There is a cultural outcome too. Advisors who see a shared scoreboard stop competing on anecdote — "my growers love me" — and start competing on measurable depth: test penetration, prescription adoption, attach. That shift, more than any single number, is what separates a professional Advisory practice from a friendly input reseller.
What drives that outcome
The outcome above is driven by a chain, not a single lever. Acres under advisory is the foundation — it is the fundamental unit of an agronomy book, and every downstream number scales with it. On top of acres sits revenue per acre, which captures whether you are monetizing the full program (scouting, soil testing, prescriptions, and the influenced inputs) or merely billing basic scouting. Retention protects the base, pull-through converts advice into product revenue, and pre-plant coverage governs timing. Each metric feeds the next, which is why measuring only one of them gives a distorted picture of the whole business.
Reading the chain left to right shows why the sequence matters. Testing penetration is the data foundation — a grower with current soil and tissue tests can be sold a defensible variable-rate prescription. Adopted prescriptions pull higher-value input mix through the operation, which lifts revenue per acre. Higher realized value per acre deepens wallet share, and deeper wallet share is the single strongest predictor of whether a grower renews. Retention then recycles those acres into next season's base, while net new grower acres expand it. Break any link — skip the soil tests, let pull-through lag, miss the pre-plant window — and the revenue-per-acre outcome collapses even when the top-line acre count looks stable.
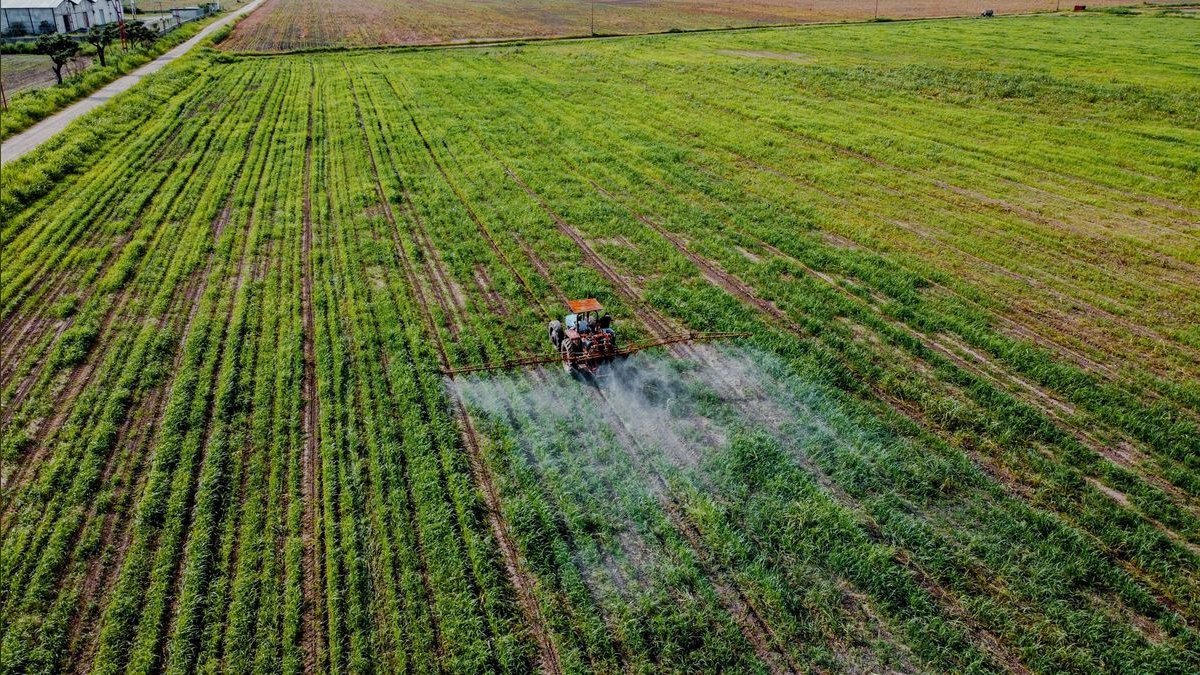
The chain also explains where to spend a scarce sales week. If retention is strong but revenue per acre is flat, the bottleneck is upstream: penetration or adoption. If revenue per acre is healthy but acres are shrinking, the bottleneck is downstream: retention or new-grower acquisition. The KPI set is not a report card; it is a diagnostic that points to the specific link that is failing, so the team stops treating every soft quarter with the same generic "sell harder" response.
Benchmarks and realistic ranges
Benchmarks are starting points, not verdicts; your own trailing trend is the more useful comparison. That said, here is a realistic 2027 range for each core metric so a practitioner has something concrete to aim at.
Acres under advisory is best read as advisor productivity: roughly 8,000–15,000 acres per full-time agronomist, depending on crop complexity and how much travel each visit requires. Row-crop territories sit at the high end; intensive specialty or horticultural books sit lower because each acre demands more attention, more visits, and more granular sampling.
Revenue per acre for influenced revenue commonly lands between $12 and $30 per acre. Basic scouting-only relationships sit near the floor; full-program accounts with variable-rate fertility and premium crop protection push toward and past the top of the range, into the $40s where weekly scouting and prescription services are widely adopted. A closely related productivity metric, sales velocity per grower, runs about $85–$130 per grower per month for full-service operations and $40–$70 for advisory-only firms, with a pronounced pre-plant spike of 2–3x the annual average in February through April and a 40–60% dip after harvest.
Grower retention rate should sit at 88–95% annually. Anything under 80% signals a service or trust problem that will drag revenue per acre down within a season or two, because losing a grower forfeits both the advisory fee and the input pull-through it anchored.
Input pull-through rate — the share of recommended input spend the grower actually buys through you — realistically runs 60–80%. Below 60% usually means growers trust your agronomy but not your pricing or availability. Pre-plant pipeline coverage should reach 70% or more of the season target before planting. Prescription adoption rate lands at 50–70% of eligible acres, soil and tissue test penetration at 60–80% of managed acres, and wallet share per grower at 55–75%. New grower acres added in a healthy book is 5–12% net per season.

Two further product metrics are worth benchmarking as the industry digitizes. Advisory package attach rate — growers on at least one paid advisory tier — runs 45–65% for full-service operations, with top performers above 75%; basic tiers attach at 50–60% while premium weekly-scouting tiers attach at 15–25% but earn 3–4x the per-acre revenue. Digital engagement conversion — the share of growers who take a paid action within seven days of a digital touchpoint — runs 18–30% for email with embedded ordering and 35–50% for in-app prescription approvals, with time-sensitive SMS alerts converting materially higher during the tight pre-plant window.
Treat every range above as a band, not a target line. A book trending from 62% to 71% pull-through is winning even though it is mid-range; a book parked at a "good" 78% but sliding four points a year is losing. Direction and consistency beat the snapshot.
Risks, edge cases, and failure modes
The most common failure mode is not a missing metric but an ambiguous one. If two people compute "revenue per acre" from different denominators — some counting only advised acres, others counting every acre the grower farms — the number means nothing and the dashboard quietly gets ignored. Define each KPI once, in writing, with an exact formula and a named source system before you track anything. This one discipline prevents more dashboard deaths than any tool purchase.
A second failure mode is vanity in the acre count. Total acres under advisory can look flat or even grow while the composition rots: you are shedding profitable full-program growers and replacing them with input-only accounts that never adopt a prescription. That is why net new grower acres (a flow metric) must be tracked separately from total acres (a stock metric), and why wallet share matters more than raw revenue. A grower split across three suppliers is a retention risk no matter how much they spend with you this season.
Seasonality is the edge case that breaks naïve monthly reporting. Because this industry's revenue is front-loaded into the pre-plant window, a month-over-month comparison of raw sales is almost meaningless — October will always look catastrophic next to March. Compare each month to the same month last year, and watch pre-plant coverage as a leading indicator rather than waiting for the revenue to book. An order not committed before planting is mostly a lost order for the season, because the planting decision is irreversible once made.

Other real failure modes recur across the industry: pull-through that lags because a competitor undercut fertility pricing (the advice landed but the product did not); prescription adoption that stalls because the maps were too complex for the grower to trust; and digital tools that generate engagement metrics but no sales because one-click ordering was never wired into the grower's farm-management software. Firms whose recommendations flow directly into the platforms growers already use see materially higher conversion than those requiring manual re-entry. A final, quieter trap: tying advisor compensation to input volume alone silently punishes the recurring, higher-margin advisory revenue you actually want to grow — so align incentives to package attach and wallet share, not just tonnage, or you will hit your volume number while the Services side of the business withers.
A practical rollout plan
You almost certainly already hold the raw data for these KPIs — it is just scattered across an accounting package, a scheduling or scouting tool, and a sales spreadsheet. The work is consolidation and cadence, not new instrumentation. Roll it out in a deliberate sequence rather than trying to light up all nine metrics on day one.
Start by writing the definition and data source for every metric so the number means the same thing each month — this single step prevents the most common reason dashboards die. Next, automate the feed directly from the systems of record; a KPI that depends on someone remembering to update a spreadsheet will silently drift out of accuracy within a quarter. Then give every metric one named owner, because a dashboard everyone watches and no one owns changes no behavior. Two or three trusted metrics beat nine half-trusted ones, so resist the urge to launch the full set before the first three are clean.
Set the cadence by how fast each number can actually move. Fast operational metrics — pre-plant coverage, pull-through, digital conversion — belong in a weekly team review where you still have time to act before the planting window closes. Relationship and retention metrics belong in a monthly ownership review, since they change over seasons, not weeks. Benchmark first against your own trailing trend and only secondarily against the industry ranges above; a metric moving the right direction month over month matters more than hitting a generic number on any single day.
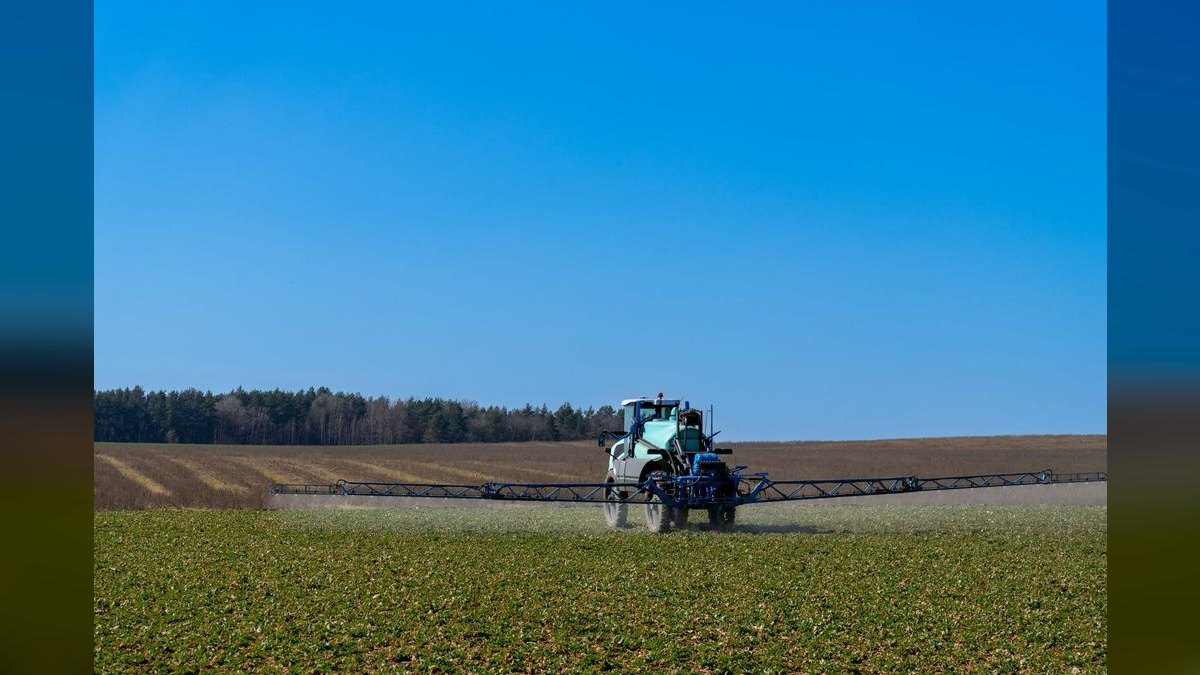
Sequence the metrics themselves in the same order as the value chain. Instrument acres under advisory first because it is unambiguous and anchors every ratio. Layer test penetration and prescription adoption next, since they are the levers you can pull inside a season. Add pull-through and revenue per acre once those feeds are trusted, and bring retention and wallet share online last, because they need a full season of clean data before the trend line means anything. Done well, this rollout turns an Agronomy & Crop Advisory Services operation run on gut feel into one run on a shared scoreboard, where problems surface in time to fix them and growth is the product of deliberate decisions rather than luck.
Related questions
How is revenue per acre different from sales velocity per grower?
Revenue per acre divides influenced revenue by acres managed and answers "how much value per unit of land." Sales velocity per grower divides annual revenue by active accounts and by twelve, adding a time dimension that reveals seasonal pacing and which growers underperform relative to their acreage.
Which single KPI best predicts profitability?
Grower retention rate, because retaining a grower costs far less than acquiring one and lets you deepen wallet share over multiple seasons. A retention rate below 80% almost always precedes falling revenue per acre, making it the earliest reliable warning that trust or service quality is slipping.
How often should these KPIs be reviewed?
Match cadence to how fast the number moves. Operational metrics — pre-plant coverage, pull-through, prescription adoption — warrant weekly team review during the selling window. Retention, wallet share, and acres under advisory change over seasons and belong in a monthly review with ownership.
Do advisory-only firms use the same KPIs as full-service dealers?
Mostly yes, but the ranges differ. Advisory-only firms lean on package attach rate, prescription adoption, and test penetration, and see lower sales velocity per grower ($40–$70/month) because they forgo input pull-through. Full-service dealers additionally track wallet share and pull-through as core revenue drivers.
What is a realistic first metric to instrument?
Acres under advisory, because it is unambiguous, already lives in your scheduling records, and anchors every downstream ratio like revenue per acre and productivity per advisor. Once acres are clean and trusted, layering retention and revenue per acre on top becomes straightforward.
FAQ

What is the difference between "acres under advisory" and "new grower acres added"?
Acres under advisory is a stock metric — the total footprint you currently advise. New grower acres added is a flow metric — only the acres from growers onboarded this season. The first shows scale; the second shows your ability to genuinely expand the book rather than just churning within existing accounts.
How is revenue per acre calculated, and what range is realistic?
Divide total advisory plus influenced-input revenue by total acres under advisory. A realistic 2027 range for a well-run operation is roughly $12–$30 per acre on influenced revenue, and higher — into the $40s — where premium services like variable-rate fertility and weekly scouting are widely adopted. Crop type, region, and service depth all move the number.
Why is grower retention rate treated as a leading indicator?
Because retaining a grower is far cheaper than winning one, and long relationships let you deepen wallet share season over season. A retention rate slipping below 80% typically signals service or trust problems that will erode revenue per acre before they ever show up in the top-line total.
What does input pull-through rate measure, and why does it matter?
It measures the share of your recommended seed, fertility, and crop protection the grower actually buys through you — the bridge between advice and revenue. A rate below 60% often means growers value your agronomy but not your pricing or availability, so the advice is landing while the margin leaks to a competitor.
How can a small firm improve prescription adoption rate?
Keep the maps simple, start with the highest-impact input like variable-rate nitrogen, and deliver a season-end summary showing the grower the realized ROI. Adoption in the 50–70% range is the target, and even a ten-point lift can add several dollars of revenue per acre across the book.
Is soil and tissue test penetration a sales metric or an agronomic one?
Both. High penetration — 60–80% of managed acres — shows growers are engaged and willing to invest in data, which reliably raises prescription adoption and pull-through. It also hands the sales team specific, defensible product recommendations grounded in each field's actual results.
Sources
- https://www.nass.usda.gov/ — USDA National Agricultural Statistics Service (crop production, yields, farm economics)
- https://www.agronomy.org/ — American Society of Agronomy (agronomic practice research and professional standards)
- https://www.mckinsey.com/industries/agriculture — McKinsey & Company agriculture practice (agribusiness trends and performance)
- https://agfundernews.com/ — AgFunder News (agri-food tech investment and market analysis)
- https://www.agweb.com/ — Farm Journal / AgWeb (crop advisory performance and grower behavior)
- https://www.fertilizer.org/ — International Fertilizer Association (input sales and agronomic data)
- https://www.ers.usda.gov/ — USDA Economic Research Service (farm income and input cost data)
Related on PULSE
- What are the key sales KPIs for the Commercial Drone Pesticide & Crop Spraying Services industry in 2027?
- What are the key sales KPIs for the Specialty Seed & Crop Input Distribution industry in 2027?
- Top 10 Agriculture Yield per Acre and Revenue per Crop Metrics
- What are the key sales KPIs for the Commercial Wealth Management and Financial Advisory industry in 2027?
- Average Contract Value (ACV) for Cloud Services: Enterprise Sales Metric
This page will be disappearing soon. Save it to your device for $1 — or read it free while it is here.
@Kory-White- · if Venmo asks, the last 4 of my number are 2012
This page is gone.
This one is off the shelf now. $1 keeps it on your phone for good — the whole page, pictures and diagrams included.
 pulse-industry-kpisTop 10 KPIs for Roofing Contractors in 2027
 pulse-industry-kpisTop 10 Sales KPIs for Commercial Solar Carport Construction in 2027
 pulse-industry-kpisTop 10 Sales KPIs for Commercial Glass and Glazing Contracting in 2027
 pulse-industry-kpisTop 10 Sales KPIs for Industrial Cooling Tower Service & Repair in 2027
 pulse-industry-kpisTop 10 Sales KPIs for Industrial Heat Treating & Metal Finishing Services in 2027
 pulse-industry-kpisTop 10 Sales KPIs for Commercial Chiropractic Practice in 2027
 pulse-industry-kpisTop 10 Sales KPIs for Industrial Robotics OEM in 2027
 pulse-industry-kpisTop 10 Sales KPIs for Commercial Janitorial and Cleaning Services in 2027
 pulse-industry-kpisTop 10 KPIs for Barbershops in 2027
 pulse-industry-kpisTop 10 Sales KPIs for Marine Sail & Rigging Loft Services in 2027