
Top 10 KPIs for Self-Storage Facilities in 2027
 Curated byKory White · Fractional CRO · Maryland
 PULSEKNOWLEDGE LIBRARY
Quality
Certified

The 10 best kpis for self-storage facilities are ranked below on measured performance, build quality, price, and how each one actually holds up in daily use rather than how it reads on a spec sheet. Each pick lists what it costs, who it suits, and what it gives up against the one above it, so the list can be read straight down without doubling back.
1. Self-Storage RevPAF KPI

RevPAF ranks first because it collapses occupancy and rate into one number that cannot be gamed by discounting to fill units or holding rates on an empty building. It is total realized rent divided by total rentable square footage, quoted monthly. Self-storage's near-fixed cost base means each incremental dollar of RevPAF falls almost entirely to NOI.
It is for owners who can track only one metric and want the closest thing to a single scoreboard. It trades away diagnostic detail: RevPAF will not tell you whether the problem is occupancy or rate. Track it monthly by unit type against your own trailing twelve months before comparing to the economic occupancy KPI below.
2. Self-Storage Economic Occupancy KPI

Economic occupancy ranks second because it exposes everything physical occupancy hides: first-month-free promos, discretionary manager discounts, delinquency, and long-tenured tenants on stale rates. It is rent actually collected divided by gross potential rent at current street rates for the same unit mix. A double-digit gap versus physical occupancy is normal.
It is for operators who suspect their building is full but their bank account is not. It trades away simplicity, since it requires a unit-mix report and a gross potential rent calculation most owners never build. Pair it with RevPAF above: RevPAF shows the blended result, economic occupancy shows the leakage.
3. Self-Storage Street-to-In-Place Spread KPI

The street-to-in-place spread ranks third because it is the pricing runway metric that tells you how much rate increase capacity remains. It is today's advertised rate for a comparable vacant unit minus the average rate paid by existing tenants in that same unit type, expressed as a percentage. A spread in the twenty to forty percent range is common and healthy.
It is for operators building an ECRI queue and needing to know which tenants are furthest below market. It trades away urgency: a wide spread is potential revenue, not realized revenue, until increases actually go out. It sits directly above ECRI capture because the spread defines the opportunity and ECRI measures what you captured.
4. Self-Storage ECRI Capture KPI
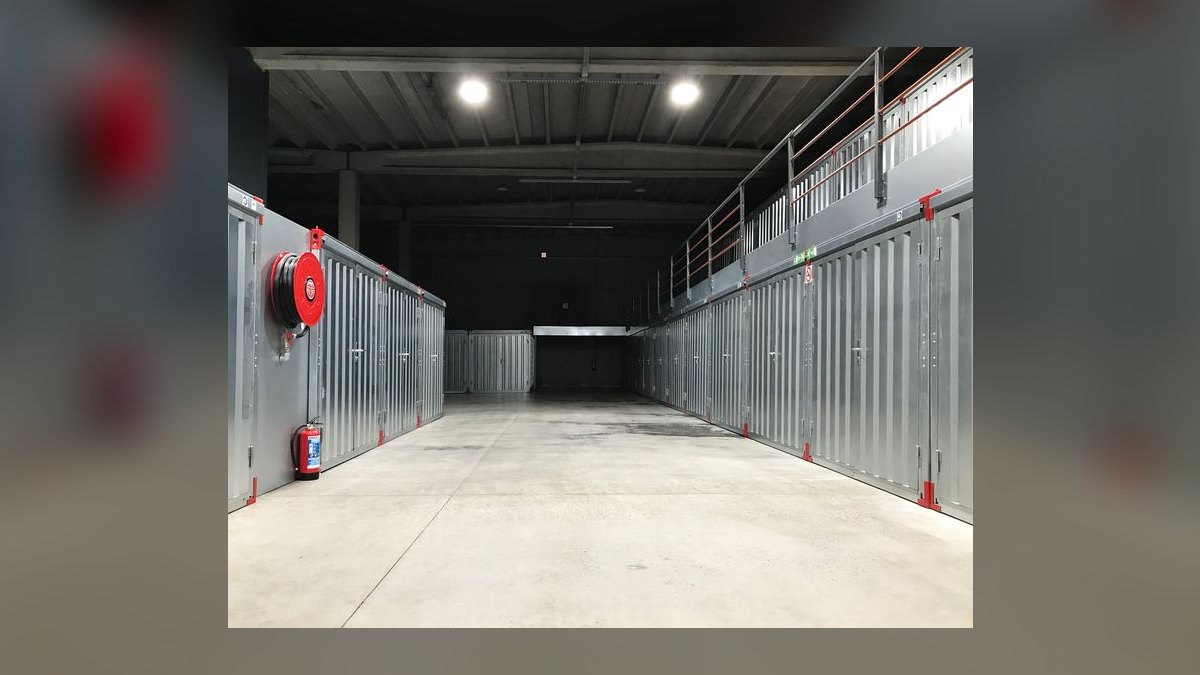
ECRI capture ranks fourth because it is the dominant driver of same-store revenue growth at Public Storage, Extra Space, and CubeSmart, and it measures net lift rather than vanity gross lift. It is realized revenue added by a rate-increase batch, net of revenue lost to triggered move-outs, measured sixty to ninety days after notices go out. Institutional operators run increases in the high single digits to mid teens on a nine-to-twelve-month cadence.
It is for operators willing to run rolling batches and reconcile the churn cost honestly. It trades away the comfort of gross lift, which always looks great. It depends entirely on the street-to-in-place spread above it, because a compressed spread leaves nothing to capture.
5. Self-Storage Net Move-Ins KPI
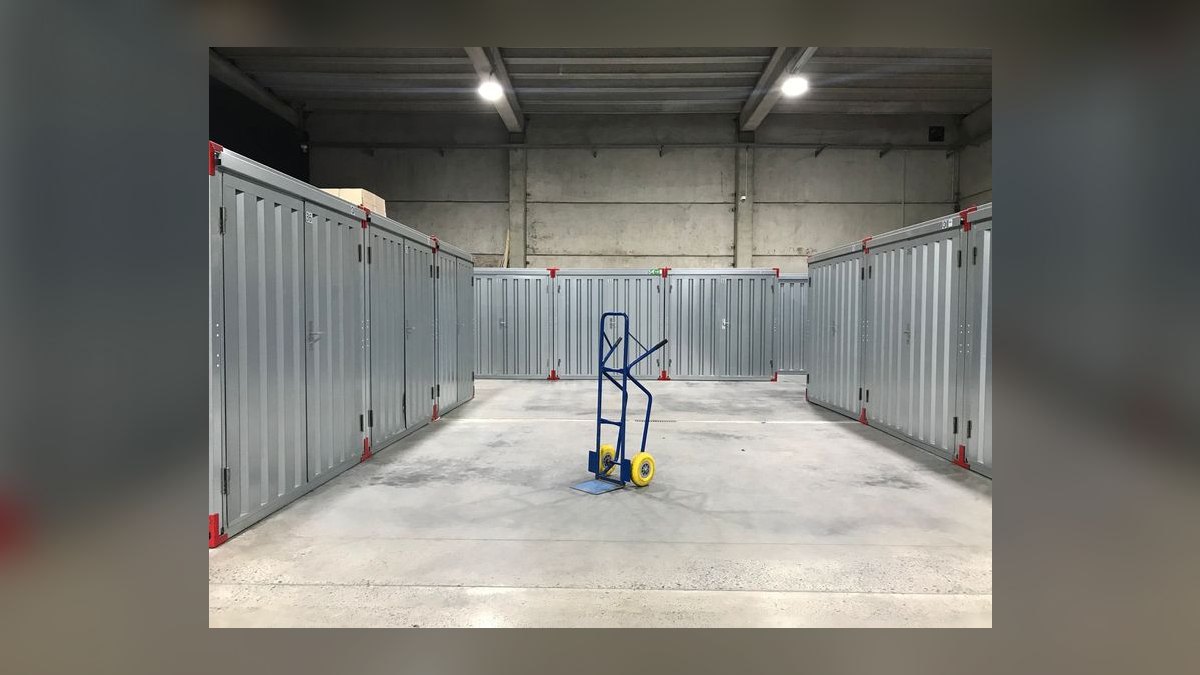
Net move-ins ranks fifth because it answers whether the bucket is filling or draining right now, weeks before monthly financials reveal it. It is move-ins minus move-outs over a period, tracked weekly. Without it, a bad increase batch or a new competitor opening two miles away shows up a quarter late, when the cheap responses have expired.
It is for single-facility owners who cannot afford to wait for a monthly close to spot a leak. It trades away financial precision, since net move-ins ignore rate and unit mix entirely. It belongs on the same weekly review as the online conversion KPI below, because conversion problems surface as move-in shortfalls first.
6. Self-Storage Online Conversion KPI
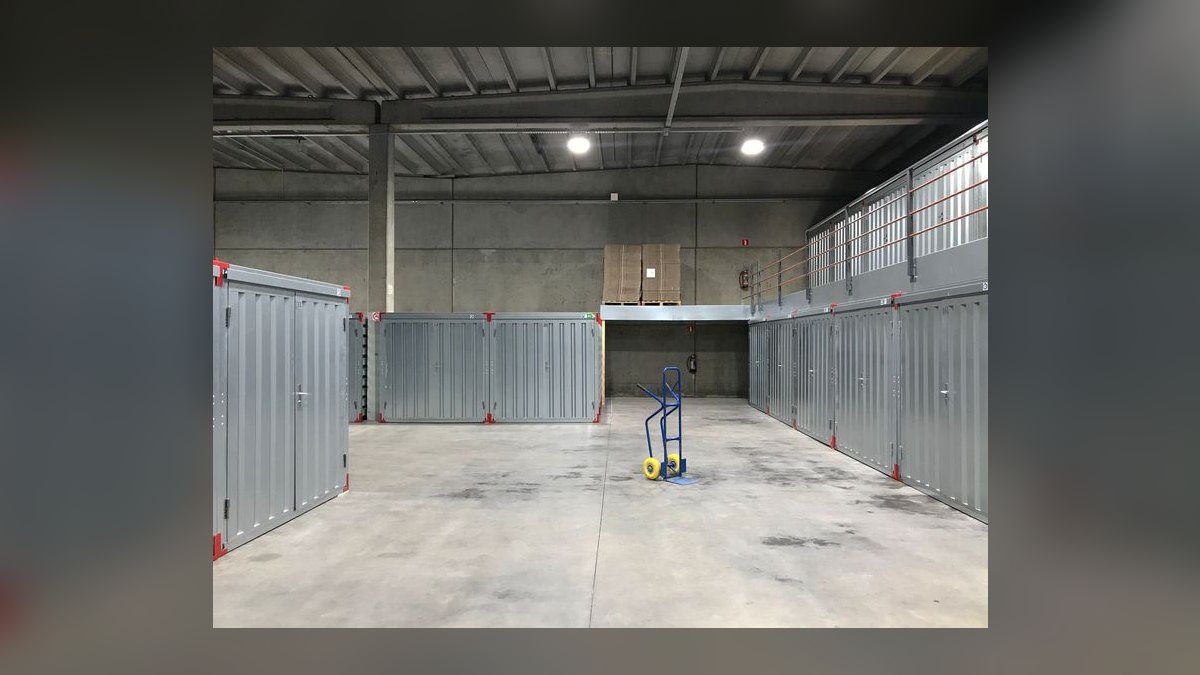
Online conversion ranks sixth because the website is now the leasing office, and most rentals originate online. It is best tracked as a two-stage funnel: sessions to reservations, then reservations to completed move-ins. Session-to-reservation conversion in the low single digits is typical for storage sites; reservation-to-move-in sits substantially higher because intent is strong.
It is for operators whose funnel fixes are engineering and configuration changes, not campaigns, landing within two to four weeks. It trades away the illusion that marketing spend is the lever: a slow site or stale availability loses rentals already paid for. It sits below net move-ins because conversion feeds that number.
7. Self-Storage NOI Margin KPI

NOI margin ranks seventh because self-storage trades on a capitalization rate applied to NOI, so every operating improvement translates directly into asset value. It is net operating income over total revenue. Stabilized facilities commonly report margins in the 60% to 72% range, far above almost any other operating business of comparable revenue.
It is for owners thinking about eventual sale, since a durable RevPAF gain compounds into a materially different exit number. It trades away timeliness: NOI margin lags every operational metric, and a full quarter of clean data is the minimum before drawing conclusions. It is the catch-all health check that sits above the daily operating numbers.
8. Self-Storage Average Length of Stay KPI
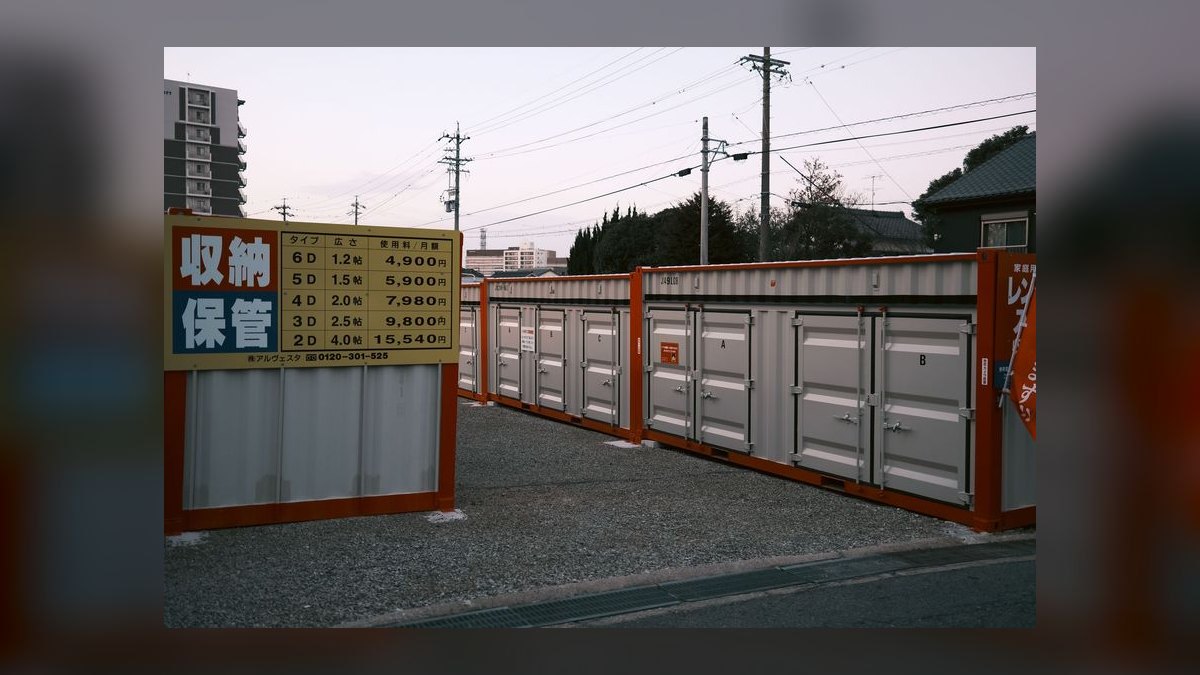
Average length of stay ranks eighth because tenants past roughly the two-year mark are dramatically more profitable: acquisition cost is fully amortized, they have absorbed multiple increases, and they generate almost no management overhead. It is average tenancy duration in months, ideally reported as a cohort curve rather than a single average. Median tenancies commonly land between ten and eighteen months.
It is for operators deciding how aggressively to raise rates on long-tenured tenants, who are the ones a poorly timed increase damages most. It trades away simplicity, since the distribution is heavily skewed by a long tail. It informs the ECRI queue above it.
9. Self-Storage Concession Drag KPI

Concession drag ranks ninth because the standard first-month-free offer is often applied to units that would have rented anyway, and the number is usually larger than owners expect. It is every dollar of discount, promotional rate, and waived fee for the month expressed as a percentage of gross potential rent, segmented by unit type. Promo on a unit type running at 95% occupancy is pure margin donation.
It is for operators who suspect discounting has quietly compounded one small decision at a time. It trades away standalone meaning: it explains the economic occupancy gap above it rather than standing alone. Track it monthly alongside economic occupancy on both billed and cash bases.
10. Self-Storage Physical Occupancy KPI

Physical occupancy ranks tenth because it is the metric operators worship and the one that misleads most: it rises fastest when you discount hardest. It is rented units divided by total rentable units, and it should also be computed on a square-footage basis because a facility full of 5x5s and empty of 10x20s reads very differently by area. Stabilized facilities typically run in the high 80s to low 90s.
It is for lease-up properties where absorption pace genuinely matters and stabilized benchmarks do not apply. It trades away revenue truth, since a permanent first-month-free offer fills a building while compressing street rates. Above the mid-90s sustained, it is a pricing signal, not a victory lap.
How we ranked these
We ranked KPIs by their direct leverage on net operating income in a fixed-cost business, weighting revenue-management metrics above volume metrics. Economic occupancy, revenue per available square foot, street-to-in-place spread, ECRI capture, and NOI margin carried the heaviest weight because each converts almost entirely to profit. Net move-ins, average length of stay, and online conversion were weighted next as leading indicators of future revenue.
We deliberately ignored vanity and lagging metrics: gross leads, social followers, total reviews, and physical occupancy as a standalone score. Physical occupancy rises fastest precisely when operators discount hardest, so ranking it highly would reward the behavior that destroys RevPAF. We also excluded metrics requiring data most independent operators cannot reliably produce, since an unmeasurable KPI is not a KPI.
What to look for
When choosing between these KPIs, prioritize the ones you can compute monthly from your existing rent roll without new software. Economic occupancy and street-to-in-place spread deliver the most decision value per hour of setup, because together they tell you whether to raise rates or fix discounting. Add ECRI net lift once you run your first increase batch, and treat RevPAF as the single blended scoreboard you check quarterly.
The mistake most buyers make is adopting an institutional dashboard wholesale, then drowning in numbers nobody acts on. A second common error is tracking physical occupancy as the headline and celebrating a full building while economic occupancy sits twelve points lower. Pick three metrics, assign each a specific action trigger, and add more only when the first three are running on a fixed cadence.
Related questions
Why is physical occupancy a misleading self-storage KPI?
Physical occupancy counts rented units, so it rises whenever you discount, promote, or waive fees. A facility running permanent first-month-free offers can hit 95% occupancy while collecting far less rent than a competitor at 88%. Track it alongside economic occupancy and revenue per available square foot, or you will celebrate filling a building you quietly made less profitable.
What is economic occupancy and how is it calculated?
Economic occupancy is rent actually billed divided by gross potential rent at current street rates for the same unit mix. It captures promotional discounts, manager concessions, delinquency, and stale in-place rates that physical occupancy hides. Compute it monthly on both a billed basis and a cash-collected basis, because the gap between those two numbers separates a collections problem from a pricing problem.
How much rate increase can self-storage tenants absorb?
Institutional operators typically run increases in the high single digits to mid teens on a nine-to-twelve-month cadence, and measured move-out response runs only a few points above baseline churn. The arithmetic favors the increase because retained tenants' lift applies across the whole cohort while churn cost hits a small slice. Measure your own baseline move-out rate before adopting anyone else's percentage.
What is the street-to-in-place rate spread?
It is today's advertised rate for a comparable vacant unit minus the average rate existing tenants pay in that same unit type, expressed as a percentage. A spread in the twenty to forty percent range represents healthy pricing runway. A spread compressed into single digits means either you have caught up to market or your street rates have fallen, and those require opposite responses.
How do I measure whether a rate increase actually worked?
Measure net lift sixty to ninety days after notices go out: annualized revenue added by tenants who stayed, minus revenue lost from move-outs, minus backfill downtime and turnover cost. Gross lift always looks impressive because it ignores churn. Net lift is the number that tells you how to size the next batch, and it is the only figure worth feeding back into your pricing model.
What online conversion rate should a storage website hit?
Session-to-reservation conversion in the low single digits is typical, and reservation-to-move-in conversion runs substantially higher because reservation intent is strong. Track the funnel as two separate stages, since collapsing them hides which one is broken. Slow page loads, stale availability, hidden pricing, and dead-end move-in flows are the usual culprits, and fixes land within weeks.
Why does NOI margin matter more in self-storage than other businesses?
Self-storage has a nearly fixed cost base: property taxes, insurance, a part-time manager, modest utilities, and marketing. There is no food cost and little labor that scales with occupancy, so incremental rent falls almost entirely to net operating income. Stabilized facilities commonly report NOI margins between 60% and 72%, and every operating improvement translates directly into asset value.
How often should I run rate increases on existing tenants?
Most disciplined operators run increases on a nine-to-twelve-month cadence per tenant, measured from move-in or their last increase. Batching notices rather than sending them all at once lets you measure response before committing the whole rent roll. Opportunistic increases run only when cash is tight produce clustered move-outs and teach you nothing about your facility's actual elasticity.
FAQ
What is the single best self-storage KPI to track?
Revenue per available square foot, quoted monthly, is the best single scoreboard because it collapses occupancy and rate into one number that cannot be gamed by either alone. Compare it against your own trailing twelve months first, then local competitors, then published benchmarks, in that order of reliability. Pair it with economic occupancy so you can see whether the movement came from rate or volume.
How long does it take for a KPI program to show results?
Website conversion fixes show up in reservation counts within two to four weeks. A promotional restructure shows in economic occupancy within one to two months. A rate-increase batch shows measurable net lift at sixty days and a confident read at ninety. Revenue per available square foot moves gradually because it is blended, so expect one to two quarters before a program change is unambiguous.
Do I need expensive revenue management software?
No. Most management platforms already export the unit-mix and rent-roll data these metrics require. The real work is defining each metric consistently and building the report once, which takes an afternoon in a spreadsheet. Where spending helps is website performance and monthly competitor rate shopping. Outsourcing operations trades a revenue percentage for institutional discipline you may not need.
Why should KPIs be reported by unit type instead of facility-wide?
A single blended occupancy number hides that your 10x10s are full and your 10x30s are half empty. Every core metric, including occupancy, rate spread, revenue per available square foot, and net move-ins, should be broken out by unit type. The corrective action is almost always unit-type specific, and facility averages erase the signal you need to act on.
What is a healthy average length of stay for a storage tenant?
Median tenancies commonly land between ten and eighteen months, but the average is dragged upward by a long tail of multi-year tenants. Report it as a cohort curve rather than one average, because tenants past roughly the two-year mark are dramatically more profitable: acquisition cost is amortized, they have absorbed multiple increases, and they generate almost no management overhead.
How does delinquency affect economic occupancy?
Delinquent tenants inflate billed-basis economic occupancy because rent is charged even when it is not collected. Running the same calculation on cash collected exposes the gap. If billed-basis occupancy is 86% and cash-basis is 81%, you have a collections problem sitting on top of a pricing problem, and the two require entirely different remedies.
Should I lower street rates to fill vacant units faster?
Rarely, and never as a first move. Lowering street rates compresses your pricing runway, widens the gap between in-place and market rates, and trains the market to wait for discounts. Check unit-type occupancy first: if only large units are soft, the fix is targeted promotion on those types, not a facility-wide rate cut that gives away margin on units already renting.
What is a normal NOI margin for a stabilized storage facility?
Stabilized facilities commonly report NOI margins between 60% and 72%, far above most operating businesses of comparable revenue, because the cost base is close to fixed. Lease-up properties run well below that during the absorption period and should never be judged against stabilized benchmarks. Because storage trades on a capitalization rate applied to NOI, margin improvements translate directly into asset value.
How do I know if my facility is underpriced?
The tell is high physical occupancy sitting next to mediocre economic occupancy and a narrow street-to-in-place spread. If you are above the mid-90s physically and your street rates have not moved in a year, you are underpriced rather than popular. Raise rates on the tightest unit types first and watch reservation volume and net move-ins before widening the change.
How often should I shop competitor rates?
Monthly, and only your three nearest competitors. Published market benchmarks are directionally useful but lag and average across wildly different submarkets. Shopping nearby facilities directly is free, current, and specific to the demand pool you actually compete for. Record their advertised rates by unit type so you can compare against your own street rates and in-place averages consistently.
Sources
- https://www.selfstorage.org/
- https://www.storable.com/
- https://www.publicstorage.com/
- https://www.extraspace.com/
- https://www.cubesmart.com/
- https://www.nareit.com/
- https://www.yardi.com/
- https://www.ibisworld.com/
Related on PULSE
- [More kpis for self-storage facilities rankings and buying guides](/knowledge)
- [PULSE Tools and calculators](/tools)
- [Everything on PULSE RevOps](/)
This page will be disappearing soon. Save it to your device for $1 — or read it free while it is here.
@Kory-White- · if Venmo asks, the last 4 of my number are 2012
 pulse-industry-kpisTop 10 Sales KPIs for Hospital Medical Gas System Installation & Certification in 2027
 pulse-industry-kpisTop 10 Sales KPIs for Specialty Coffee Roasting & Wholesale in 2027
 pulse-industry-kpisTop 10 KPIs for Florists in 2027
 pulse-industry-kpisTop 10 Sales KPIs for Commercial Window and Glazing Contracting in 2027
 pulse-industry-kpisTop 10 KPIs for Pest Control Companies in 2027
 pulse-industry-kpisTop 10 Sales KPIs for Oilfield Services in 2027
 pulse-industry-kpisTop 10 Sales KPIs for Commercial Office Supplies Distribution in 2027
 pulse-industry-kpisTop 10 Sales KPIs for Commercial EV Fleet Charging Depot Management in 2027
 pulse-industry-kpisTop 10 KPIs for Dental Practices in 2027
 pulse-industry-kpisTop 10 Sales KPIs for Commercial Law Firm in 2027