


Top 10 Sales KPIs for Livestock Auction & Marketing Services in 2027
Quality
Certified
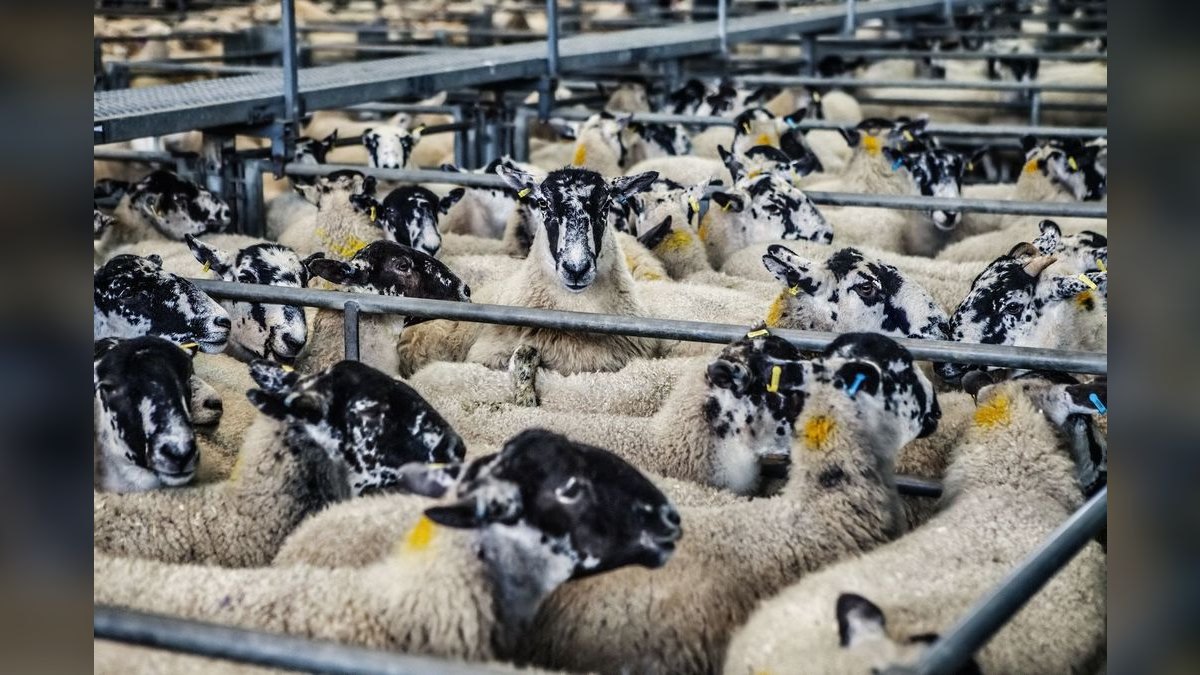
The key sales KPIs for the Livestock Auction & Marketing Services industry in 2027 are head sold per sale, gross sale value, commission revenue per head, active consignor count, buyer attendance, price realization versus market, yardage and service-fee share, consignor retention, and repeat-buyer rate — tracked together so volume, value, and relationships stay visible at once.
Why an auction barn needs its own KPI set
A livestock auction almost never owns what it sells. The barn earns a commission on the gross dollar value of animals passing through its ring, then layers on yardage, feed, handling, and brand-and-tag fees. That structure makes the Livestock Auction & Marketing Services business fundamentally different from transactional B2B selling, and it is why a generic CRM scorecard — win rate, pipeline value, quota attainment — measures almost nothing that actually drives the money in this industry.
Revenue here scales on two axes at the same time: the number of head that move and the price each head fetches. Because commission is a percentage of sale value, an operator's income rises and falls with both throughput and the cattle, hog, sheep, or goat market itself. A barn can run the same number of sales two years running and still watch revenue swing 20% purely on price. That double exposure is exactly why a single top-line number lies, and why the right KPI set separates volume from value from margin instead of blending them into one misleading figure.

The nine core metrics fall into three families. Volume metrics — head sold per sale and gross sale value — tell you how big the market you host actually is. Yield metrics — commission revenue per head, price realization versus market, and yardage share — tell you how much of that gross you convert into your own revenue. Relationship metrics — active consignor count, buyer attendance, consignor retention, and repeat-buyer rate — tell you whether next quarter's sales will be as full as this quarter's. A barn that watches only the first family optimizes a machine while the fuel line quietly drains.
The whole point of a scorecard for this industry is to keep all three families visible at one fixed cadence, so a supply problem shows up in the consignor numbers weeks before it ever shows up in gross sale value. Read any single metric in isolation and you will misread the business; read them as a system and the story becomes unambiguous. The volume family answers "how big is my market," the yield family answers "how much of it do I keep," and the relationship family answers "will it still be here next month" — and no one family can substitute for another.
The step-by-step process to stand up the scorecard
Most Livestock Auction & Marketing Services operations already hold every figure these KPIs need — it is just scattered across an accounting package, a scale-and-scheduling tool, and a clerk's spreadsheet. Standing up the scorecard is a consolidation project, not a data-collection one, and it runs in a repeatable sequence that a typical barn can complete inside a single quarter.
First, define each metric once, in writing. Fix the exact formula and the exact system of record for every KPI. Head sold per sale is total head divided by sale events; commission revenue per head is total commission divided by head sold; price realization is your average lot price divided by a regional benchmark index. Ambiguous definitions are the single most common reason a dashboard gets quietly abandoned — two people compute "retention" two different ways, the numbers stop agreeing, and everyone stops trusting the board within a month.

Second, automate the feed. Pull figures directly from the systems of record rather than re-keying them. Head count and gross value come off the sale-day settlement run; yardage and service fees come off the billing module; consignor and buyer identity come off registration and the buyer number issued at the ring. A metric that depends on someone remembering to update a sheet by hand will drift within weeks and silently corrupt every trend built on top of it.
Third, set the cadence by metric speed. Fast operational numbers — head sold, gross value, buyer attendance — belong in a weekly team review the morning after each sale, while the sale is still fresh. Relationship and retention numbers — consignor retention, repeat-buyer rate, price-realization trend — belong in a monthly ownership review, because they only move meaningfully across many sales and reacting to a single sale's wobble just adds noise.
Fourth, assign one owner per metric. A dashboard everyone watches and no one owns changes no behavior. The yard manager owns cost per head; the field representative owns active consignor count; the office manager owns consignor retention; ownership owns gross sale value and price realization. Fifth, benchmark against your own trailing trend first, then against the regional and industry ranges below — direction beats any published absolute on a single day.
Costs, timelines, and typical 2027 ranges
The build itself is cheap relative to the revenue it protects. Consolidating existing data into one reviewed dashboard is usually a two-to-six-week effort using tools an operation already licenses — the accounting export plus a spreadsheet, or a low-cost business-intelligence layer if you want charts that refresh themselves. The expensive part is discipline, not software: holding the weekly review every single week for a full quarter until the numbers are trusted and the owners internalize their levers.
The ranges below are 2027 starting points; your own trailing trend is always the more useful comparison. Head sold per sale for a mid-sized barn commonly runs 500–2,000 head, judged against ring capacity and prior-year sales rather than an absolute target. Gross sale value is read by year-over-year direction — a healthy 5–15% lift usually reflects higher prices, more head, or both, and must always be split into those two causes. Commission revenue per head frequently lands around $10–$40 for cattle depending on sale type and service bundle; the figure matters less than its stability, since it isolates your take rate from raw price swings.

On the yield side, price realization versus market should sit at or above the regional benchmark — top performers hold roughly 98–105% of the index, and consistent under-market results drive consignors away faster than any fee difference ever could. Yardage and service-fee revenue typically runs 15–35% of total revenue; a higher share cushions the business against livestock-price volatility because those fees stay far more stable than commission when the market corrects. On the relationship side, consignor retention of 80–90% and a repeat-buyer rate of 60–75% mark a well-run operation, while buyer attendance has no universal target — the real test is whether every lot draws enough active bidders to be genuinely competitive.
Operational cost metrics complete the picture and belong beside the sales numbers. Cost per head sold — total operating expense excluding sales commissions, divided by head — commonly runs $8–$15 for cattle depending on facility age and local labor rates. Labor efficiency of 150–250 head per full-time employee per sale day is a reasonable 2027 goal for a mid-sized yard. When prices are high, volume masks a bloated cost structure; a downturn exposes it instantly, which is precisely why cost per head has to sit next to commission revenue per head at every review rather than in a separate accounting report no one on the sales side reads.
Where teams get these KPIs wrong
The most common failure is watching gross sale value as if it were performance. Gross value blends volume and price, so a barn can feel prosperous in a rising market while its head count, consignor base, and buyer pool all quietly shrink underneath. When prices correct, that erosion surfaces all at once and looks like a sudden collapse when it was really months of slow decline. The fix is simple discipline: always read gross value next to head sold and active consignor count, never alone.
A second trap is letting consignor concentration hide inside a healthy total. Active consignor count can look fine while three large operations supply most of the head. Lose one and an entire sale collapses. The metric to watch is not just the raw count but the share of head from your top handful of consignors — anything above roughly 40–50% from the top five is a standing risk flag that belongs in the monthly review with a named plan to broaden supply.
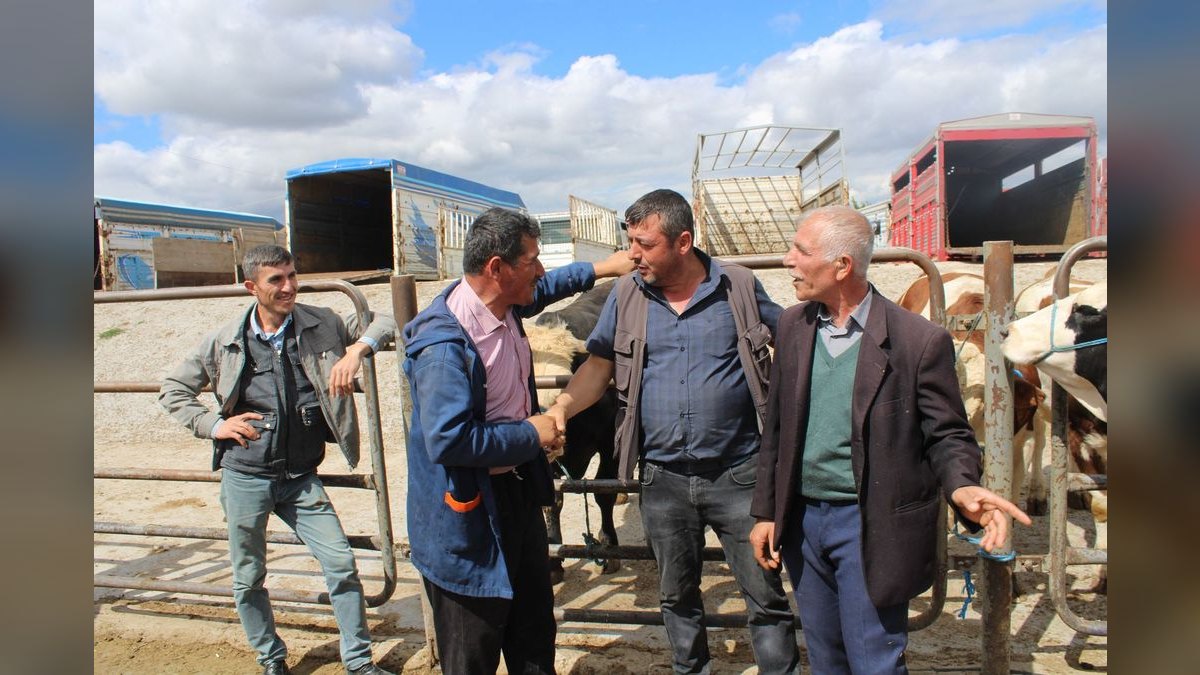
Third, teams treat buyer attendance as a courtesy number rather than a revenue driver. Thin buyer turnout depresses prices, which shortchanges consignors, which shrinks future consignment — a self-reinforcing spiral. Buyer demand is what makes the market; if the repeat-buyer rate is sliding, price realization will follow within a few sales even if head count holds steady for now. Fourth, many operators underweight digital participation. By 2027, out-of-state feeders, packers, and specialty breeders increasingly bid via live-stream, and online buyers frequently represent net-new geographic demand insulated from local weather and holidays. An operation with online participation below 20% is likely leaving real gross value on the table, and pairing an online-participation metric with an online-versus-floor bid comparison is the only honest way to prove the digital channel actually lifts prices rather than merely relocating bidders who would have shown up anyway.
The last and quietest mistake is chasing generic industry benchmarks instead of your own trend. A number moving the right direction month over month tells you more than hitting a published figure on any single day. Benchmarks orient you when you are brand new to a metric; your own trailing trend is what decides whether a lever is working.
Decision framework: which KPI to act on when
Nine-plus metrics can paralyze a team unless there is a rule for which one to act on. The framework is to diagnose by symptom, then move to the specific lever that metric controls, rather than reacting to whatever number happened to move the most this week.
If gross sale value falls, split the cause before acting: check head sold and price realization side by side. Falling head with steady realization is a supply problem — work active consignor count and consignor retention through field recruiting, faster settlement, and better service. Steady head with falling realization is a demand problem — work buyer attendance and repeat-buyer rate, and audit whether your ring is genuinely competitive on every lot rather than just the marquee ones. If margin compresses while revenue holds, the answer sits in cost per head and yardage share, not in the sales metrics at all — automate handling, revisit the fee schedule, or improve labor efficiency per sale day.
If retention slips, treat it as the earliest warning signal in the whole system and escalate immediately, because both consignors and buyers churn quietly and re-recruiting supply for every sale is the single most expensive failure mode in this business. The rule of thumb: supply problems are worked between sales through relationships, demand problems are worked at the ring through competition, and margin problems are worked in the yard through cost — and a healthy scorecard tells you which one you actually have before you spend a dollar fixing the wrong thing.
Related questions

How many KPIs should a small sale barn actually track?
Start with four: head sold per sale, gross sale value, consignor retention, and repeat-buyer rate. They cover volume, value, and both sides of the relationship. Add commission revenue per head and cost per head once the first four are automated and trusted by the whole team.
Do these KPIs change for hogs, sheep, or goats versus cattle?
The metrics stay identical; only the benchmark ranges shift. Commission per head, cost per head, and typical head-per-sale all scale down for smaller species, so track each livestock category against its own trailing trend rather than mixing them into one blended, misleading number.
What is the single most predictive KPI for a livestock auction?
Consignor retention. Because supply drives every downstream number — head sold, gross value, buyer turnout — a retention slide reliably predicts weaker sales weeks before revenue reflects it. It is the earliest actionable warning signal in the entire scorecard.
How does online bidding affect these KPIs in 2027?
It expands the buyer pool geographically and can lift price realization by adding out-of-market demand. Track online participation share alongside repeat-buyer rate; if online bids consistently match or beat floor bids on comparable lots, the digital channel is genuinely adding value, not just relocating bidders.
How often should ownership review the full scorecard?
Operational metrics weekly, the morning after each sale; relationship and margin metrics monthly. Reviewing retention or realization weekly invites overreaction to noise, while reviewing head count or attendance only monthly lets a problem sale go unexamined far too long.
FAQ
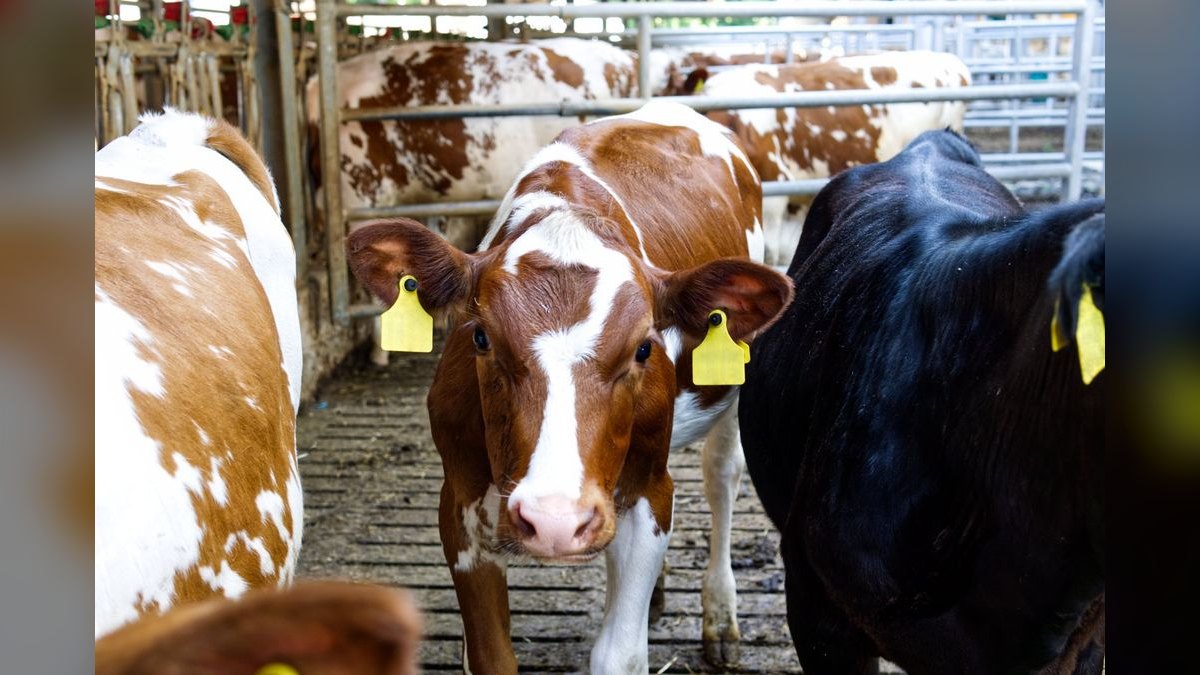
How is head sold per sale calculated, and why does it matter? It is total animals sold divided by the number of sale events in the period. It is the primary volume driver of commission and yardage revenue, so a steady or rising head count signals healthy consignor and buyer engagement. A common 2027 range for mid-sized operations is 500–2,000 head per sale, varying by species and region.
What does gross sale value tell us that other metrics don't? It captures the total dollar value of livestock sold before commissions and fees, blending volume and market price into one top-line gauge of market activity. A 5–15% year-over-year rise typically reflects higher prices, more head, or both — but it must always be read beside head count to separate the two causes cleanly.
Why is commission revenue per head a critical metric? It isolates the auction's average take per animal from raw livestock-price swings, showing fee competitiveness and how much value each transaction captures for the barn. Typical 2027 figures run roughly $10–$40 per head for cattle depending on sale type and service bundle. Its stability matters more than its absolute level.
How do active consignor count and consignor retention differ? Active consignor count is the number of unique sellers in a period; retention is the share of prior-period consignors who return. A high retention rate of 80–90% signals trust and satisfaction, while a rising active count signals market expansion. Watch both — growth paired with churn is just an expensive treadmill.
What does price realization versus market actually measure? It compares your average achieved price to a regional benchmark or index. A reading at or above 100% means your ring earns a premium, which pulls in more consignors; consistent under-market results drive sellers away. Top-performing barns in 2027 hold roughly 98–105% of the market benchmark on comparable classes of stock.
How is yardage and service-fee revenue share used to improve profitability? It is the portion of total revenue from non-commission sources — feed, handling, overnight yardage, tagging. A higher share, commonly 15–35%, diversifies income and cushions the business against volatile livestock prices, since these fees stay stable when commission swings. Tracking it guides service pricing and new fee offerings.
Sources
- USDA National Agricultural Statistics Service (NASS) — https://www.nass.usda.gov/
- USDA Agricultural Marketing Service, Livestock, Poultry & Grain Market News — https://www.ams.usda.gov/market-news/livestock-poultry-grain
- Livestock Marketing Association — https://www.lmaweb.com/
- IBISWorld industry research — https://www.ibisworld.com/
- National Cattlemen's Beef Association — https://www.ncba.org/
- USDA Economic Research Service, Animal Products — https://www.ers.usda.gov/topics/animal-products/
- U.S. Department of Agriculture — https://www.usda.gov/
Related on PULSE
- What are the key sales KPIs for the Commercial Greenhouse Produce Marketing & Brokerage industry in 2027?
- What are the key sales KPIs for the Commercial Marketing Agency industry in 2027?
- Average Contract Value (ACV) for Cloud Services: Enterprise Sales Metric
- What are the key sales KPIs for the Managed Detection and Response (MDR) Services industry in 2027?
- What are the key sales KPIs for the AI Safety and Red Team Services industry in 2027?
This page will be disappearing soon. Save it to your device for $1 — or read it free while it is here.
@Kory-White- · if Venmo asks, the last 4 of my number are 2012
This page is gone.
This one is off the shelf now. $1 keeps it on your phone for good — the whole page, pictures and diagrams included.
 pulse-industry-kpisTop 10 Sales KPIs for Commercial Concrete Contracting in 2027
 pulse-industry-kpisTop 10 Sales KPIs for Commercial Janitorial and Cleaning Services in 2027
 pulse-industry-kpisTop 10 KPIs for Florists in 2027
 pulse-industry-kpisTop 10 Sales KPIs for Industrial Tank & Silo Manufacturing in 2027
 pulse-industry-kpisTop 10 Sales KPIs for Online Travel Agency (OTA) in 2027
 pulse-industry-kpisTop 10 KPIs for Roofing Contractors in 2027
 pulse-industry-kpisTop 10 Sales KPIs for Commercial Paving Contracting in 2027
 pulse-industry-kpisTop 10 Sales KPIs for Medical Billing and Revenue Cycle Management in 2027
 pulse-industry-kpisTop 10 KPIs for Pressure Washing Companies in 2027
 pulse-industry-kpisTop 10 Sales KPIs for Commercial Print Services in 2027