


Top 10 Sales KPIs for Heavy Equipment Dealership in 2027
Quality
Certified

The 10 best sales kpis for heavy equipment dealership are ranked below on measured performance, build quality, price, and how each one actually holds up in daily use rather than how it reads on a spec sheet. Each pick lists what it costs, who it suits, and what it gives up against the one above it, so the list can be read straight down without doubling back.
1Product Support Absorption

Absorption ranks first because it is the master metric that governs every other number on a heavy equipment dealership scorecard. The formula is parts gross profit plus service gross profit divided by total operating expense; at 100 percent the parts counter and service bays have covered the building, IT stack, sales compensation, and controller before a single machine leaves the lot.
This metric is for dealer principals and controllers, not line sales reps, and it trades away the flattering simplicity of unit volume for a harder read on durability. Below 100 percent, the business is levered to the construction cycle, interest rates, and highway bill timing. It outranks Customer Machine Population Coverage directly below because coverage is a leading input while absorption is the output those inputs ultimately produce.
2Customer Machine Population Coverage

Coverage ranks second because it converts the service department's billing history into an actual prospect list. The OEM supplies a serial-number-level population file for your territory; your DMS knows which serial numbers bought parts or opened a work order in the trailing twelve months. The difference is the conquest list, and it is usually larger than the sales organization expects — auction-bought machines, relocated units, and owners who quietly left after a bad service experience.
This metric is for sales managers and territory reps who need a named pipeline rather than a weather report. It trades away the comfort of measuring only customers you already serve, because the uncovered serial numbers require outbound selling with a longer cycle. It sits below Product Support Absorption because coverage is an input; above Territory Market Share because it is machine-level and actionable weekly rather than quarterly.
3Territory Market Share

Territory market share ranks third because it is the only metric that measures the dealership against competitors rather than against its own prior year. The OEM compiles competitive registration data quarterly, which is the natural cadence — arguing with the number monthly wastes everyone's time. It captures whether the dealership is winning in its exclusive area of responsibility or quietly ceding ground to a neighboring dealer.
This metric is for the dealer principal and the OEM regional manager, reviewed in the quarterly business session alongside the agreement renewal pipeline. It trades away timeliness: by the time share data lands, the quarter's deals are already booked. It sits below Customer Machine Population Coverage because coverage is machine-level and fixable inside a month, while share is a lagging scorecard that reflects many prior decisions.
4Technician Billable Utilization

Billable utilization ranks fourth because it is the fastest-moving input underneath absorption and the one most often broken. The formula is billable hours divided by available hours, and the manipulation surface is enormous — travel time, shop cleanup, training, warranty administration, and comeback rework all have to land somewhere. If they disappear from the denominator, the number looks excellent and tells you nothing.
This metric is for branch managers and service managers who can fix a scheduling gap before lunch. It trades away the illusion of capacity: a shop running above the healthy band is likely understaffed, which surfaces later as burnout, attrition, and unbilled comeback rework. It sits below Territory Market Share because utilization is an internal operational lever, and above Customer Service Agreement Attach Rate because it moves within weeks without requiring a single new customer.
5Customer Service Agreement Attach Rate

Attach rate ranks fifth because it is the second-fastest lever under absorption and it operates on machines already being quoted. It only moves when the agreement is priced into the machine quote as a default line item the customer must actively remove; measuring it monthly and exhorting the sales team does not move it. Changing the quote template does.
This metric is for sales managers and reps, and it should be reviewed weekly rather than quarterly because a quarterly review is a postmortem — the agreements were either sold at the point of quote or they were not. It trades away the short-term margin optics of a cleaner machine price.
6Rental Revenue and Utilization

Rental revenue and utilization rank sixth because they convert idle fleet into product support demand and feed the used equipment pipeline when units roll out. The critical discipline is reading utilization alongside fleet age: older units rent at lower rates, break down more often on customer sites, consume service capacity that could be billed externally, and produce weaker used inventory at resale.
This metric is for the rental manager and dealer principal, and it trades away the apparent cost avoidance of deferring fleet replacement — which is actually margin destruction dressed as savings. It sits below Customer Service Agreement Attach Rate because attach rate compounds on every machine sold, and above Used Equipment Gross Margin because rental utilization is a controllable operational input while used margin is partly a consequence of trade-in decisions made months earlier.
7Used Equipment Gross Margin

Used equipment gross margin ranks seventh because it is where trade-in discipline shows up months after the fact. A trade appraised optimistically to close a new machine deal becomes a used unit that ages on the lot, absorbs floor plan interest, and eventually sells at a loss charged to the used department rather than to the deal that created it. Mature dealers charge the appraisal variance back to the originating transaction.
This metric is for used equipment managers, sales managers, and the controller reviewing aging reports monthly. It trades away the short-term new-unit volume that aggressive appraisals buy, in exchange for honest deal economics. It sits below Rental Revenue and Utilization because rental utilization is directly controllable week to week, and above Parts Revenue because used margin is largely a consequence of decisions made upstream in the trade and appraisal process.
8Parts Revenue

Parts revenue ranks eighth because it is the largest single component of the absorption numerator and the most predictable recurring revenue in the dealership. Demand is a function of machine hours already running in the territory — hours that accrued in prior years and will keep accruing regardless of what happens to new-order intake next quarter. Filters, ground engaging tools, undercarriage, and hydraulic components turn on machine hours, not on the construction cycle.
This metric is for parts managers and branch managers, reviewed daily at the counter and monthly at the dealer principal level. It trades away the glamour of machine transactions for the unglamorous annuity that actually carries overhead. It sits below Used Equipment Gross Margin because parts demand is relatively stable and therefore less diagnostic, and above Service Labor Revenue because parts gross profit typically exceeds labor gross profit per transaction.
9Service Labor Revenue

Service labor revenue ranks ninth because it is the second half of the absorption numerator and the hardest to scale without technician capacity. You can sell every service agreement in the territory and it converts to nothing if the bays are not staffed. The industry has a structural shortage of qualified equipment and diesel technicians, and it is demographic rather than cyclical, so capacity is the binding constraint.
This metric is for service managers and dealer principals, and it trades away the short-term utilization optics of running lean — dealers who budget for apprenticeship and training overhead accept depressed utilization today for capacity tomorrow. It sits below Parts Revenue because labor is capacity-constrained while parts demand flows regardless, and above New and Used Units Sold because labor revenue recurs across the machine's full working life.
10New and Used Units Sold
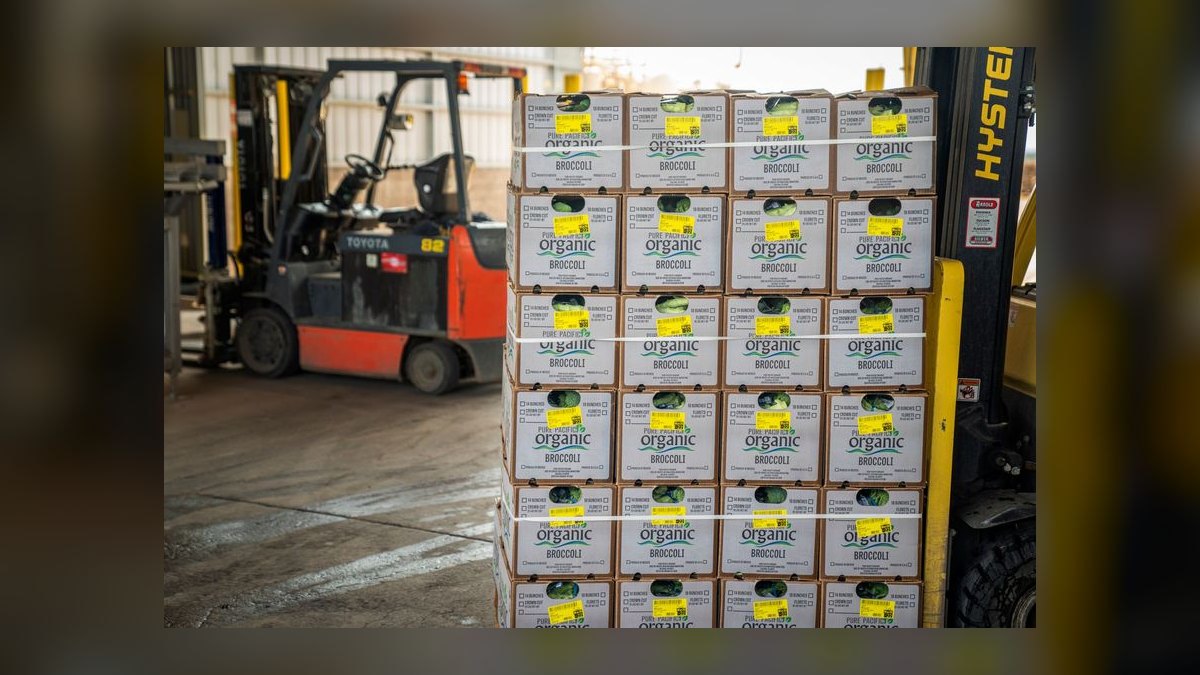
New and used units sold ranks tenth because it is the most visible metric and the least predictive of dealership durability. Unit volume satisfies OEM quota and market share ambitions, but the transaction margin is the entry ticket — the annuity is the business. A rep who books a machine at full margin but loses the service agreement to an independent shop has sold once; a rep who discounts modestly and locks a five-year agreement has sold ten times.
This metric is for the sales organization and the OEM relationship, and it trades away the resilience that comes from a strong absorption base: iron-led growth without product support discipline leaves the dealership more levered to the cycle than before it grew. It sits below Service Labor Revenue because units sold measures transactions while labor revenue measures the recurring tail those transactions create.
How we ranked these
Ranked by weighting three factors: direct impact on dealership operating income (absorption, product support gross profit), measurability from existing DMS and OEM data, and durability across the construction cycle. Unit volume and market share were weighted lower because they are lagging and cycle-levered. Each metric was scored on whether a branch manager can act on it inside a month.
Deliberately ignored: vanity metrics with no decision attached, including website traffic, lead counts without conversion, social engagement, and raw revenue totals. Also excluded were metrics requiring data most dealers cannot reconcile cleanly, such as per-machine profitability by serial number. Anything that rewards discounting or fleet aging was down-weighted because it misprices the annuity.
Related questions
Why does absorption outrank units sold as a dealership KPI?
Absorption measures whether parts and service gross profit already covers total operating expense. At 100 percent, machine sales fall almost entirely to operating income. Below it, the dealership is levered to construction cycles and interest rates it cannot control. Units sold says nothing about whether the business survives a soft year.
How should a dealer define customer machine population coverage?
Coverage needs a time boundary to mean anything. Most dealers use trailing-twelve-month parts or service activity above a dollar threshold. A machine that bought one filter eighteen months ago is not covered operationally. The uncovered serial numbers become the conquest list, which is usually larger than expected.
What is a realistic technician billable utilization target?
Targets vary by machine class and territory, but the manipulation surface matters more than the number. Travel, training, warranty administration, and comeback rework must land somewhere. If they vanish from the denominator, utilization looks excellent and tells you nothing actionable about capacity or scheduling.
Why is customer service agreement attach rate a weekly metric?
Attach rate is decided at the point of quote, not in a quarterly review. By the time a quarter closes, agreements were either sold with the machine or lost. Weekly visibility lets managers intervene while deals are still open and lets the quote template carry the agreement as a default line item.
How does rental fleet age affect the other KPIs?
Aging fleets look like cost avoidance and are actually margin destruction. Older units rent at lower rates, break down more, consume service capacity that could be billed externally, and produce weaker used inventory. Utilization targets that ignore fleet age reward the wrong behavior across the whole scorecard.
What reporting cadence keeps a dealership KPI system honest?
Daily for parts counter, work orders, technician clock-in, and rental on-rent. Weekly for units booked, attach rate, and top-customer parts spend. Monthly for absorption, coverage, utilization, and used aging. Quarterly for territory share, renewal pipeline, and benchmark comparison. Every number needs a named owner and a documented action threshold.
Why do iron-led growth strategies fail at equipment dealerships?
Chasing unit volume to satisfy OEM quota grows revenue while parts and service stay flat, so absorption drifts downward. The business becomes more levered to the cycle than before it grew. The tell is a widening gap between unit growth and product support growth over a rolling four-quarter window.
Which metric should a dealer attack first when absorption is short?
Start with technician utilization because it moves fastest and is most often broken. If utilization is healthy but service gross profit is short, the constraint is demand, tracing back to attach rate and coverage. If both inputs are healthy, the problem is the expense base, which is a restructuring conversation.
FAQ
What is product support absorption percentage?
Parts gross profit plus service gross profit, divided by total dealership operating expense, expressed as a percentage. At 100 percent, the parts counter and service bays have paid for the building, IT, sales compensation, and the dealer principal's salary before a single machine leaves the lot.
How many core sales KPIs should a heavy equipment dealership track in 2027?
Nine core metrics cover the business: new and used units sold, parts revenue, service labor revenue, rental revenue, product support absorption, customer machine population coverage, territory market share, technician billable utilization, and customer service agreement attach rate. Absorption is the master number that governs the rest.
Why is the machine sale really an install base acquisition?
A large wheel loader sold into a quarry generates parts and service revenue across an eight-to-ten-year working life that dwarfs the original transaction margin. Undercarriage, ground engaging tools, filters, hydraulic components, and rebuilds form the annuity. The transaction margin is the entry ticket.
What does the AED Cost of Doing Business study benchmark?
The Associated Equipment Distributors publishes an annual study that has become the reference benchmark for absorption and related dealer financial metrics. The industry average has historically sat well below 100 percent while top-quartile dealers clear it. The gap between average and top quartile is the difference between surviving a soft year and posting a loss.
How do you reconcile OEM machine population data with the DMS?
The OEM supplies a serial-number-level list of machines operating in your area of responsibility. The DMS knows which serial numbers bought parts or opened a work order in the trailing twelve or twenty-four months. The intersection is covered population; the difference is the conquest list.
Should internal work orders count as service revenue?
Dealers answer this differently, and either answer is defensible if applied consistently. Internal work on the rental fleet or on used inventory being reconditioned can inflate service revenue if counted carelessly. The rule is to lock the definition before building dashboards and change it only with documented approval.
What is a healthy customer service agreement attach rate?
Healthy rates vary by machine class and territory, but the direction matters more than the absolute number. Attach rate only moves when the agreement is priced into the machine quote as a default line item the customer must actively remove. Measuring it monthly and exhorting the sales team does not move it.
How long does it take to stand up a working KPI system?
Roughly a quarter. The first month goes to definitions and data reconciliation, where most implementations fail. The second month is branch dashboards and intervention on the two weakest branches. The third month is the rental fleet plan, territory share scorecard, and the standing review cadence.
What is the biggest mistake dealers make with KPI reporting?
Accumulating reports without action thresholds. Every recurring number needs a named owner and a documented trigger. Absorption below target for two consecutive months should trigger a specific intervention, not a discussion. Without thresholds, the review meeting becomes narration.
How does technician shortage affect the KPI system?
You can sell every service agreement in the territory and it converts to nothing if the bays are not staffed. The shortage is demographic, not cyclical. Dealers running apprenticeship programs and technical college relationships carry capacity when demand arrives; reactive hirers stay permanently behind.
Sources
- https://www.aednet.org/
- https://www.equipmentworld.com/
- https://www.constructionequipment.com/
- https://www.forconstructionpros.com/
- https://www.rentalmanagementmagazine.com/
- https://www.dieselprogress.com/
- https://www.agc.org/
- https://www.bls.gov/ooh/installation-maintenance-and-repair/
Related on PULSE
This page will be disappearing soon. Save it to your device for $1 — or read it free while it is here.
@Kory-White- · if Venmo asks, the last 4 of my number are 2012
This page is gone.
This one is off the shelf now. $1 keeps it on your phone for good — the whole page, pictures and diagrams included.
 pulse-industry-kpisTop 10 Sales KPIs for Industrial Wastewater Treatment Equipment & Systems in 2027
 pulse-industry-kpisTop 10 Sales KPIs for Commercial Hardware Distribution in 2027
 pulse-industry-kpisTop 10 Sales KPIs for Commercial Marketing Agency in 2027
 pulse-industry-kpisTop 10 Sales KPIs for Architectural Hardware Specification Consulting in 2027
 pulse-industry-kpisTop 10 Sales KPIs for Online Travel Agency (OTA) in 2027
 pulse-industry-kpisTop 10 KPIs for Chiropractic Practices in 2027
 pulse-industry-kpisTop 10 Sales KPIs for Industrial Tank & Silo Manufacturing in 2027
 pulse-industry-kpisTop 10 KPIs for Roofing Contractors in 2027
 pulse-industry-kpisTop 10 Sales KPIs for Commercial Tree Care & Arboriculture in 2027
 pulse-industry-kpisTop 10 Sales KPIs for Commercial Paving Contracting in 2027