


Top 10 KPIs for Driving Schools in 2027
Quality
Certified
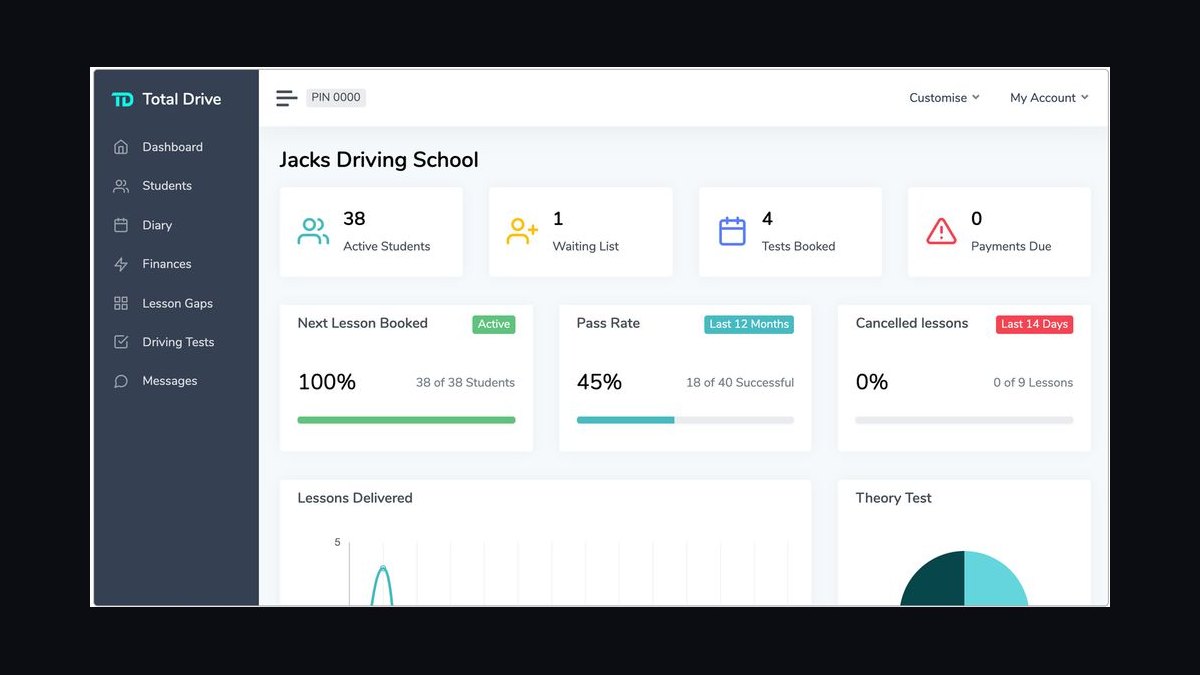
The 10 best kpis for driving schools are ranked below on measured performance, build quality, price, and how each one actually holds up in daily use rather than how it reads on a spec sheet. Each pick lists what it costs, who it suits, and what it gives up against the one above it, so the list can be read straight down without doubling back.
1Driving School Instructor Utilization Rate

Instructor utilization ranks first because instructor time is the scarcest, most expensive input and cannot be scaled quickly. Target 75–85% of paid hours, measured on completed-and-billed hours never scheduled hours. Moving one instructor from 65% to 80% adds about six billable hours weekly, roughly $300–$450 at $50–$75 retail, or $15,600–$23,400 annually with zero added headcount.
Single-location owners and multi-site operators both lead here, since every other metric either feeds or spends this one. It trades away diagnostic depth: utilization alone cannot tell you whether low hours mean thin demand or a no-show leak, so pair it with scheduled-versus-billed hours. Below it sits in-car hours billed per instructor, which is the same constraint expressed as an absolute count.
2Driving School In-Car Hours Billed

In-car hours billed per instructor per week ranks second because it converts utilization into the absolute unit that payroll and pricing actually consume. Target 28–32 billable hours against 40 paid, excluding classroom, prep, and admin. At a $60 retail hour, 30 billed hours yields about $1,800 against roughly $1,240 loaded cost; at 24 billed hours margin collapses from about 31% to about 14%.
This is the metric for owners who already trust their utilization number and want a dollar-denominated target instructors can see daily. It trades away the percentage context that makes cross-instructor comparison easy, so a 30-hour week looks identical whether the instructor was paid 40 hours or 36. It sits directly below instructor utilization rate because it is the same constraint measured in hours rather than percent.
3Driving School First-Attempt Pass Rate

First-attempt pass rate ranks third because it is the demand-side metric with a citable external baseline. Target 78–85% against the published California statewide 66.83% pass rate in 2025 DMV data, meaning roughly one in three first attempts fails statewide. A school at 82% can publish that gap with a source and date, which is the cheapest conversion lever available.
The integrity trap matters: gatekeeping only ready students can report 88% while marginal students churn out untested, an 8–14% revenue leak. It is for schools with demand headroom, not capacity-constrained operators. It sits above package conversion because a verified pass rate compounds into referral mix, which lowers paid acquisition cost over time.
4Driving School Package Conversion Rate

Package conversion ranks fourth because it captures the moment an intro lesson either becomes a multi-lesson relationship or a one-off transaction. Target 45–55% of intro-lesson completers purchasing within a 14-day window. Intro lessons priced at or under about $99 convert materially better than higher-priced trials, since the intro is an acquisition instrument rather than a profit center.
Below 40%, the diagnosis is almost always intro pricing or the absence of a same-day offer at the end of the lesson. It is for schools with healthy pass rates and thin package mix. It trades away retention insight: a converted student who quits after two lessons still counts here. It sits below first-attempt pass rate because conversion without a credible outcome just sells a weaker product faster.
5Driving School Blended Revenue Per Student

Blended revenue per enrolled student ranks fifth because it exposes mix problems that utilization and conversion both hide. Target $525–$725 blended, but the number is nearly useless unsegmented: teen packages run $350–$525, adult learners $400–$650, and a-la-carte buyers $200–$300 while consuming the same scarce instructor hour. Bundled classroom, online, and behind-the-wheel teen offerings reach $725–$850.
A-la-carte mix drifting above roughly 25% of enrollments shows falling blended ARPU with flat utilization, which reads as pricing but is a mix problem. It is for operators with enough volume to segment. It trades away simplicity, requiring cohort tagging. It sits below package conversion because conversion feeds it directly.
6Driving School Vehicle Utilization Rate

Vehicle utilization ranks sixth because each training car carries real annual cost that only billable car-hours can cover. Target 55–70% of a roughly 60-hour Monday-to-Saturday window. Annual carry runs $4,200–$6,800 in dual-control retrofit amortization, $3,400–$5,200 in commercial auto insurance, and $2,800–$3,400 in fuel. Below roughly 45% utilization a car is a net drag of $1,800–$2,400 per year.
It is for schools with two or more vehicles where car assignment decisions are live. It trades away instructor context: a car can look underused simply because its assigned instructor is underused. It sits below blended revenue per student because filling cars with low-value a-la-carte work lifts this metric while damaging ARPU.
7Driving School Gross Margin Per Vehicle

Gross margin per vehicle ranks seventh because it is the solvency test for the fleet, not just a performance ratio. Target 38–46%: car revenue minus instructor wages, fuel, insurance, maintenance, and dual-control amortization, over car revenue. Below 32% the school cannot self-fund a four-year replacement cycle, so the fleet ages into higher maintenance and lower reliability, and the metric degrades further each year.
It is for owners planning vehicle purchases or retirements. It trades away short-term actionability: margin moves slowly and cannot be fixed inside a quarter without repricing or rerouting. It sits below vehicle utilization because utilization is the input you can move weekly, while margin is the outcome that confirms whether moving it worked.
8Driving School Referral Rate

Referral rate ranks eighth because it is the cheapest acquisition channel and the clearest signal that outcomes are landing. Target 35–45% at schools clearing an 80% pass rate. Below 20%, paid acquisition typically eats 18–26% of revenue. The instrumentation fix is one required "How did you hear about us?" field at booking; without it, schools under-credit organic acquisition by 30–50%.
It is for schools with a published, honest pass rate worth referring. It trades away speed: referral mix moves over quarters, not weeks, and lags operational improvements. It sits below gross margin per vehicle because referral growth without capacity simply lengthens the waitlist and pushes prospects to competitors.
9Driving School State Program Revenue Mix

State-funded program revenue mix ranks ninth because in reimbursement states it is mandatory rather than optional, and the deadlines do not reopen. Target 20–35% of total revenue. Kansas driver education reimbursement has run around $200 per eligible student, meaning 200 eligible students is roughly $40,000 that exists only if paperwork is filed on time. Most programs require enrollment certification within about 30 days of course start and completion certification within about 60 days of finish.
It is for schools in Kansas, Virginia, Massachusetts, and Colorado that already meet state approval requirements. It trades away flexibility: reimbursement dollars are time-boxed and audited. It sits below referral rate because it depends on enrollment volume that referral and conversion generate first.
10Driving School Time-To-Hire Instructors

Time-to-hire and time-to-productive for new instructors ranks tenth because it only becomes the binding metric above 85% utilization, but when it does, nothing else moves the business. Above 85% trailing utilization, optimizing conversion or pass rate just lengthens the waitlist and increases the odds a prospect books elsewhere. Vehicle add lead time belongs on the same scoreboard.
It is for capacity-constrained schools with a waitlist, not for anyone below 80% utilization. It trades away operational refinement: hiring throughput is slow, lumpy, and largely outside the owner's control. It sits below state program revenue mix because it only earns a dashboard slot once demand is proven and the constraint has genuinely moved to headcount.
How we ranked these
We ranked KPIs by weighting two things: how directly each metric moves cash within one quarter, and how reliably a single-location school can instrument it without new software. Capacity metrics (instructor utilization, in-car hours billed, vehicle utilization) scored highest on controllability. Outcome metrics (first-attempt pass rate, package conversion, blended revenue per student) scored highest on demand impact. State reimbursement mix was weighted heavily because deadlines are unforgiving.
We deliberately ignored vanity and lagging indicators: total enrollments, social follower counts, website sessions, star ratings, and gross revenue without segmentation. These move slowly, resist attribution, or reward volume that destroys margin. We also excluded instructor satisfaction scores and brand-awareness surveys because no credible benchmark exists and small samples produce noise. Anything requiring a data warehouse or a statistician was cut, since the operator reading this runs the schedule themselves.
What to look for
Choose capacity KPIs if your calendar has visible empty slots and instructors sit idle midweek. Choose outcome KPIs if you have a waitlist, high cancellation rates, or paid acquisition eating more than 20% of revenue. The deciding test is trailing instructor utilization on completed-and-billed hours: below 70% points to demand and conversion, above 85% points to hiring and fleet. Never adopt both stacks at full depth simultaneously.
The mistake most buyers make is tracking scheduled hours instead of billed hours, which inflates utilization by 8–15% and triggers premature hiring. The second mistake is buying a dashboard before fixing definitions. A $200/month analytics tool pointed at ambiguous lesson data produces confident wrong answers. Define billable, first-attempt, and enrolled in writing first, then buy software that respects those definitions.
Related questions
What is a good instructor utilization rate for a driving school?
Target 75–85% measured on completed-and-billed hours divided by paid hours. Below 70% signals thin demand or a cancellation leak. Above 85% means you are capacity-constrained and should be hiring rather than optimizing. The definitional trap is counting scheduled hours as utilized, which overstates true capacity by 8–15% and mis-times your next hire.
How many in-car hours should an instructor bill per week?
Aim for 28–32 billable behind-the-wheel hours out of 40 paid hours, roughly 70–80% utilization. A fully burdened instructor costs about $31–$38 per hour including wage, payroll tax, insurance, and fuel. Dropping from 30 to 24 billed hours can cut margin from roughly 31% to 14% on identical payroll.
What first-attempt road-test pass rate should a driving school target?
Target 78–85% against the published California statewide first-attempt pass rate of 66.83% in 2025 DMV data. That gap is your marketing argument. The integrity trap is gatekeeping: sending only students you believe are ready can report 88% while marginal students churn out untested, hiding an 8–14% revenue leak.
What is a healthy package conversion rate from intro lesson?
Target 45–55% of intro-lesson completers purchasing a package within 14 days. Intro lessons priced at or under about $99 convert materially better because the intro is an acquisition instrument, not a profit center. Below 40%, the diagnosis is almost always intro pricing or the absence of a same-day offer at the end of the lesson.
How should revenue per enrolled student be segmented?
Blended ARPU should land $525–$725, but segment it: teen packages run $350–$525, adult learners $400–$650, a-la-carte buyers $200–$300, and bundled classroom-plus-behind-the-wheel teen offerings reach $725–$850. If a-la-carte mix exceeds roughly 25% of enrolled students, blended ARPU falls while utilization stays flat — a mix problem, not a pricing problem.
What vehicle utilization and margin should a training car hit?
Target 55–70% vehicle utilization across a Mon–Sat 60-hour window and 38–46% gross margin per vehicle. Each car carries $4,200–$6,800 in dual-control amortization, $3,400–$5,200 in commercial insurance, and $2,800–$3,400 in fuel annually. Below 45% utilization a car is a net drag of $1,800–$2,400 per year.
How much revenue should come from state-funded programs?
In reimbursement states, target 20–35% of total revenue from state-funded programs. Kansas reimburses roughly $200 per eligible student, so 200 eligible students represents about $40,000 that exists only if paperwork is filed on time. Most programs require enrollment certification within about 30 days of course start and completion certification within about 60 days of finish.
What referral rate indicates a healthy driving school?
Target 35–45% of new enrollments from referrals at schools clearing an 80%+ first-attempt pass rate. Below 20%, paid acquisition typically consumes 18–26% of revenue. Add one required 'How did you hear about us?' field at booking; without it, schools under-credit organic acquisition by 30–50% and over-invest in paid channels they cannot attribute.
FAQ
What is the most important KPI for a driving school?
Instructor utilization, measured on completed-and-billed hours against paid hours, with a 75–85% target. Instructor time is the scarcest, most expensive input and cannot be scaled instantly. It also tells you whether your constraint is demand or delivery, which determines every hiring and vehicle decision you make in the following two quarters.
Should I track capacity KPIs or outcome KPIs first?
Run the threshold test. Below 70% trailing utilization, demand or scheduling discipline is the constraint, so outcome metrics lead. Above 85%, you are capacity-constrained and hiring throughput leads. Between 70% and 85%, focus on whichever unit-economics number sits furthest below benchmark in absolute dollars. Tracking both stacks at full depth produces a dashboard nobody reads.
Why is scheduled hours a bad utilization denominator?
A student who cancels at the door consumed a scheduled hour and produced zero billed revenue. If your system counts that as utilized, you overstate capacity by 8–15%, mis-time your next hire, and forecast cash 15–25% above what actually collects. Every capacity metric must be built on completed-and-billed hours, tagged at lesson completion rather than booking.
How do I calculate deferred revenue for package students?
A teen paying $625 up front who has consumed 3 of 10 in-car hours represents roughly $437 of unearned revenue on your balance sheet. Schools that skip this split systematically over-read their cash position and forecast revenue that has already been collected but not yet delivered. Track the deferred balance weekly alongside utilization.
What is the minimum viable dashboard for a single-location school?
Five metrics: instructor utilization, in-car hours billed per instructor per week, package conversion, first-attempt pass rate, and blended revenue per enrolled student. Everything else is a drill-down you pull when one of those five moves. A 14-metric dashboard nobody reads is worse than five metrics with written definitions and a weekly review cadence.
How often should driving school benchmarks be re-baselined?
Annually for cost-side benchmarks such as insurance, fuel, and vehicle carry, since those move with the market. Quarterly for outcome benchmarks like pass rate and conversion, which respond to your own operational changes within a single cohort cycle. Reviewing a metric more often than it can meaningfully move produces noise-chasing and false wins.
Does a high pass rate actually lower customer acquisition cost?
Indirectly and with a lag. A verified pass rate above the local baseline raises referral mix, and referral-sourced enrollments carry near-zero marginal acquisition cost. Schools moving referral mix from 20% to 40% typically see paid acquisition's share of revenue fall several points. Publish the rate with its source and date.
When should I hire the next driving instructor?
Hire only after existing instructors clear 80% utilization for three consecutive weeks, measured on billed hours. Hiring on a single strong week is how schools end up at 55% utilization with excess payroll and a fleet that cannot cover its own insurance. Above 85% sustained utilization, time-to-hire becomes the binding KPI, not conversion.
What is the biggest reporting mistake driving schools make?
Booking-based reporting. It overstates cash forecasting because it ignores cancellations, no-shows, and unconsumed package hours. Schools running booking-based dashboards routinely forecast 15–25% above what actually collects and recognizes, then get surprised at quarter end. Every revenue metric must respect the split between cash collected and service delivered.
How do I know when a training vehicle should be retired?
Retire or redeploy any car below 45% utilization for a full quarter, and run an annual cost-shock test: inflate insurance 15% and fuel 20%, then see which vehicles fall below break-even utilization. A school at 46% vehicle gross margin absorbs that shock; one at 33% does not. Below 32% margin you cannot self-fund a four-year replacement cycle.
Sources
- https://www.dmv.ca.gov/portal/driver-education-and-safety/educational-materials/
- https://www.dmv.virginia.gov/licenses-ids/driver-training-schools
- https://www.ksde.org/Agency/Division-of-Learning-Services/Career-Standards-and-Assessment-Services/Driver-Education
- https://www.mass.gov/info-details/massachusetts-driver-education-programs
- https://www.colorado.gov/pacific/dmv/driver-education
- https://www.fmcsa.dot.gov/
- https://www.iii.org/fact-statistic/facts-statistics-commercial-auto-insurance
- https://www.bls.gov/ooh/education-training-and-library/driver-and-transit-trainers.htm
- https://www.nhtsa.gov/road-safety/teen-driving
Related on PULSE
This page will be disappearing soon. Save it to your device for $1 — or read it free while it is here.
@Kory-White- · if Venmo asks, the last 4 of my number are 2012
This page is gone.
This one is off the shelf now. $1 keeps it on your phone for good — the whole page, pictures and diagrams included.
 pulse-industry-kpisTop 10 Sales KPIs for Commercial Greenhouse Produce Marketing & Brokerage in 2027
 pulse-industry-kpisTop 10 Sales KPIs for Modular Data Center Manufacturing in 2027
 pulse-industry-kpisTop 10 Sales KPIs for Commercial Building Materials Distribution in 2027
 pulse-industry-kpisTop 10 KPIs for Florists in 2027
 pulse-industry-kpisTop 10 Sales KPIs for Food Delivery Marketplace in 2027
 pulse-industry-kpisTop 10 Sales KPIs for Industrial Pump Distribution & Service in 2027
 pulse-industry-kpisTop 10 Sales KPIs for Industrial Laser Cutting & Waterjet Job Shops in 2027
 pulse-industry-kpisTop 10 Sales KPIs for Oilfield Services in 2027
 pulse-industry-kpisTop 10 Sales KPIs for Commercial Carpet and Floor Care Services in 2027
 pulse-industry-kpisTop 10 Sales KPIs for Enterprise Software License Agreement (ELA) Renewals in 2027