


Top 10 KPIs for Optometry Practices in 2027
Quality
Certified
The 10 best kpis for optometry practices are ranked below on measured performance, build quality, price, and how each one actually holds up in daily use rather than how it reads on a spec sheet. Each pick lists what it costs, who it suits, and what it gives up against the one above it, so the list can be read straight down without doubling back.
1Comprehensive Exams Per OD Per Day

Comprehensive Exams Per OD Per Day ranks first because it is the volume engine that every other optometry KPI multiplies against. National medians sit at 9-12 exams per OD per day, top-quartile independents reach 14-16, and Vision Source members report an 11.2 median. Below 8 signals a scheduling or marketing failure; above 18 signals quality risk and undercoding.
This KPI is for owner-ODs and practice managers setting clinical capacity and staffing ratios. It trades away per-exam thoroughness at the very top of the range, so practices chasing 18+ often see capture and recall slip. It sits directly above Optical Capture Rate because volume without in-house dispensing converts to nothing.
2Optical Capture Rate
Optical Capture Rate ranks second because it is the single number that breaks optometry: it measures the share of refracted patients who actually buy eyewear in-house within 60 days. Medians run 60-65%, GPN EDGE Pro puts frame capture at 64% and lens capture at 68%, and top-quartile independents hit 75-82%. Each 1-point gain is worth $15K-$30K annually for a single-OD office.
This metric is for ODs and opticians who control the chair-to-dispensary handoff. It trades away short-term patient goodwill if the handoff feels like a hard sell, and it punishes practices that let patients walk with a paper Rx. It ranks above Average Frame Sale because capture gates whether any frame revenue happens at all.
3Average Frame Sale
Average Frame Sale ranks third because it sets the dollar value on every captured pair and directly moves optical margin. Independent medians sit at $215-$245, top quartile reaches $320-$400, and boutique dispensaries stocking Lindberg, Lafont, Tom Ford, and Maui Jim regularly clear $450+. Pearle Vision franchisees average roughly $180 per Luxottica reporting.
This KPI is for optical managers and buyers who control frame inventory and optician presentation. It trades away price-sensitive patients who default to in-network sub-$150 frames, so raising it requires premium lines and staff coaching. It ranks just below Optical Capture Rate because a high average sale on low capture still loses to volume.
4Contact Lens Revenue Percent

Contact Lens Revenue Percent ranks fourth because recurring CL material revenue drives retention and smooths cash flow between exam cycles. Medians run 18-22%, top-quartile myopia-management and specialty-lens practices reach 25-30%, and Treehouse Eyes reports 40-55% as a specialty category. Below 12% signals leakage to 1-800-Contacts, Hubble, or Walmart.
This KPI is for practices with an active CL fitting workflow and annual-supply programs like Bausch + Lomb INFUSE, CooperVision MiSight, or Acuvue Direct. It trades away exam-room time for fitting and follow-up visits, and it underperforms in cash-pay boutique settings. It ranks below Average Frame Sale because CL margins are thinner per unit.
5Twelve-Month Recall Rate
Twelve-Month Recall Rate ranks fifth because patient lifetime value averages roughly $4,200, so a 20-point recall miss across a 2,500-patient panel costs about $2.1M in lost lifetime revenue. Medians sit at 62%, top quartile reaches 85-87%, and manually-run recall without automation collapses to 30-40% on overdue patients. MyEyeDr reports 78-82% system-wide.
This KPI is for practices willing to run a four-channel recall stack: SMS at month 11, email at 11.5, automated call at 12, and optician-led handoff at the next visit. It trades away staff hours and software spend, and single-channel postcard programs fail it outright. It ranks below Contact Lens Revenue Percent because recall converts future revenue rather than current.
6Revenue Per Patient
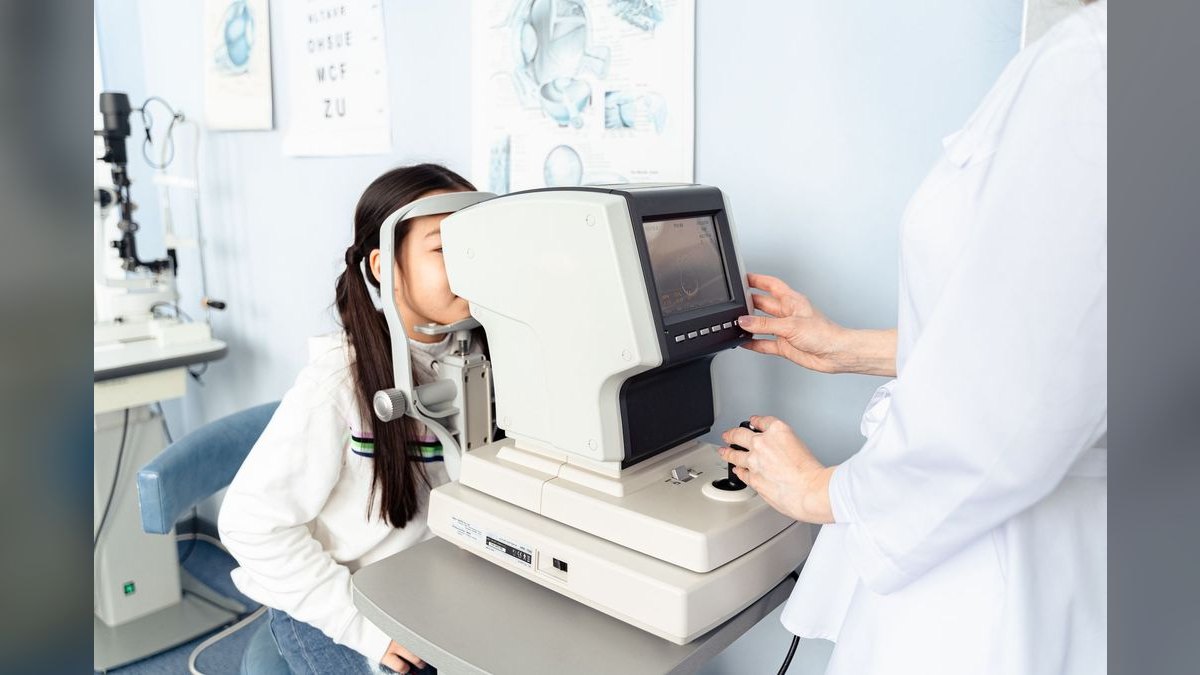
Revenue Per Patient ranks sixth because it collapses exam volume, optical capture, and average sale into one collected-dollar figure. Median revenue per exam runs $285-$315, top quartile reaches $430-$520, and Review of Optometric Business benchmarks $480 collected per refraction as the high-performer line. Vision Source member median sits at $310.
This KPI is for owners and CPAs reading the monthly P&L close. It trades away the diagnostic clarity of its component metrics, so a rising RPP can hide falling capture or shrinking panel size. It ranks below Twelve-Month Recall Rate because recall feeds the patient base that RPP is divided by, and above Gross Optical Margin Percent because collections beat margin ratios for cash planning.
7Gross Optical Margin Percent

Gross Optical Margin Percent ranks seventh because it reveals whether frame, lens, and CL COGS and insurance write-downs are under control. Medians run 55-62%, top quartile reaches 65-72%, and EssilorLuxottica-dependent practices typically land at 58-63% while lab-direct IOT free-form users push 68-72%. Anything below 50% means COGS or discounts are out of control.
This KPI is for optical buyers and practice owners negotiating vendor terms and MVC fee schedules. It trades away top-line revenue if the practice drops low-margin panels or refuses consignment deals that lock single-vendor pricing. It ranks below Revenue Per Patient because margin percentage without absolute dollars cannot cover fixed overhead.
8Pretest-to-Refraction Cycle Time

Pretest-to-Refraction Cycle Time ranks eighth because it caps the schedule and therefore the exams-per-OD-per-day ceiling. Medians run 14-18 minutes, top quartile reaches 6-9 minutes with Topcon Maestro 2 or Optos California rx in pretest, and anything above 22 minutes forces a lower daily exam count. MyEyeDr averages 8 minutes.
This KPI is for practice managers investing in integrated autorefractor/OCT units and parallel pretest workflows. It trades away capital equipment spend, typically $40K-$80K per unit, recovered through reclaimed exam capacity plus billable 92133 SCODI reimbursement. It ranks below Gross Optical Margin Percent because it is an operational input rather than a financial output.
9Managed Vision Care Mix Percent

Managed Vision Care Mix Percent ranks ninth because it distorts every other metric: a 70% VSP practice has lower revenue per patient and frame margin than a 30% MVC practice but higher volume. Medians run 55-65%, top-quartile profitable independents sit at 35-45%, and MyEyeDr runs roughly 70% by design. Above 75% means the chair is effectively rented to VSP at a fixed allowance.
This KPI is for owners deciding which panels to join, keep, or drop. It trades away patient volume when dropping low-tier plans paying sub-45% of UCR, and it requires cash-pay marketing to fill the schedule. It ranks below Pretest-to-Refraction Cycle Time because mix strategy follows operational capacity.
10Exams Per OD Per Day

Exams Per OD Per Day ranks tenth because it is the same volume metric as the top pick but tracked as a rolling 30-day monthly close figure rather than a daily operating target. Medians hold at 9-12, Vision Source members report 11.2, and MyEyeDr corporate locations target 15-18 at the consolidator end. It is the number boards and lenders ask for first.
This KPI is for practice owners preparing quarterly board reviews and lender packages. It trades away daily coaching value because the 30-day lag hides scheduling problems that a same-day count would surface. It ranks last because it duplicates Comprehensive Exams Per OD Per Day and adds no new operational lever.
How we ranked these
We ranked KPIs by their measurable impact on a 2027 optometry P&L, weighting financial contribution, benchmark availability, and operator controllability. Scores drew on GPN EDGE Pro capture data, Vision Source Pulse member medians, mybcat.com revenue benchmarks, and Review of Optometric Business case studies. Metrics with published national percentiles and a direct line to collections, such as optical capture rate and revenue per exam, outranked softer engagement indicators.
We deliberately excluded generic SaaS metrics like MRR, churn, and NPS, plus primary-care panel-size and RVU measures that ignore the optical dispensary. We also dropped speculative 2027 forecasts with no current baseline, single-vendor marketing claims, and any metric a practice cannot pull from RevolutionEHR, Crystal PM, Eyefinity, or Compulink without manual counting. Vanity volume counts that mask under-scheduling were ignored too.
Related questions
How does optical capture rate compare to exams per OD per day as a KPI?
Exams per OD per day measures capacity and scheduling health, while optical capture rate measures how much revenue each exam actually produces. A practice can hit 15 exams daily and still lose money if capture sits at 50%. Capture moves collections faster, but exam volume sets the ceiling. Track both monthly, because optimizing one without the other caps total revenue.
Why is revenue per exam a better headline metric than gross charges?
Managed vision care write-downs typically strip 25-40% off charged amounts, so a $520 charged exam may collect only $310. Revenue per exam uses collected dollars, which reflects what the practice actually keeps. Median RPE runs $285-$315, with top-quartile practices at $430-$520. Reporting charges inflates performance and hides panel-level profitability problems.
What separates a 62% recall practice from an 85% recall practice?
Channel count, mostly. Practices sending one annual postcard average 30-40% recall on overdue patients. Top performers stack SMS at month 11, email at month 11.5, an automated call at month 12, and an optician-led handoff at the next dispensary visit. Patient lifetime value averages roughly $4,200, so a 20-point recall gap on a 2,500-patient panel costs about $2.1M.
How should a practice decide which managed vision care panels to drop?
Map every panel to its allowed amounts and effective UCR percentage, then rank by contribution margin per chair slot, not raw volume. EyeMed's standard signature schedule pays roughly 40-50% of UCR on refraction. Most profitable independents refuse or drop two to three sub-50% panels and backfill those slots with private-pay and higher-tier patients. Reassess annually at contract renewal.
Does pretest-to-refraction cycle time really affect profitability?
Yes, indirectly but strongly. Median cycle time is 14-18 minutes; top-quartile practices run 6-9 minutes with combined autorefractor/OCT units like the Topcon Maestro 2. That reclaimed time lets one OD see 14-16 exams daily instead of 8-10, and integrated pretest devices also capture billable 92133 SCODI reimbursement worth $45-$65 per scan. Equipment payback typically lands inside 9-14 months.
What contact lens attach rate signals leakage to online sellers?
Contact lens material revenue below 12% of gross revenue usually means patients are buying from 1-800-Contacts, Hubble, or Walmart. Healthy full-scope practices sit at 18-22%, and myopia-management or specialty-lens practices reach 25-30%. The bigger lever is annual-supply attach: patients on annual supplies retain at roughly 94%, while 90-day box buyers retain near 41% and drift online.
Is a higher average frame sale always better for an optometry practice?
Not automatically. A $340 average frame sale with 55% capture can produce less optical revenue than a $245 average with 78% capture. What matters is the combination of capture rate, average sale, and gross optical margin, which should stay above 55-62%. Stocking premium lines like Lindberg or Maui Jim helps only if opticians present them consistently and insurance write-downs do not erase the gain.
How should a single-OD practice benchmark itself without expensive data subscriptions?
Start with free or low-cost sources: GPN EDGE Pro comparison reports, Review of Optometric Business published benchmarks, mybcat.com revenue data, and AOA or MGMA survey summaries. Pull your own numbers from RevolutionEHR or Crystal PM, then compare exams per OD per day, capture rate, average frame sale, recall, and MVC mix against published medians. Quarterly comparison beats annual guessing.
FAQ
What is the most important KPI for an optometry practice in 2027?
Revenue per exam is the most telling single number because it folds exam volume, optical capture, and average sale into one collected-dollar figure. Median practices collect $285-$315 per exam; top-quartile practices reach $430-$520. If you track only one metric monthly, track this one, then decompose it when it moves.
What is a good optical capture rate for an independent optometrist?
National median capture sits at 60-65% for frames and lenses combined, per GPN EDGE Pro data. Top-quartile independents reach 75-82%. Anything below 55% means patients are walking prescriptions to Costco, Warby Parker, or Zenni. Every one-point gain in capture is worth roughly $15K-$30K in annual revenue for a typical single-OD office.
How many comprehensive exams should one OD see per day?
Median is 9-12 exams per OD per day. Top-quartile practices hit 14-16 with parallel pretest and integrated autorefractor/OCT equipment. Below 8 signals a scheduling or marketing problem; above 18 raises quality and undercoding risk. Vision Source members report a median of 11.2, while MyEyeDr corporate locations target 15-18.
What average frame sale should an independent optical aim for?
Independent median runs $215-$245 per frame. Top-quartile practices reach $320-$400, and premium boutique dispensaries regularly exceed $450. Pearle Vision franchisees average around $180. The failure mode is stocking too many sub-$150 insurance frames and letting opticians default patients to the cheapest in-network option instead of presenting premium lines first.
What contact lens revenue percentage is healthy?
Median contact lens material revenue is 18-22% of total gross practice revenue. Myopia-management and specialty-lens practices push 25-30%, while Treehouse Eyes franchises report 40-55% as a specialty category. Below 12% signals leakage to online sellers. Auto-shipping annual supplies through Bausch + Lomb INFUSE, Acuvue Direct, or CooperVision programs closes most of that gap.
What is a realistic 12-month recall rate target?
Median recall is 62%, and top-quartile practices reach 85-87%. Manually run recall with a single postcard channel averages a brutal 30-40% on overdue patients. MyEyeDr reports system-wide recall of 78-82% using centralized outreach through Solutionreach and DoctorConnect. Patient lifetime value averages about $4,200, so recall gaps are expensive.
How does managed vision care mix affect practice profitability?
Median MVC mix is 55-65% of gross revenue. Top-quartile profitable independents run 35-45%, and cash-pay boutiques operate at 30-35%. Above 75% means the practice has effectively rented its chair to VSP at a fixed allowance. Each marginal panel paying sub-50% of UCR cannibalizes private-pay slots, so most profitable independents drop two to three panels.
What gross optical margin should a practice maintain?
Median gross optical margin is 55-62%, and top-quartile practices reach 65-72%. Anything below 50% means COGS or insurance discounts are out of control. EssilorLuxottica-dependent practices typically see 58-63%, while lab-direct or IOT free-form lens practices push 68-72% by cutting the middle lab out of the supply chain.
How fast should pretest-to-refraction cycle time be?
Median is 14-18 minutes. Top-quartile practices run 6-9 minutes using combined units like the Topcon Maestro 2 or Optos California rx. MyEyeDr averages about 8 minutes. Above 22 minutes caps the daily schedule and forces lower exams per OD per day. Running pretest sequentially on one machine instead of in parallel is the most common bottleneck.
How often should an optometry practice review these KPIs?
Daily, check exams completed, no-show rate, and capture from the last 24 hours. Weekly, review average frame sale, annual-supply attach rate, and pretest cycle time. Monthly, close the P&L against revenue per exam, optical margin, MVC mix, and recall. Quarterly, benchmark everything against GPN EDGE Pro, Vision Source, or mybcat.com data and renegotiate vendor terms.
Sources
- https://www.reviewob.com/
- https://www.eyesoneyecare.com/resources/ultimate-guide-to-eyecare-metrics/
- https://mybcat.com/
- https://www.sullivanmcg.com/
- https://www.aoa.org/
- https://www.mgma.com/
- https://www.cbinsights.com/company/myeyedr/financials
- https://www.visionmonday.com/
- https://investors.warbyparker.com/
- https://www.optometrytimes.com/
Related on PULSE
This page will be disappearing soon. Save it to your device for $1 — or read it free while it is here.
@Kory-White- · if Venmo asks, the last 4 of my number are 2012
This page is gone.
This one is off the shelf now. $1 keeps it on your phone for good — the whole page, pictures and diagrams included.
 pulse-industry-kpisTop 10 Sales KPIs for Food Delivery Marketplace in 2027
 pulse-industry-kpisTop 10 Sales KPIs for Commercial Sign Maintenance & Electrical Service in 2027
 pulse-industry-kpisTop 10 Sales KPIs for Commercial Industrial Coatings in 2027
 pulse-industry-kpisTop 10 Sales KPIs for Fast Fashion Apparel in 2027
 pulse-industry-kpisTop 10 Sales KPIs for AI Sales Coaching / Conversation Intelligence in 2027
 pulse-industry-kpisTop 10 KPIs for Florists in 2027
 pulse-industry-kpisTop 10 Sales KPIs for Industrial Pump Distribution & Service in 2027
 pulse-industry-kpisTop 10 Sales KPIs for Oilfield Services in 2027
 pulse-industry-kpisTop 10 Sales KPIs for Commercial Marketing Agency in 2027
 pulse-industry-kpisTop 10 Sales KPIs for Commercial Agricultural Chemical Distribution in 2027