
Average Revenue Per User in SaaS: Monthly Recurring Revenue vs. Annual Contract Value in 2027
 Curated byKory White · Fractional CRO · Maryland
 PULSEKNOWLEDGE LIBRARY
Quality
Certified

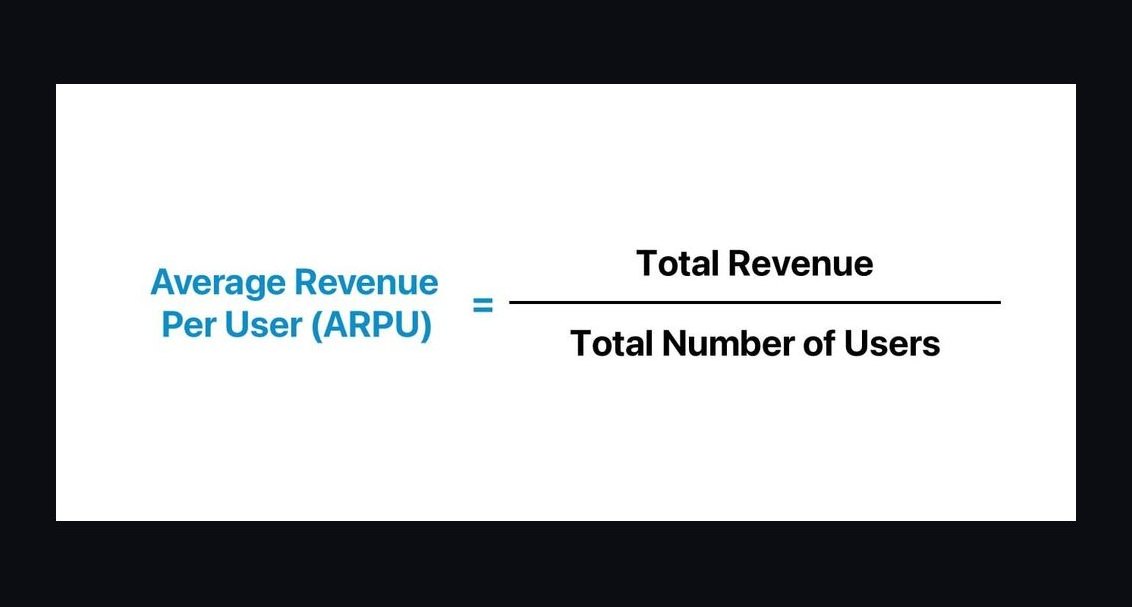
ARPU in SaaS splits into two metrics that answer different questions. MRR-based ARPU (total monthly recurring revenue ÷ active accounts) tracks monthly unit economics, churn exposure, and expansion velocity. ACV-based ARPU (annualized contract value ÷ contracted customers) tracks deal quality and renewal risk. Report both, labeled separately, never blended.
What each metric actually measures
The two calculations look similar on a spreadsheet and diverge completely in what they tell you. MRR-based ARPU divides total monthly recurring revenue by the count of active paying accounts. It is a real-time number: it moves the day a customer downgrades, the day a seat is removed, the day a self-serve trial converts. Because it is denominated in months, it is sensitive to short cycles — monthly churn, monthly expansion, monthly plan mix.
ACV-based ARPU divides total annual contract value by the number of customers holding annual (or multi-year, normalized to twelve months) commitments. It is a slower number by construction. It barely moves inside a quarter because the underlying contracts do not move inside a quarter. What it captures is the quality of what your sales motion lands: how large a commitment a customer is willing to sign for, up front, before they have twelve months of value evidence.
That difference in tempo is the whole point. A company with $1M in MRR across 10,000 accounts has a $100 MRR ARPU. If 500 of those customers sit on annual contracts totaling $2M in ACV, the ACV ARPU is $4,000. Neither number is wrong; they describe different populations with different behaviors. The 9,500 monthly accounts can leave in thirty days. The 500 annual accounts are locked for a year and will make a single, high-stakes renewal decision.

Practitioners get burned when they pick one number and treat it as "the" ARPU. Two traps show up repeatedly. First, quoting ACV ARPU to a board while the monthly base is bleeding — the headline looks strong, the cash flow does not. Second, quoting MRR ARPU while a large annual cohort renews next quarter — the number looks stable right up until a concentrated renewal cliff arrives. The metric is only useful when the denominator is stated: ARPU across which customers, over what period, including or excluding what revenue types.
One definitional rule holds across both: ARPU includes recurring revenue only. Setup fees, implementation services, professional services, training, and hardware are excluded. This matters more than it sounds. A vendor that charges a $15,000 implementation fee on a $30,000 annual subscription will report a wildly inflated ARPU if services get folded in, and the inflated number will not renew. Public SaaS reporting convention keeps services out of subscription revenue precisely because the two behave differently — one recurs, one does not.
The same discipline applies to usage overage. If a customer signs a $24,000 annual contract with a committed floor and routinely consumes $8,000 in overages, you have two legitimate views: contracted ACV ARPU ($24,000) and realized ARPU ($32,000). Both are defensible. Mixing them across periods is not. Pick one for the board metric, disclose which, and keep the other as a diagnostic in the RevOps layer.

Choosing which metric drives which decision
Choosing between the two is a function of billing model, sales motion, and the decision in front of you. Nobody should be picking a single winner. The question is which metric owns which decision, and the answer follows the cycle length of the behavior you are trying to change.
Pricing and packaging decisions on self-serve tiers belong to MRR ARPU. When a plan change lands, monthly revenue per account responds within one or two billing cycles, so you get a clean read. Enterprise pricing decisions belong to ACV ARPU, because the feedback loop runs the length of a sales cycle plus a renewal — typically nine to eighteen months before you know whether a list-price change stuck.
Sales compensation is where the choice does the most damage if it is wrong. Pay a rep on MRR closed and you have told them monthly deals count the same as annual ones — they will close whichever is easiest, which is monthly. Pay on ACV booked and you have told them commitment length matters. Most enterprise-motion companies compensate on ACV or on total contract value with a multi-year multiplier for exactly this reason. If you run a hybrid motion, the honest fix is two comp plans, not one blended metric that satisfies neither.

Customer success staffing follows ACV ARPU almost mechanically. A tiering model built on ACV bands — say, under $10K self-serve/pooled, $10K–$50K one-to-many, $50K–$250K named CSM, above $250K strategic account team — gives you a defensible headcount model. Doing the same tiering on MRR ARPU produces the same tiers with different labels, but it obscures renewal timing, which is the single most useful thing a CSM needs to know.
Investor and board reporting should carry both, always adjacent. The pairing itself is diagnostic: rising ACV ARPU with flat MRR ARPU means you are moving upmarket without changing the self-serve base. Rising MRR ARPU with flat ACV ARPU usually means expansion is happening inside existing accounts before contracts get renegotiated — good news, but it signals that your renewal process is leaving money on the table by not resetting the baseline.
A useful discipline: write down which metric owns each recurring decision before the quarter starts, and put it in the metrics dictionary next to the formula. Half of the ARPU arguments in operating reviews are not disagreements about the number — they are two people using different denominators and neither one saying so.

The numbers behind each side
Concrete ranges make the choice tangible. Treat the following as structural relationships rather than precise industry constants — actual figures vary widely by segment, geography, and year, and any specific benchmark should be pulled from a current source rather than trusted from memory.
Order of magnitude by motion. Consumer and prosumer subscription products typically land MRR ARPU in the single-digit to low-double-digit dollars. SMB B2B tools generally sit in the tens to low hundreds per month. Mid-market B2B commonly runs in the hundreds to low thousands monthly, which translates to annual contract values in the tens of thousands. Enterprise platforms routinely carry six-figure ACVs and, at the top of the market, seven-figure ones. The jumps between these bands are roughly an order of magnitude each, which is why blending segments into one ARPU produces a number that describes no actual customer.
The spread. Define spread as ACV ARPU ÷ (MRR ARPU × 12) for a comparable cohort. A spread of 1.0 means annual customers pay exactly what monthly customers pay over a year. Below 1.0 means you are discounting for the commitment — the common range for an annual prepay discount is roughly 10–20%, producing a spread of 0.80–0.90. Above 1.0 means annual customers are buying more, usually because annual contracts skew toward larger accounts with more seats and more modules.

Here is the part operators miss: a spread of 0.85 is not automatically bad. You are buying twelve months of cash up front and eliminating eleven churn decisions. If your monthly cohort churns at 4% per month, the expected twelve-month survival of a monthly customer is roughly 0.96^12 ≈ 61%. Paying 15% for a commitment that converts a 61% expected retention into something closer to your annual renewal rate is straightforwardly good economics. The discount only becomes a mistake when your monthly churn is already low — if monthly churn is 1%, twelve-month survival is about 89%, and a 15% discount buys you far less.
Churn math that changes the answer. Monthly logo churn compounds brutally. At 2% monthly, annual survival is about 78%. At 5%, about 54%. At 8%, about 37%. This is why a healthy-looking MRR ARPU can coexist with a business that is quietly dissolving: ARPU measures revenue per surviving account and says nothing about how many accounts survive. Always pair it with a retention number. A rising MRR ARPU alongside rising churn is a classic false positive — your cheapest customers are leaving first, which mechanically lifts the average while shrinking the base.
Renewal rates on the ACV side. Gross annual renewal rates in enterprise SaaS commonly sit in the 80s to low 90s as a percentage of expiring ACV, with best-in-class above 90%. Net revenue retention — which adds expansion — is the more informative companion metric, and it can exceed 100% even when gross renewal is below it. If your ACV ARPU is climbing but NRR is flat, the growth is coming from new logos landing bigger, not from existing customers growing. That distinction determines whether you fund sales or customer success next year.

Payback and the CAC link. ARPU only becomes an economic statement when you divide acquisition cost by it. CAC payback in months = CAC ÷ (ARPU × gross margin). At 75% gross margin, a $300 MRR ARPU with $5,400 CAC pays back in 24 months — long for a monthly-billed product where the customer can leave at any point. The same $5,400 CAC against a $36,000 ACV with the same margin recovers inside the first year of contract. This is the clearest reason the two metrics cannot substitute for each other: they imply different acceptable CAC ceilings.
Cohort decay. Blended ARPU hides cohort drift. If the 2025 cohort entered at $180 MRR ARPU and the 2027 cohort enters at $120, the blended number may still look flat because the older, larger cohort dominates the average. Run ARPU by signup cohort at month 1, 6, 12, and 24. Two patterns matter: entry ARPU trending down (a pricing or positioning problem) and in-cohort ARPU trending up (healthy expansion). A cohort whose entry ARPU is falling while in-cohort expansion is strong tells you land-and-expand is working but the land price is too low.
Adjacent-industry sanity check. ARPU is not a SaaS invention, and neighboring industries have already worked through the failure modes. Telecom has reported ARPU for decades and learned to split it by prepaid versus postpaid — the same monthly-versus-committed distinction, with the same lesson that blending the two destroys the signal. Mobile gaming reports ARPDAU (average revenue per daily active user) and separately tracks ARPPU (per *paying* user), because a metric that averages across non-payers describes engagement, not revenue. Streaming services report ARPU per membership by region, because a global average conceals price-tier geography. Every one of these industries independently arrived at the same conclusion: segment the denominator or the metric lies.

Standing it up without breaking the numbers
Implementation fails on definitions far more often than on tooling. Sequence the work so that the definition is locked before anything is automated, because an automated wrong number spreads faster than a manual one.
Step one — write the metric dictionary. For each of MRR ARPU and ACV ARPU, record: the exact numerator (which revenue types are in, which are out), the exact denominator (active paying accounts? contracted customers? seats?), the as-of convention (month-end snapshot or period average), the currency normalization rule, and the treatment of multi-year contracts, mid-term upgrades, and paused accounts. Get finance and RevOps to sign the same page. If your CRM and your billing system disagree on customer count — and they almost always do, because of parent/child account structures — decide now which one is authoritative and document why.
Step two — fix the account hierarchy. This is the unglamorous prerequisite that sinks most ARPU projects. If one enterprise buyer holds six subsidiary records in the CRM, your customer count is inflated sixfold and your ACV ARPU is one-sixth of reality. Roll up to the billing entity or the contracting entity, pick one, and apply it consistently across both metrics. A common compromise: report ARPU at the contracting-entity level for board metrics and at the child-account level for CS workload planning, clearly labeled as two different views.

Step three — separate the populations before you average anything. Build the calculation as segment-first: compute MRR ARPU and ACV ARPU independently for self-serve, SMB, mid-market, and enterprise, then present the blend only as a secondary line. If the blend is the headline, someone will eventually make a pricing decision on it.
Step four — instrument the reporting cadence. MRR ARPU is a weekly number for product, growth, and RevOps; it moves fast enough to warrant that frequency. ACV ARPU is monthly at most for sales and CS, quarterly for the board — reporting it weekly manufactures noise that invites overreaction. The spread is a monthly finance number. Cohort ARPU is a monthly analysis, not a dashboard tile; it needs narrative.
Step five — build the alert rules, not just the charts. A dashboard nobody opens is a rounding error. Useful triggers: MRR ARPU drops more than 5% week over week (usually a downgrade wave or a data pipeline break — check the pipeline first, it is the pipeline more often than you would think); spread falls below 0.75 (discounting has crept past policy); ACV ARPU rises while logo count falls (you are churning small accounts, which may be fine or may be the start of an unaffordable upmarket drift); cohort entry ARPU declines two cohorts in a row.

Step six — reconcile to the financials monthly. Sum(MRR ARPU × account count) should tie to reported recurring revenue within a small tolerance. If it does not, the gap is nearly always one of four things: currency conversion timing, unbilled or trial accounts sitting in the denominator, credits and refunds handled inconsistently, or contracts recognized in finance on a different date than they closed in CRM. Chase the gap every month; a reconciliation that is skipped twice is a reconciliation that is gone.
Sequencing note. Do not attempt the pricing change and the measurement change in the same quarter. If you re-tier plans while simultaneously redefining ARPU, you will not be able to attribute the resulting movement to either. Lock the metric, run one clean quarter of baseline, then change pricing. The discipline costs you ninety days and saves you a year of arguing about attribution.
Where the metric stops being useful
ARPU has real limits, and knowing them prevents overreach. It is an average, and averages are hostile to skewed distributions. In a customer base where the top 5% of accounts generate 40% of revenue — an ordinary shape in B2B SaaS — the mean ARPU sits well above the median customer's actual spend. Report the median alongside the mean, and report the distribution by decile at least quarterly. If the mean is more than roughly twice the median, the average is describing a handful of whales rather than your business.

It is also a lagging measure of pricing power. ARPU tells you what customers paid, not what they would have paid. Willingness-to-pay research, win/loss analysis on price objections, and discount-approval rate data all lead ARPU by a quarter or more. If discount depth is creeping up while ARPU holds steady, the ARPU is being propped up by mix shift and will fall once the mix stabilizes.
Consumption-priced products strain the metric hardest. When revenue scales with usage, a monthly ARPU becomes highly seasonal, and an annual committed ACV understates the account. The workable pattern is a three-line view: committed ACV, trailing-twelve-month realized revenue per account, and the ratio between them. That ratio — realized over committed — is the single best predictor of whether a consumption account will up-commit at renewal. Ratios comfortably above 1.0 are expansion conversations; ratios below 0.7 are renewal risks regardless of how healthy the ACV looks on paper.
Finally, ARPU says nothing about profitability. A high-ACV enterprise account carrying a dedicated CSM, custom SLAs, quarterly business reviews, and a security review every renewal can be less profitable than ten mid-market accounts at a tenth the ACV each. Pair ARPU with cost-to-serve by segment at least annually. The combination is what turns a revenue metric into a business metric, and it is the step most teams skip.
Related questions
How do you calculate ARPU when customers mix monthly and annual billing?
Calculate them separately. Convert annual contracts to a monthly equivalent for the MRR ARPU denominator if — and only if — you state that convention explicitly. Keep ACV ARPU restricted to contracted customers. Publishing one blended figure across both populations produces a number that describes neither group accurately.
Should ARPU include one-time implementation fees?
No. ARPU covers recurring revenue only. Setup fees, professional services, training, and hardware are non-recurring and will not renew, so including them inflates the metric and distorts CAC payback math. Track services revenue as a separate line with its own margin profile.
What does a declining ARPU with growing revenue mean?
Usually that you are acquiring smaller customers faster than larger ones — a mix shift, not necessarily a problem. Check cohort entry ARPU and segment counts. If growth comes from a deliberate self-serve push, falling blended ARPU is expected and healthy; if it is unintentional, your positioning has drifted down-market.
How does ARPU relate to net revenue retention?
They are complementary. ARPU is a point-in-time average across the current base; NRR measures how revenue from an existing cohort changes over time including expansion, contraction, and churn. ARPU can rise purely from churning small accounts, while NRR would expose that the surviving base is not actually growing.
Is ARPU meaningful for usage-based pricing?
Partially. Committed ACV per account remains useful for forecasting, but realized revenue per account swings with consumption. Report both plus the realized-to-committed ratio. That ratio is the practical signal for whether an account will increase its commitment at renewal or push to reduce it.
FAQ
What is the difference between ARPU and ARR per customer?
ARR per customer annualizes the recurring revenue of every customer, regardless of billing frequency — monthly accounts get multiplied by twelve. ACV-based ARPU restricts the population to customers on annual contracts. For a business that is entirely annually contracted the two converge; for a hybrid business they differ substantially, and the gap is itself a useful measure of how much of your base is uncommitted.
Which metric should drive sales compensation?
ACV, in almost every enterprise or mid-market motion. Compensating on monthly recurring revenue makes a twelve-month commitment worth the same as a thirty-day one in the rep's plan, which predictably produces short, fragile bookings. If you genuinely run two motions, run two comp plans rather than one averaged metric that under-serves both.
How often should ARPU be reported?
MRR ARPU weekly for operating teams, since it responds within a billing cycle. ACV ARPU monthly for sales and customer success, quarterly for the board — it does not change fast enough to justify a weekly read, and reporting it weekly generates noise that invites reaction to nothing. Cohort ARPU is a monthly analysis with written commentary, not a dashboard tile.
What causes MRR ARPU and ACV ARPU to diverge?
Segment mix shift is the usual cause. A self-serve growth push lowers MRR ARPU while an upmarket sales push raises ACV ARPU, and both can happen at once. Discount policy drift is the second cause — deepening annual prepay discounts pull the spread below 1.0 without touching monthly list prices. Check mix first, discount depth second.
Can ARPU go up while the business gets worse?
Yes, and it is common enough to be a standing trap. If low-priced accounts churn fastest, the surviving average rises automatically even as total revenue falls. ARPU measures revenue per remaining account and carries no information about how many accounts remain. Always read it beside logo count, gross retention, and net revenue retention.
What is a healthy spread between the two metrics?
There is no universal target, because the right spread depends on monthly churn. A 10–20% annual prepay discount — producing a spread near 0.80–0.90 — is standard and usually good economics when monthly churn is meaningful, since the commitment eliminates eleven churn decisions. If monthly churn is already very low, that same discount buys much less and deserves scrutiny.
Sources
- OpenView Partners — SaaS Benchmarks
- ChartMogul — SaaS Metrics Resources
- Baremetrics — SaaS Metrics Academy
- For Entrepreneurs (David Skok) — SaaS Metrics 2.0
- Bessemer Venture Partners — State of the Cloud
- a16z — 16 Startup Metrics
- Stripe — Billing Documentation
- SaaStr — SaaS Metrics Archive
- Gartner — Software and SaaS Research
- Profitwell / Paddle — SaaS Metrics Resources
Related on PULSE
- [Monthly Recurring Revenue (MRR) per Customer in Subscription Box: Retention Value](/knowledge/ik0558)
- [Top 10 SaaS Monthly Recurring Revenue Metrics to Track](/knowledge/ik0570)
- [Average Contract Value (ACV) Growth Rate for Mid-Market SaaS](/knowledge/ik0500)
- [Average Contract Value (ACV) for Cloud Services: Enterprise Sales Metric](/knowledge/ik0544)
- [Top 10 Telecom Average Revenue Per User Growth KPIs](/knowledge/ik0586)
- [Top 10 Gaming Average Revenue per Daily Active User Metrics](/knowledge/ik0565)
This page will be disappearing soon. Save it to your device for $1 — or read it free while it is here.
@Kory-White- · if Venmo asks, the last 4 of my number are 2012
 pulse-industry-kpisTop 10 Insurance Loss Ratio and Combined Ratio Benchmarks in 2027
 pulse-industry-kpisTop 10 Nonprofit Foundation Revenue KPIs in 2027
 pulse-industry-kpisTop 10 RIA Wealth Management Revenue KPIs in 2027
 pulse-industry-kpisTop 10 Bowling Alley Revenue KPIs in 2027
 pulse-industry-kpisTop 10 Logistics Cost per Mile and Revenue per Load Metrics in 2027
 pulse-industry-kpisTop 10 Insurance Brokerage Revenue KPIs in 2027
 pulse-industry-kpisTop 10 Parcel Carrier Revenue KPIs in 2027
 pulse-industry-kpisTop 10 Dental Practice Revenue KPIs in 2027
 pulse-industry-kpisBillable Utilization Rate in Global Law Firms as a Profitability Metric in 2027
 pulse-industry-kpisTop 10 Console Gaming Revenue KPIs in 2027