
Top 10 Streaming Video (SVOD) Churn and ARPU Retention Metrics
 Curated by Kory White · Fractional CRO, CRO Syndicate
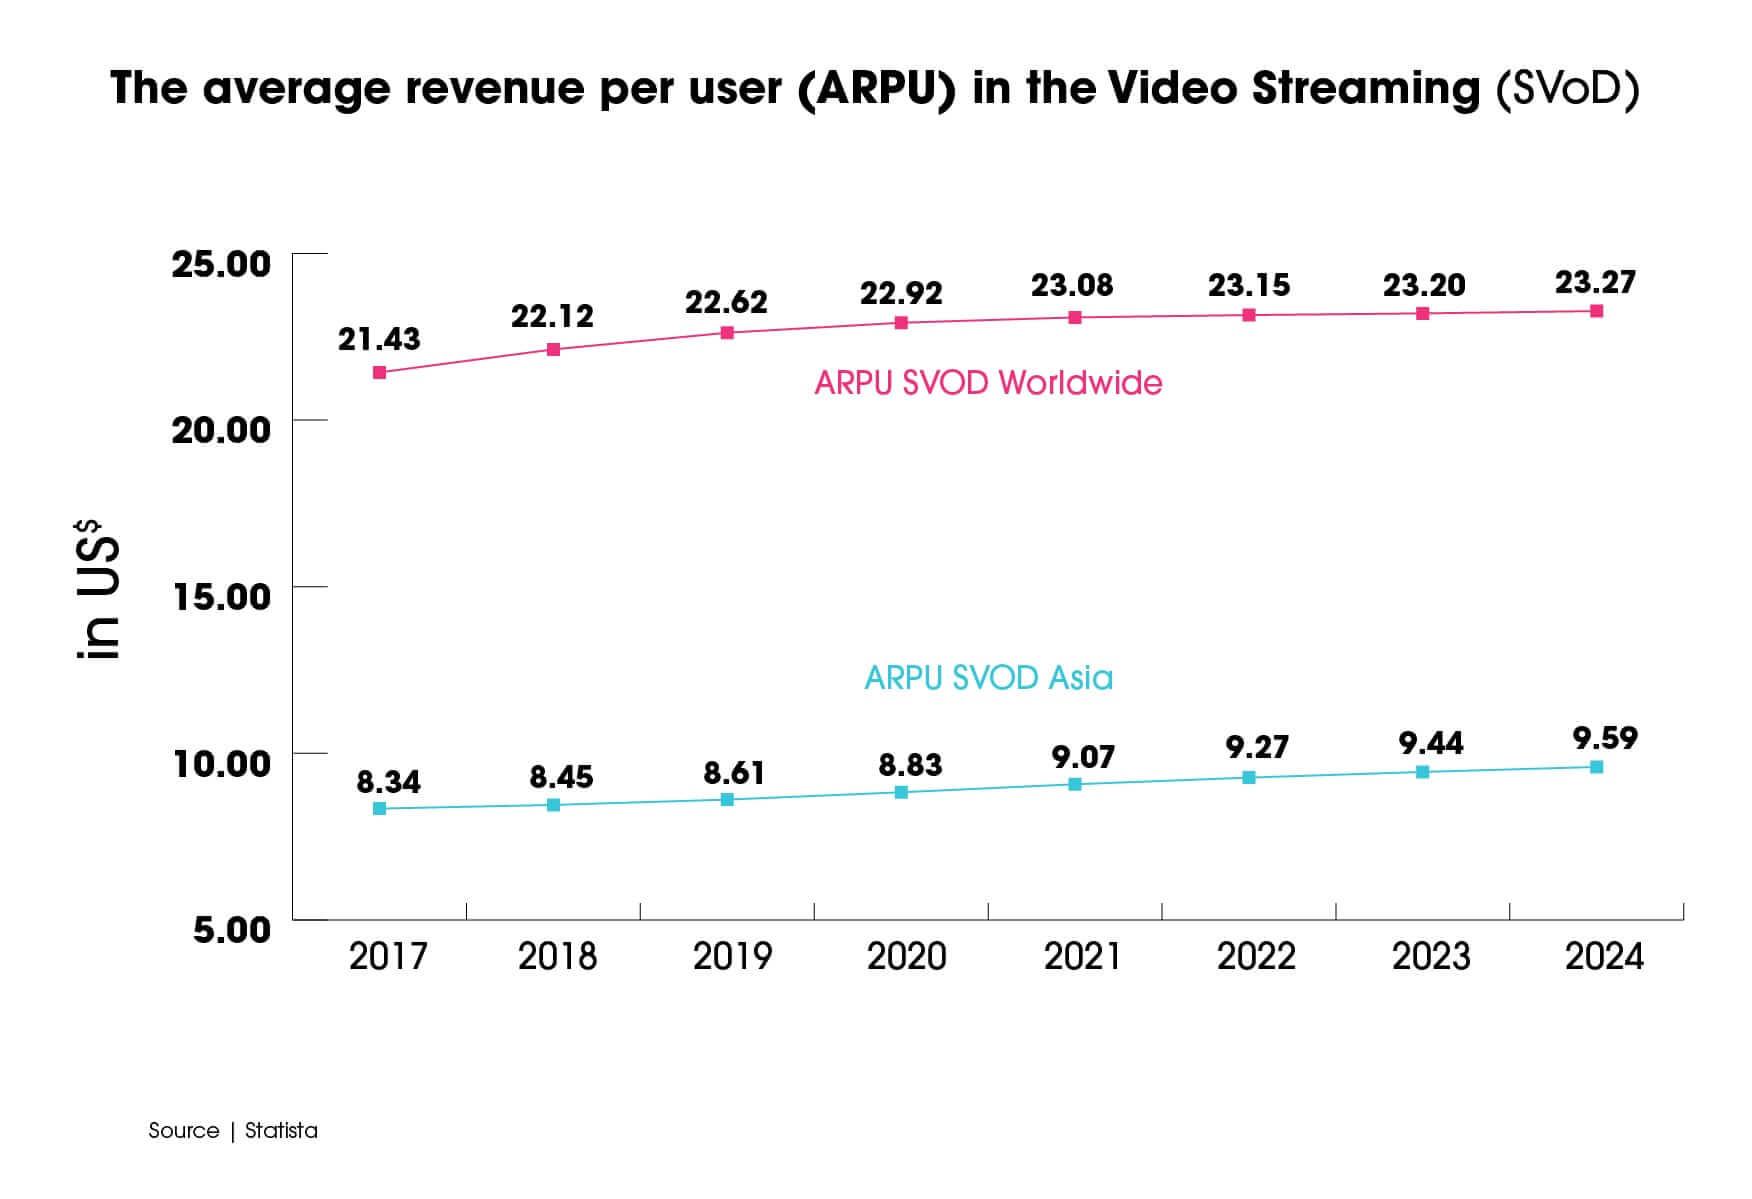
Direct Answer
Why Streaming Video (SVOD) Measures Differently
SVOD is not SaaS. It is not linear TV. It is a discretionary entertainment subscription with near-zero switching costs—users cancel with one click and resubscribe just as easily. This creates unique measurement challenges:
- No contractual lock-in. Unlike telecom or B2B SaaS, SVOD has no annual contracts. A 5% monthly churn rate is normal; in SaaS, that would be a crisis.
- Binge-and-churn behavior. A subscriber joins for one show, watches it in a weekend, and cancels. This is not a "bad" customer—it’s a transactional user. You need to measure reactivation separately.
- Household vs. Individual. One account serves multiple profiles. ARPU is diluted by shared passwords (Netflix’s 2023 crackdown added 13M subscribers partly by converting sharers).
- Content as the product. Churn is driven by the content slate, not product quality. A weak Q2 lineup can spike churn by 3-5 percentage points.
- Free trials and promotions. A 7-day free trial subscriber is not a "retained" user until they pay. Gross adds must be segmented by source.
Because of these factors, standard SaaS metrics like MRR churn or logo retention are misleading. SVOD needs gross churn (total cancellations) and net churn (cancellations minus reactivations) tracked separately, plus ARPPU (excluding free tiers) over ARPU.
The Most Important KPIs to Track
1. Monthly Churn Rate
Definition: Percentage of subscribers who cancel in a given month. Formula: (Cancelled Subscribers at End of Month) / (Total Subscribers at Start of Month) Benchmark: Industry average is 4-7% monthly. Netflix hovers around 2.5% (best in class).
Disney+ has hit 5-6% post-price hikes. Paramount+ can exceed 8%. Why it matters: A 5% monthly churn means 46% annual churn.
You lose nearly half your base every year. Reducing churn by 1 point can increase LTV by 10-15%.
2. Gross Revenue Churn
Definition: Revenue lost from downgrades and cancellations, not offset by upgrades or reactivations. Formula: (MRR Lost from Cancellations + Downgrades) / (Starting MRR) Benchmark: 3-5% monthly for SVOD. High because downgrades (e.g., from ad-free to ad-supported) are common.
Why it matters: A subscriber who downgrades from $15.99 to $7.99 is still "retained" but generates half the revenue. Gross revenue churn captures this erosion.
3. Net Revenue Retention (NRR)
Definition: Revenue from existing subscribers after upgrades, downgrades, and churn, expressed as a percentage. Formula: (Ending MRR from Existing Subscribers) / (Starting MRR from Existing Subscribers) Benchmark: Best-in-class SVOD (Netflix) runs 95-98% NRR. Most operators are 85-90% because downgrades and churn outpace price increases.
Why it matters: NRR below 100% means you must acquire new subscribers just to stay flat. Disney+ reported NRR of ~88% in 2023 after its ad-tier launch.
4. Average Revenue Per User (ARPU)
Definition: Total revenue divided by total subscribers (including free trial and ad-supported tiers). Formula: (Total Monthly Revenue) / (Total Subscribers) Benchmark: Netflix ARPU is ~$15.53 (Q1 2024). Disney+ ARPU is ~$7.80 (including Hotstar).
Max ARPU is ~$11.00. Why it matters: ARPU is diluted by low-revenue tiers. A growing subscriber base with falling ARPU (e.g., adding ad-tier users) can mask revenue stagnation.
5. Average Revenue Per Paying User (ARPPU)
Definition: Revenue divided by only paying subscribers (excludes free trials and promotional accounts). Formula: (Total Monthly Revenue) / (Paying Subscribers) Benchmark: Typically 20-40% higher than ARPU. Netflix ARPPU is ~$16.50.
Why it matters: This is the true measure of monetization. If ARPPU drops, your pricing or tier mix is broken.
6. Lifetime Value (LTV)
Definition: Total gross profit a subscriber generates before churning. Formula: (ARPU * Gross Margin) / (Monthly Churn Rate) Benchmark: Netflix LTV is ~$600-800. Disney+ LTV is ~$250-400.
Peacock LTV is ~$150-200. Why it matters: LTV determines how much you can spend on acquisition. A $300 LTV means you should not spend more than $100 CAC (at 3:1 LTV/CAC).
7. LTV/CAC Ratio
Definition: Lifetime value divided by customer acquisition cost. Benchmark: 3:1 is healthy. Below 2:1 means you are over-spending on marketing.
Netflix runs 4:1+ due to organic word-of-mouth. Why it matters: If your LTV/CAC is 1.5:1, you lose money on every subscriber. Paramount+ reportedly had a 1.8:1 ratio in 2023, leading to marketing cuts.
8. Reactivation Rate
Definition: Percentage of churned subscribers who return within a given period (e.g., 90 days). Formula: (Reactivations in Period) / (Churned Subscribers in Prior Period) Benchmark: 15-25% for SVOD. Max sees ~20% reactivation within 90 days.
Why it matters: SVOD is a "revolving door." A high reactivation rate means your content library retains value. Ignoring this metric overstates churn.
9. Days to First Value (DTFV)
Definition: Time from sign-up to the first meaningful engagement (e.g., completing a first episode or adding a profile). Benchmark: Under 7 days is ideal. Over 14 days correlates with 40% higher churn in month 1.
Why it matters: Subscribers who don't find content fast enough cancel. Netflix optimizes DTFV by auto-playing a recommended show immediately after sign-up.
10. Content Engagement Score
Definition: A composite metric of hours watched per subscriber, completion rate of top titles, and frequency of logins. Benchmark: Netflix reports ~2 hours/day per subscriber. Disney+ is ~1.5 hours/day.
Why it matters: Engagement is the leading indicator of churn. A subscriber who drops from 10 hours/week to 2 hours/week is 3x more likely to cancel in the next 30 days.

👉 Quick Call with Kory White, Fractional CRO · See Kory on LinkedIn · CRO Syndicate
Real Operators
Netflix (Market leader): Uses monthly churn and ARPU as primary board metrics. In Q1 2024, reported 2.5% monthly churn and $15.53 ARPU. They track content engagement score per title to decide renewals. Their reactivation rate is ~25% due to strong back-catalog. They spend $17B/year on content, with a LTV/CAC of ~4:1.
Disney+ (Growth phase): Focuses on gross adds and ARPU to justify streaming losses. In Q1 2024, added 7M subscribers but ARPU fell to $7.80 due to Hotstar. They track NRR at ~88% as ad-tier users downgrade. Their DTFV is under 5 days because of strong IP (Marvel, Star Wars).
Max (Mature): Uses net revenue retention and reactivation rate as key metrics. Reported ~20% reactivation rate in 2023. They segment churn by content release cycle—churn spikes 30% after a season finale. Their ARPPU is ~$11.50, with a LTV of ~$400.
Paramount+ (Challenger): Struggles with monthly churn above 8%. Their LTV/CAC is ~1.8:1, forcing marketing budget cuts. They track content engagement score to identify which titles drive retention—found that "Yellowstone" spinoffs reduce churn by 15%.
Peacock (Ad-tier heavy): Uses ARPU (including ad revenue) as primary metric. Reported $9.50 blended ARPU in 2023. Their gross revenue churn is lower because ad-tier users downgrade less. They track days to first value—users who watch a live sport within 3 days have 50% lower churn.
Failure Modes
1. Confusing Gross vs. Net Churn. If you report net churn (cancellations minus reactivations) as your primary metric, you miss the real problem. A 2% net churn could mask 8% gross churn with 6% reactivation. You need both.
2. Ignoring Reactivation. SVOD is a revolving door. If you treat a churned subscriber as "lost forever," you overstate churn and underinvest in win-back campaigns. Disney+ learned this when they saw 22% of "churned" users returned within 60 days.
3. Using ARPU Instead of ARPPU. A growing ad-tier base dilutes ARPU. If your ARPU drops from $12 to $10, but ARPPU stays at $15, you are fine. If ARPPU also drops, your pricing is broken. Paramount+ mistakenly used ARPU and missed that their ad-tier was cannibalizing premium.
4. Overweighting Logo Retention. A subscriber who downgrades from ad-free to ad-supported is still "retained" but generates 40% less revenue. Gross revenue churn captures this; logo retention does not.
5. Ignoring Content Engagement as a Leading Indicator. Churn is not random. A subscriber who stops watching for 14 days is 3x more likely to cancel. Netflix triggers a "we miss you" email after 7 days of inactivity. Most operators wait until after cancellation.
6. Setting LTV Too High. If you use a 12-month churn assumption for a 6-month average tenure, your LTV is inflated by 50%. Max recalculates LTV quarterly using actual cohort data, not annual projections.
Reporting Cadence
Weekly:
- Monthly churn rate (rolling 4-week average)
- Gross adds (by source: organic, paid, promo)
- Content engagement score (hours watched per subscriber)
Monthly:
- ARPU and ARPPU (by tier)
- Gross revenue churn
- Net revenue retention
- Reactivation rate (30-day window)
- Days to first value (cohort analysis)
Quarterly:
- LTV and LTV/CAC (by acquisition channel)
- Cohort churn curves (month 1, 3, 6, 12)
- Content ROI (cost per engaged hour)
- Pricing tier mix analysis
Annually:
- Full cohort LTV (12-month actual)
- Brand health survey (Net Promoter Score)
- Competitive churn benchmarking (via Antenna or Parks Associates)
30-60-90 Plan
Days 1-30: Data Hygiene & Baseline
- Audit your subscriber data: Are free trials, promos, and paid users segmented? Are cancellations coded by reason (price, content, no reason)?
- Set up a monthly churn dashboard in Tableau or Looker with gross and net churn.
- Pull 12 months of historical data to calculate baseline churn, ARPU, and LTV.
- Identify your top 3 churn drivers using cancellation surveys (use Qualtrics or Typeform).
Days 31-60: Cohort Analysis & Triggers
- Build cohort churn curves by acquisition channel (organic, paid, referral). Find which channel has the highest 90-day churn.
- Set up automated triggers: If a subscriber has zero logins for 7 days, send a personalized recommendation email (use Braze or Iterable).
- Implement reactivation campaigns: Email churned users after 30 days with a "come back for [new title]" offer.
- Test a price increase on a small cohort (5%) to measure downgrade vs. Churn impact.
Days 61-90: Optimization & Scaling
- Calculate LTV/CAC by channel. Cut channels below 2:1 ratio.
- Launch a tier optimization test: Move ad-tier subscribers to a higher-priced ad-free tier with a 30-day free upgrade.
- Implement a content engagement score model using Snowflake or Databricks to predict churn risk.
- Report findings to leadership: Show how reducing monthly churn from 6% to 5% increases LTV by 20%.
FAQ
Q: What is a "good" monthly churn rate for SVOD? A: Below 3% is best-in-class (Netflix). 4-6% is average (Disney+, Max). Above 7% signals a content or pricing problem (Paramount+).
Q: Should I use ARPU or ARPPU for pricing decisions? A: ARPPU—it excludes free trials and promos. ARPU is useful for revenue forecasting but misleading for pricing strategy.
Q: How do I calculate LTV for a new SVOD service with no historical data? A: Use industry benchmarks: assume 5% monthly churn, $10 ARPU, 70% gross margin. That gives LTV = $10 * 0.7 / 0.05 = $140. Adjust as you get real data.
Q: Why is reactivation rate important? A: SVOD is a "revolving door." A 20% reactivation rate means 1 in 5 churned users returns. Ignoring it overstates churn and understates the value of your content library.
Q: What tools can I use to track these metrics? A: Amperity for customer data unification, Braze for retention campaigns, Tableau for dashboards, Snowflake for data modeling, and Antenna for competitive churn benchmarking (pricing starts at $50k/year).
Q: How do I reduce churn without lowering prices? A: Focus on content engagement—personalized recommendations, weekly email digests, and "watch next" prompts. Netflix reduced churn by 15% by improving its recommendation algorithm.
Sources
- Netflix Q1 2024 Earnings Report - Subscriber and ARPU Data
- Antenna - SVOD Churn Benchmarks (2024)
- Parks Associates - Streaming Video Churn Analysis
- Disney+ Q1 2024 Earnings - ARPU and Subscriber Metrics
- Braze - Customer Engagement Platform for SVOD Retention
- Snowflake - Data Modeling for Subscription Analytics
- Gartner - LTV/CAC Benchmarks for Subscription Services
- Forrester - The Cost of Churn in Streaming Video