 Pulse Reviews and Analysis
Top 10 Advertising Agency Revenue KPIs
 Curated by Kory White · Fractional CRO, CRO Syndicate
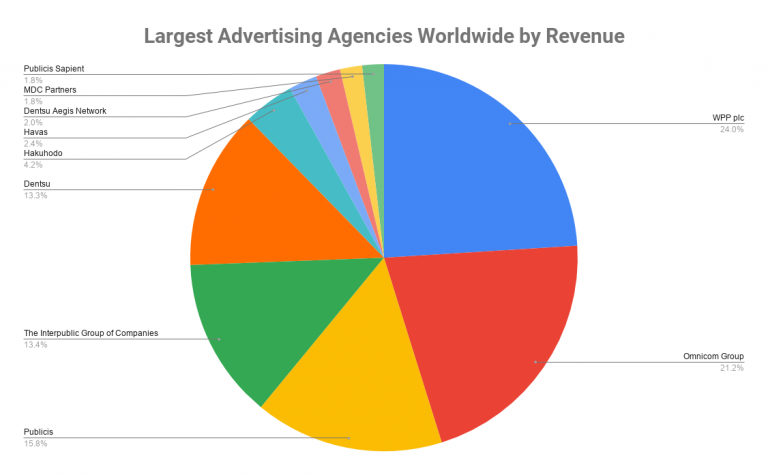
Direct Answer
Why Advertising Agencies Measure Differently
Advertising agencies operate on a fundamentally different revenue model than most B2B or SaaS companies. Instead of recurring monthly subscriptions, agencies rely on project-based fees, retainers, and commission-based income. This creates a revenue stream that is lumpy, unpredictable, and heavily dependent on client acquisition cycles.
The core problem: revenue is not recurring. A large retainer client can churn on short notice, leaving a gap that takes months to fill. This is why standard SaaS metrics like Monthly Recurring Revenue (MRR) or Annual Contract Value (ACV) map poorly to agencies.
Instead, agencies need KPIs that measure capacity utilization, scope control, and new business velocity.
Agencies that run a disciplined KPI dashboard tend to grow revenue faster and churn fewer clients than those operating on instinct, because they can see margin erosion before it shows up in the bank account. The difference is not luck—it is measurement.
The Most Important KPIs to Track
1. Effective Hourly Rate (EHR)
Formula: Total Revenue / Total Hours Worked (by client or project)
EHR is the single most important profitability KPI for an agency. It tells you what you are actually earning per hour of work, after all discounts, scope changes, and write-offs. An agency with a standard rate of $200/hour may realize a meaningfully lower EHR after client negotiations and scope creep.
Benchmark: Top-performing agencies maintain an EHR at roughly 85% or higher of their standard rate. If your EHR drops below 70%, you are losing money on a large share of hours.
Real Vendor: Harvest and Toggl Track are common time-tracking tools agencies use to calculate EHR. Project-management tools that integrate time entries can also surface this data.
2. Net New Business Revenue
Formula: (New Client Revenue + Upsells) – Lost Client Revenue (in a given period)
This is your true growth metric. Agencies often celebrate "new business wins" without subtracting what they lost from churned clients. A new-client win is meaningless if it merely backfills a larger retainer you just lost.
Benchmark: A healthy agency should grow Net New Business Revenue at a clear positive rate year over year. Flat-to-negative net new business indicates you are treading water.
Real Vendor: Gong can analyze sales calls to surface why new business is won or lost. Clari provides pipeline forecasting that feeds this metric.
3. Scope Creep Margin
Formula: (Total Billable Hours Estimated – Total Billable Hours Actual) / Total Billable Hours Estimated
Scope creep is a silent killer of agency margins. Every unbilled hour is a direct hit to your bottom line. This KPI measures how accurately you estimate projects.
Benchmark: A scope creep margin in the mid-single digits is generally acceptable (clients will always ask for small changes). Persistent double-digit overruns mean your scoping process is broken.
Real Vendor: Professional-services-automation (PSA) tools such as Certinia (formerly FinancialForce) or Kantata (formerly Mavenlink) track scope versus actuals.
4. Client Churn by Revenue
Formula: (Revenue Lost from Churned Clients / Total Revenue at Start of Period) x 100
This is not the same as "client count churn." Losing a small monthly client hurts far less than losing a large one. Track churn by revenue, not by number of accounts.
Benchmark: Keep annual revenue churn well below the level that outpaces new business. Top-performing agencies hold it to the low double digits or better.
Real Vendor: HubSpot Operations Hub can automate churn tracking by revenue. Lighter subscription-analytics tools work for smaller agencies.
5. Utilization Rate
Formula: (Billable Hours / Total Available Hours) x 100
Utilization measures how much of your team's time actually generates revenue. Low utilization means you are paying people for non-billable work.
Benchmark: For creative teams, the mid-60s to mid-70s percent range is healthy. For account managers and strategists, a lower band is typical because their roles include non-billable client management. Persistently below 50% signals overstaffing or under-selling.
Real Vendor: Wrike and Asana offer utilization tracking; Smartsheet resource management is built for agency planning.
6. Average Retainer Value (ARV)
Formula: Total Retainer Revenue / Number of Retainer Clients
This KPI tracks the health of your recurring revenue base. A rising ARV means you are successfully upselling or moving to higher-value clients.
Benchmark: ARV should grow steadily year over year through price increases and upsells. A flat or declining ARV indicates you are not capturing value.
Real Vendor: Salesloft and Outreach can automate the upsell sequences that drive ARV growth.
7. Gross Margin by Client
Formula: (Client Revenue – Direct Costs) / Client Revenue x 100
Not all clients are created equal. Some pay well but require heavy account-management overhead; others are low-maintenance but pay less. Gross margin by client reveals the true profitability of each relationship.
Benchmark: A healthy agency runs gross margins in roughly the 50–60% range per client. Sustained margins below 40% mean you are subsidizing that client.
Real Vendor: Tableau or Power BI can visualize client profitability; an accounting platform such as QuickBooks Online supplies the raw data.
8. Revenue per Full-Time Employee (RPE)
Formula: Total Revenue / Number of Full-Time Employees
RPE is a productivity and efficiency metric. It tells you how much revenue each employee generates, which is critical for scaling decisions.
Benchmark: Healthy agencies commonly land in the low-six-figures of revenue per employee, with high-performers materially above that. A low RPE points to a staffing or pricing problem.
Real Vendor: BambooHR or Gusto track headcount and workforce data that feed RPE.
9. Pipeline Velocity
Formula: (Number of Opportunities x Average Deal Value x Win Rate) / Average Sales Cycle Length (in days)
This forward-looking KPI measures how fast your new-business pipeline is moving. A slow pipeline means you are not generating enough qualified demand or your sales process is stalling.
Benchmark: Track your own trend first; improvement period over period matters more than any absolute number. Agency sales cycles commonly run weeks to a few months.
Real Vendor: Clari and HubSpot Sales Hub track pipeline velocity.
10. Net Promoter Score (NPS) – Revenue-Weighted
Formula: (Revenue from Promoters – Revenue from Detractors) / Total Revenue x 100
Standard NPS is useful, but revenue-weighted NPS tells you whether your biggest clients are happy. A large detractor client is a far bigger risk than a small promoter.
Benchmark: A strongly positive revenue-weighted NPS is the goal. A low or negative score flags churn risk among your top accounts.
Real Vendor: SurveyMonkey and Qualtrics both offer NPS tracking that can be weighted by account value.

👉 Quick Call with Kory White, Fractional CRO · See Kory on LinkedIn · CRO Syndicate
Real Operators
The largest agency holding companies—WPP, Omnicom, Publicis, Interpublic (IPG), and Dentsu—run their operating units on exactly this kind of utilization-and-scope discipline, because their public margins depend on it. Within those groups, networks such as VML, R/GA, and Ogilvy manage profitability through PSA tooling that tracks scope versus actuals and effective hourly rate at the project level.
In practice, a disciplined agency operating model looks like this:
- Scope control: A managing director institutes a weekly review of scope creep margin in a PSA tool and ties a change-order process to it. Reducing unbilled hours lifts effective hourly rate without raising published rates.
- Capacity allocation: A revenue or operations lead tracks utilization by office or team in a BI dashboard, then reallocates staff from low-utilization to high-utilization groups to raise overall revenue per employee.
- Win/loss analysis: A new-business lead uses a revenue-intelligence tool such as Gong to analyze lost deals and a qualification framework such as MEDDPICC (Metrics, Economic Buyer, Decision Criteria, Decision Process, Paper Process, Identify Pain, Champion, Competition) to tighten the pipeline.
These are the levers real agency operators pull; the named holding companies above are public and report the margin pressure that makes this discipline non-negotiable.
Failure Modes
Failure Mode 1: Vanity Revenue Tracking total revenue without context is dangerous. A large agency can look healthy on the surface while running an EHR far below its standard rate—"busy but broke," working hard but losing money on most hours. Fix: Always pair revenue with EHR and gross margin.
Failure Mode 2: Ignoring Scope Creep Many agencies celebrate "winning" a fixed-fee project, only to deliver far more work than was scoped. Enough overrun erases all profit. Fix: Implement a change-order process. Require signed approvals for any work outside the original statement of work.
Failure Mode 3: Overvaluing New Business Agencies often chase new-business wins while ignoring churn. If new wins merely backfill churned revenue, net growth is near zero. Fix: Track Net New Business Revenue monthly. If churn is high, pause new-business spending and fix retention first.
Failure Mode 4: Low Utilization = Overstaffing A utilization rate in the 40s means you are paying people for too little billable work, often hidden by "bench time" or internal projects. Fix: Set a minimum utilization target for billable staff and audit time weekly with a tracking tool.
Failure Mode 5: Revenue Concentration If one client represents an outsized share of total revenue, you carry concentration risk—losing that client could cripple the agency. Fix: Set a maximum client-concentration threshold and actively diversify the client base.
Reporting Cadence
| KPI | Frequency | Owner | Tool |
|---|---|---|---|
| Effective Hourly Rate | Weekly | Account Directors | Harvest |
| Net New Business Revenue | Monthly | Head of New Business | Clari |
| Scope Creep Margin | Weekly | Project Managers | Certinia (PSA) |
| Client Churn by Revenue | Monthly | CFO | HubSpot |
| Utilization Rate | Weekly | Operations Director | Wrike |
| Average Retainer Value | Monthly | Head of Account Management | Salesforce |
| Gross Margin by Client | Monthly | CFO | QuickBooks + Tableau |
| Revenue per Employee | Quarterly | CEO | BambooHR |
| Pipeline Velocity | Weekly | Head of New Business | Clari |
| NPS (Revenue-Weighted) | Quarterly | Head of Client Services | SurveyMonkey |
Daily: Check pipeline velocity and any urgent scope-creep alerts. Weekly: Review EHR, scope creep margin, and utilization. Monthly: Full dashboard review with Net New Business Revenue, churn, and ARV. Quarterly: Deep dive on RPE, NPS, and client profitability.
30-60-90
First 30 Days: Audit & Baseline
- Pull 12 months of historical data for all 10 KPIs.
- Calculate your current EHR, utilization rate, and scope creep margin.
- Identify the bottom three clients by gross margin.
- Set up Harvest or Toggl Track for time tracking if not already in place.
First 60 Days: Implement Tracking & Set Targets
- Build a dashboard in Tableau or Power BI with all 10 KPIs.
- Set targets: EHR near 85% of standard rate, utilization in the healthy band for each role, churn below your new-business rate.
- Implement a change-order process for scope-creep control.
- Train account directors on weekly KPI review.
First 90 Days: Optimize & Act
- Re-price the bottom three clients or exit them if margins stay below 40%.
- Launch a Gong-powered win/loss review to improve pipeline velocity.
- Target a measurable improvement in EHR and a reduction in scope creep margin.
- Present the KPI dashboard to leadership monthly.
FAQ
What is the single most important KPI for an advertising agency? Effective Hourly Rate (EHR). It directly measures profitability per hour worked. If your EHR sits well below your standard rate, you are losing money on most projects.
How do I calculate scope creep margin without a PSA tool? Use a simple spreadsheet: (Estimated Hours – Actual Hours) / Estimated Hours. Track it weekly for every active project and flag persistent overruns immediately.
What is a healthy utilization rate for a creative team? The mid-60s to mid-70s percent range is typical. Persistently below 50% means you are overstaffed; persistently above the high-80s means you are burning out the team and will face turnover.
How often should I review client churn by revenue? Monthly. Churn is a lagging indicator, but monthly reviews let you catch trends before they become crises.
Can I use HubSpot for all these KPIs? HubSpot can handle pipeline velocity, churn, and NPS. For EHR, scope creep, and utilization, you need a time-tracking tool such as Harvest or Toggl Track. For client profitability, use an accounting platform or PSA tool.
What is the difference between Net New Business Revenue and total revenue? Total revenue includes everything. Net New Business Revenue subtracts lost revenue from churned clients, so it shows true growth rather than gross activity.
How do I improve pipeline velocity? Use a qualification framework such as MEDDPICC to qualify leads, analyze lost deals with Gong to find bottlenecks, and shorten the sales cycle by automating follow-ups with Salesloft or Outreach.
What is the biggest mistake agencies make with KPIs? Tracking too many metrics without action. Stick to a focused set. If a KPI is below benchmark, create a specific action plan to fix it within 30 days.