 Pulse Reviews and Analysis
Top 10 Mobile Gaming Revenue KPIs
 Curated by Kory White · Fractional CRO, CRO Syndicate
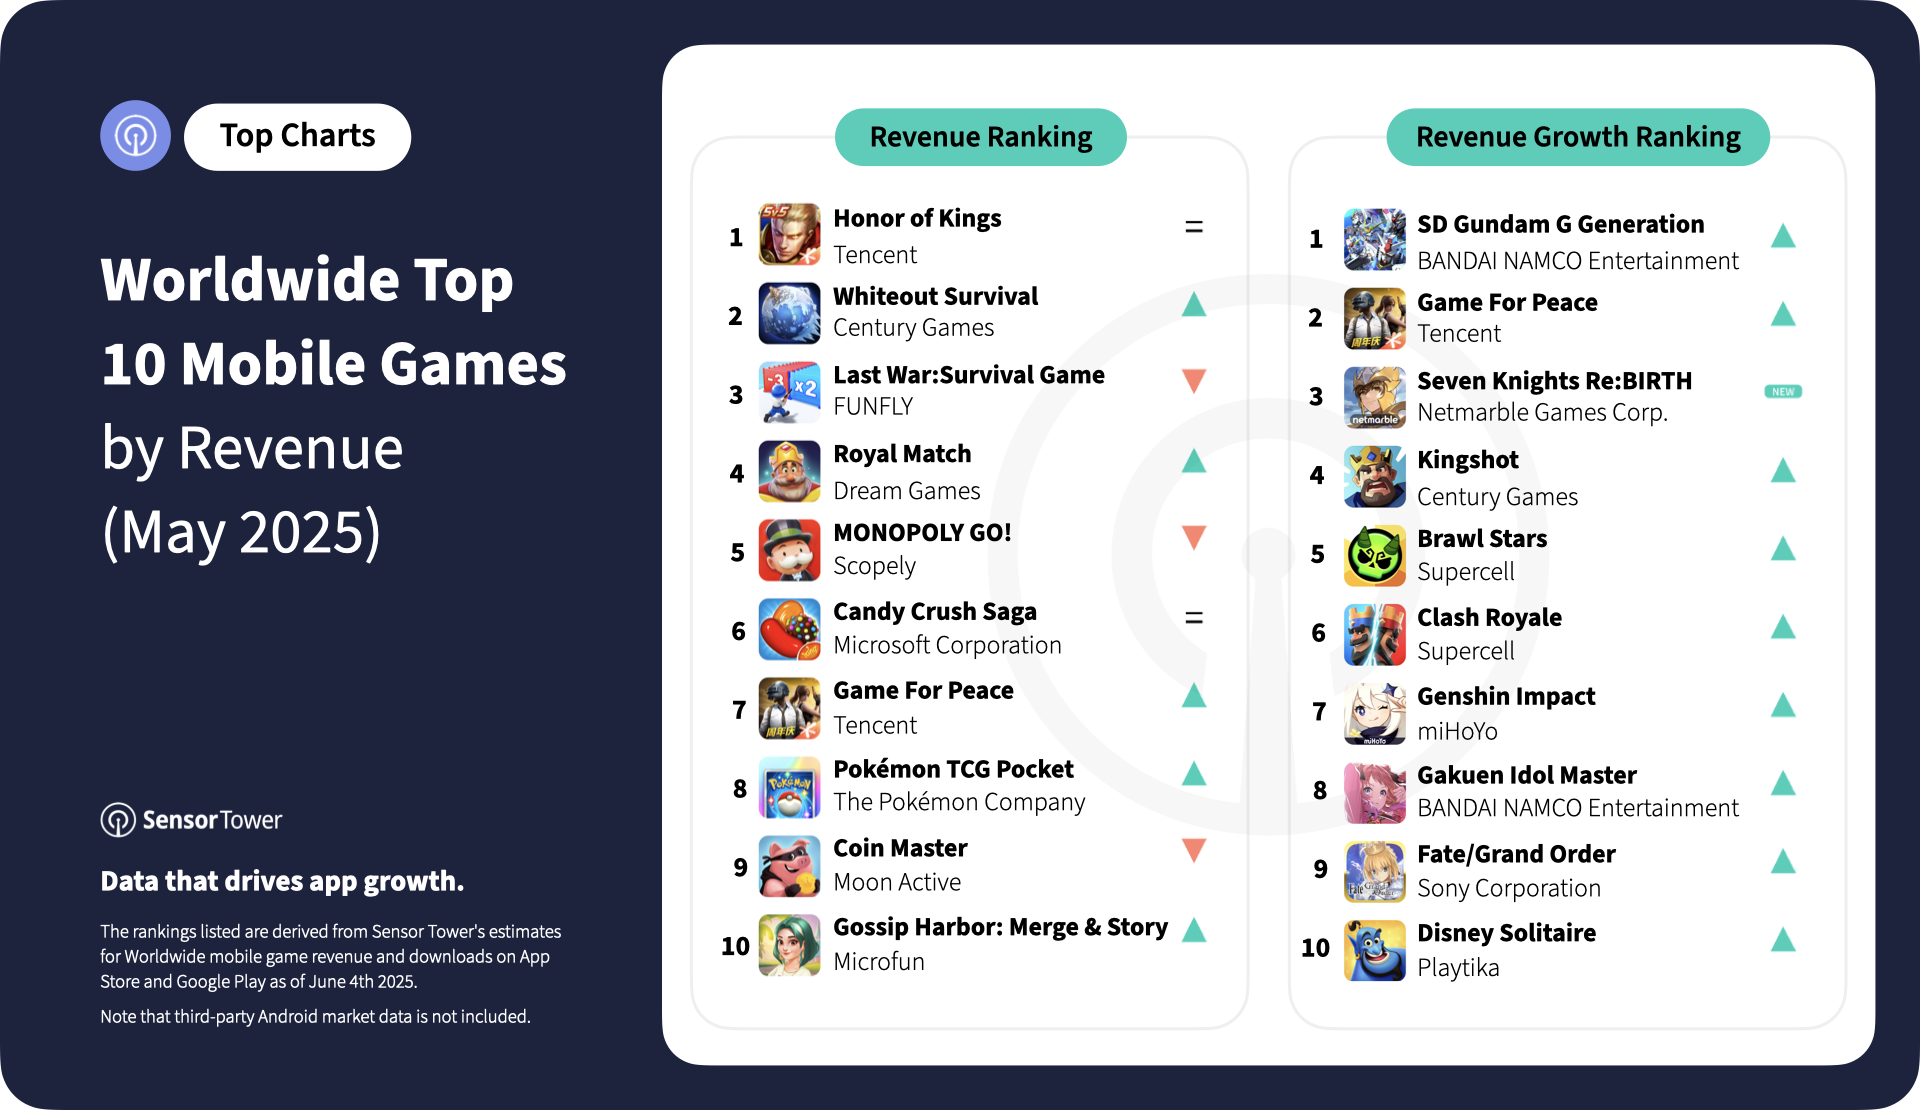
Direct Answer
Why Mobile Gaming Measures Differently
Mobile gaming operates on a free-to-play (F2P) model where 95% of users never pay. Revenue comes from a tiny fraction of whales and ad impressions. This forces KPIs to focus on unit economics—not total bookings. Unlike B2B SaaS with annual contracts, a mobile game’s revenue is volatile, session-based, and heavily influenced by UA spend.
Key differences:
- Short attention spans: A player’s lifetime value (LTV) is often calculated over 7–30 days, not 12 months.
- High churn: 80% of users stop playing after Day 1. Retention is the single biggest predictor of revenue.
- Ad revenue as a lever: Many games earn 30–50% of total revenue from rewarded video ads, requiring separate KPI tracking.
- Platform fees: Apple and Google take 15–30% of all IAP revenue, so net revenue KPIs must account for this.
The Most Important KPIs to Track
1. Lifetime Value (LTV) LTV is the total net revenue a player generates before churning. Calculate it as: LTV = (Average Revenue Per Paying User × Average Paying Lifetime) – UA Cost Benchmark: Top-grossing games (e.g., *Candy Crush*, *Clash of Clans*) see 90-day LTVs of $5–$15.
Use Singular or Adjust to model LTV by source. A common mistake is using blended LTV; always segment by UA channel (e.g., Facebook vs. TikTok).
2. Cost Per Install (CPI) CPI is the UA cost to acquire one new user. Formula: Total UA Spend / New Installs.
Benchmark: In 2024, average CPI for iOS is $3.50 (gaming) and $2.10 for Android (Source: Liftoff). Hyper-casual games often target sub-$0.30 CPI, while mid-core RPGs can exceed $8. Track CPI by ad network using AppLovin or Unity Ads.
3. Average Revenue Per User (ARPU) Total net revenue divided by total active users over a period (e.g., daily or monthly). Formula: Total Revenue / Total Users. Benchmark: A healthy casual game has $0.10–$0.30 daily ARPU. Mid-core games hit $0.50–$1.00. ARPU is a top-level health metric but hides payer/non-payer splits.
4. Average Revenue Per Paying User (ARPPU) Total net revenue from paying users divided by number of paying users. Formula: Total Revenue from Payers / Number of Payers.
Benchmark: Top-grossing games have ARPPU of $20–$50 per month. If ARPPU is high but ARPU is low, you have a tiny payer base—common in strategy games. Use GameAnalytics to segment payers.
5. Day 1, Day 7, Day 30 Retention The percentage of users who return to the game on a specific day after install.
- Day 1: 40–50% is good for casual; 30% is poor for mid-core.
- Day 7: 15–25% is average; top games hit 30%+.
- Day 30: 5–10% is typical; premium games (e.g., *Genshin Impact*) see 15%+.
Retention is the strongest leading indicator of LTV. Use Firebase or Mixpanel to track cohorts.
6. Conversion Rate (Payer Rate) Percentage of users who make any IAP. Benchmark: 2–5% for most F2P games. Hyper-casual games often have <1% payer rate, relying on ads. A 10%+ payer rate is exceptional (e.g., *Pokémon GO*). Track via RevenueCat.
7. Session Frequency & Length
- Session Frequency: Average sessions per user per day. Target: 3–5 for casual, 5–8 for mid-core.
- Session Length: Average time spent per session. Target: 5–15 minutes for casual, 15–30 for RPGs.
Low session frequency with high length indicates deep engagement but poor habit formation. Use Amplitude for behavioral analytics.
8. Ad Revenue Per User (ARPU-Ad) Total ad revenue divided by total users. Benchmark: $0.02–$0.10 per user per day for rewarded video. If ad revenue exceeds IAP revenue, your game is ad-dependent. Tools: ironSource (now Unity) and AdMob.
9. Payback Period Time (in days) to recover UA cost from a user’s revenue. Formula: CPI / Daily ARPU. Benchmark: Under 30 days is ideal for casual; 60–90 days is acceptable for mid-core. A payback period >90 days signals poor unit economics.
10. Monthly Active Users (MAU) & Daily Active Users (DAU)
- DAU/MAU Ratio: Measures stickiness. Target: 20–30% for casual, 10–20% for mid-core.
- DAU: Absolute volume. A game with 1M DAU and $0.10 ARPU generates $100K daily revenue.
Track via Adjust or Tenjin.
Real Operators
Supercell (*Clash of Clans*, *Brawl Stars*)
- Uses Clari for revenue forecasting and Salesforce for CRM (though their B2B side is minimal).
- Benchmarks: 90-day LTV of $12, CPI of $4.50, Day 7 retention of 28%.
- They segment users by spend (whales, dolphins, minnows) and adjust in-game events weekly.
King (*Candy Crush Saga*)
- Relies on Adjust for attribution and GameAnalytics for KPI dashboards.
- Benchmarks: ARPU of $0.18, payer rate of 4.5%, ARPPU of $4.00.
- Their failure mode was over-reliance on IAP; they later added rewarded video ads, boosting ad revenue by 40%.
Zynga (*Words With Friends*, *FarmVille*)
- Uses Singular for UA optimization and Amplitude for retention analysis.
- Benchmarks: CPI of $2.80, Day 30 retention of 8%, payback period of 45 days.
- They failed by ignoring ad revenue in early 2020s, missing a $200M opportunity.
Failure Modes
Vanity Metrics Trap Focusing on total downloads or MAU without cohort-level LTV. Example: A game with 10M downloads but $0.01 ARPU is a failure. Always segment by install date and source.
Ignoring Ad Revenue Many studios treat ads as secondary. In hyper-casual games, ad revenue is 80%+ of total. Failing to optimize eCPM (effective cost per mille) via AdMob mediation can halve revenue.
Over-Optimizing CPI Driving CPI to $0.10 may attract low-quality users with zero retention. A $2.00 CPI with 30% Day 7 retention is better than $0.50 CPI with 5% retention. Use Liftoff to test UA quality.
Cohort Blindness Blending all users into one ARPU hides dying cohorts. If your Day 30 retention drops from 10% to 6% over three months, you’ll miss it. Set up automated cohort alerts in Mixpanel.
Reporting Cadence
| KPI | Frequency | Tool | Owner |
|---|---|---|---|
| CPI | Daily | Singular, Adjust | UA Manager |
| Day 1 Retention | Daily | Firebase, GameAnalytics | Product Manager |
| LTV (7-day) | Weekly | RevenueCat | Finance |
| ARPU, ARPPU | Weekly | Amplitude | Monetization Lead |
| Payback Period | Monthly | Custom SQL/Tableau | CFO |
| MAU, DAU | Daily | Adjust | Marketing Director |
Daily: Check CPI, Day 1 retention, and DAU. If CPI spikes >20%, pause underperforming ad networks. Weekly: Review LTV by cohort, ARPU, and conversion rate. Adjust in-game pricing or event rewards. Monthly: Full P&L review with payback period and ad revenue share. Rebalance UA budget across channels.
30-60-90
Days 1–30: Stabilize UA & Attribution
- Set up Adjust or Singular for real-time attribution.
- Define your top 5 KPIs: CPI, Day 1 retention, ARPU, conversion rate, and payback period.
- Run A/B tests on three ad creatives (video, playable, banner) to find lowest CPI.
- Target: CPI under $3.00, Day 1 retention above 40%.
Days 31–60: Optimize Monetization
- Implement RevenueCat for IAP tracking and AdMob for ad mediation.
- Run A/B tests on pricing (e.g., $0.99 vs. $1.99 starter pack).
- Analyze payer rate and ARPPU. If payer rate is below 2%, add a rewarded video ad for extra lives.
- Target: ARPU of $0.15, payer rate of 3%.
Days 61–90: Scale Live Operations
- Launch weekly in-game events (e.g., double XP, limited-time offers) using GameAnalytics to measure impact.
- Build cohort dashboards in Tableau or Looker to track LTV by source.
- Reallocate UA spend: 70% to top-performing channels, 30% to test new ones.
- Target: Payback period under 45 days, Day 7 retention above 20%.
FAQ
What is the single most important KPI for mobile gaming? LTV. Everything else—CPI, retention, ARPU—feeds into LTV. If LTV > CPI, you can scale profitably.
How do I calculate LTV without historical data? Use a proxy: LTV = ARPU × Average Lifetime Days. For a new game, assume 30-day lifetime and use Day 7 ARPU × 4.3. Refine as data accumulates.
Why is Day 1 retention more important than Day 30? Day 1 retention is the strongest predictor of long-term engagement. A 10% increase in Day 1 retention often correlates with a 30% lift in LTV.
What’s a good CPI for a hyper-casual game? Under $0.30 on iOS, under $0.15 on Android. But always pair with retention—if CPI is low but Day 1 retention is <25%, you’re acquiring junk users.
How do I track ad revenue separately from IAP? Use AdMob or ironSource SDKs to report ad revenue per user. In your dashboard, create two ARPU lines: ARPU-IAP and ARPU-Ad. Sum for total ARPU.
What tools do top studios use?
- Singular or Adjust for attribution.
- RevenueCat for IAP management.
- GameAnalytics or Amplitude for behavioral analytics.
- Tableau or Looker for custom dashboards.
- Clari for revenue forecasting (used by Supercell).