
How Do I Score My Restaurant Staff on Upsells and Attachment in 2026?
 Curated byKory White · Fractional CRO · Maryland
 PULSEKNOWLEDGE LIBRARY
Quality
Certified
Score restaurant staff on upsells with a weighted composite, not raw dollars. Blend attachment rate (how often a check gains an add-on), check lift versus the same-daypart average, and guest-sentiment quality. Normalize each to 0–100, weight them roughly 40/35/25, and compare servers only against peers who worked comparable shifts.
What a real upsell score is and why raw dollars fail
An upsell score is a measurement of *selling behavior*, not a measurement of *revenue collected*. That distinction is the whole ballgame. A server working a Saturday dinner section of four-tops in a room that turns twice will ring up more total dollars than a server working Tuesday lunch two-tops, no matter how skilled either one is. If you rank on total sales, you have built a seniority chart disguised as a performance system — the veterans who get the best sections stay on top, and the newer staff who might actually be better sellers never surface.
The three components worth measuring are attachment, lift, and quality.
Attachment rate is the share of checks that include at least one add-on item beyond the guest's primary intent — an appetizer, a side, a second beverage, a dessert, a premium spirit substitution. Compute it as checks-with-attachment ÷ total checks handled. Realistic benchmarks vary sharply by daypart and format: casual-dining lunch commonly runs 35–55%, dinner 50–70%, and a brunch service can run higher still because beverage attachment is nearly automatic. Below roughly 30% at dinner in a full-service room, you are usually not looking at a sales problem — you are looking at a server who is never making the offer at all. Attachment deserves the heaviest weight because it is the single most coachable behavior in the building. "Ask every table if they want to start with something" is a training instruction. "Sell more" is not.

Check lift is the dollar gap between a staff member's per-guest average and the average of everyone who worked that same shift. Not the restaurant's all-time average — that same shift. Comparing a Wednesday-lunch server to a Friday-dinner benchmark produces noise, not signal. Depending on your price point, a consistent lift of $3–$8 per guest is meaningful outperformance; at a fine-dining check average it might be $15–$25. Lift matters because it is the one component that connects directly to the P&L, but it earns slightly less weight than attachment because a single expense-account eight-top can distort a shift.
Guest-sentiment quality is the counterweight that keeps the whole system honest. Pull whatever guest feedback you already collect — receipt survey, table-tent QR responses, third-party review text, comment cards — and classify mentions of the server into positive language about recommendations and suggestions versus negative language about pressure. A server posting a 70% attachment rate while generating a visible stream of "pushy" and "wouldn't stop suggesting things" comments is converting future visits into present-day appetizers. That is a losing trade and your score should say so out loud.
The anchor concept here is simple: an Upsells program that scores only what the POS can count will inevitably reward whoever leans hardest, because the POS cannot see the guest's face. Weighting quality at a quarter of the composite is what stops the system from training pressure.

Building the scorecard step by step
Here is the actual build sequence. A single-location operator can complete it in about a week of part-time effort; a multi-unit group should budget three to four weeks because you will need to reconcile item categories across menus.
Step one — define your attachment categories. Do not use one undifferentiated bucket. Break the ticket into the lines that actually matter on your menu: appetizer/starter, side or modifier upgrade, non-alcoholic beverage, alcoholic beverage, premium-spirit or wine-by-the-glass upgrade, dessert, and any retail or to-go add. Seven or eight lines is typical. If you run a loyalty program, signup rate belongs on this list too. The point of splitting them is that these categories are not equally hard. Drink attachment at brunch is close to free; dessert attachment at a 90-minute lunch turn is genuinely difficult. A single blended number hides that entirely.
Step two — pull a 60-day baseline before you set any target. This is the step everyone skips, and skipping it is why scoring systems get abandoned in month two. Export per-server, per-category attachment from your POS for the last two months. Look at the distribution — median, top quartile, bottom quartile — for each category and each daypart. Your targets come from that distribution, not from an industry article. If your median dinner dessert attachment is 18%, a 40% target is not ambitious, it is demoralizing.
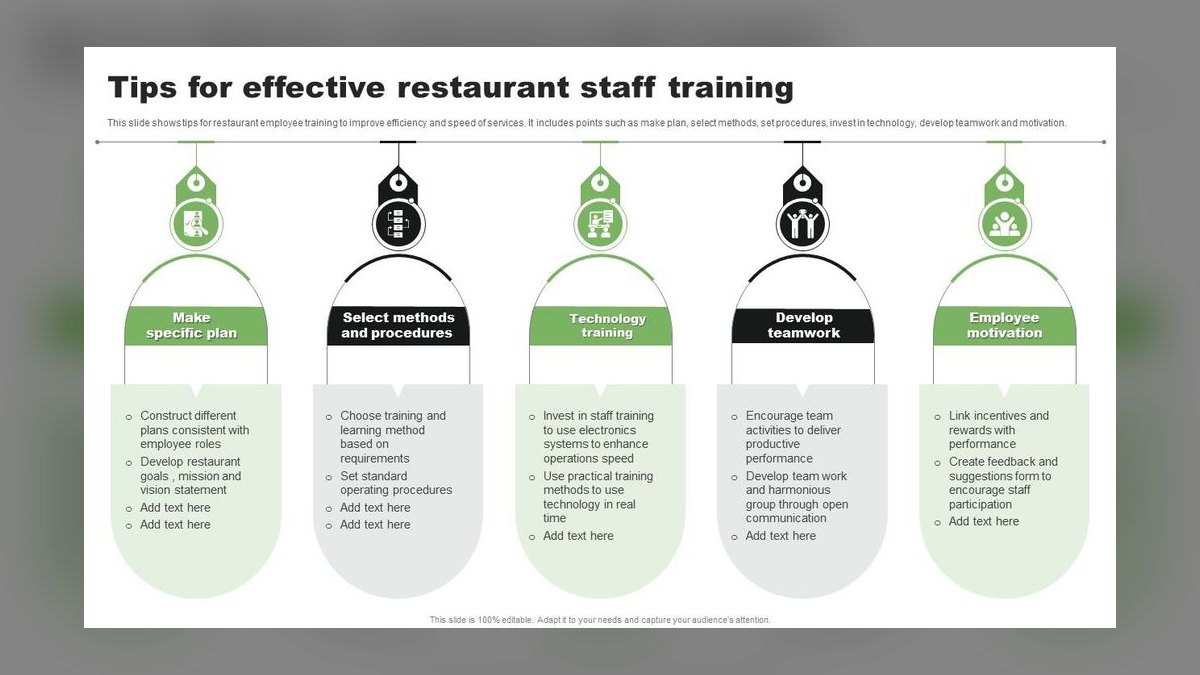
Step three — assign weights. Do this with your GM and your chef in the room, because weights are a menu-strategy decision as much as a labor one. If the kitchen just launched a high-margin shareable starter, appetizer attachment should carry weight. If your beverage program is the margin engine, weight it accordingly. Weights must sum to 100. Write down why each weight is what it is; you will want that note in ninety days when someone asks.
Step four — normalize everything to a 0–100 scale. You cannot add a percentage to a dollar figure. Convert each component: attachment rate maps to its own scale where hitting target equals 100 and hitting half of target equals 50; check lift maps against a defined ceiling (if $10 lift is your stretch ceiling, a $5 lift scores 50); sentiment maps as 100 minus the negative-mention percentage times a multiplier. Then apply your weights and sum.
Step five — run it silently for two weeks. Compute scores, publish nothing. Read the output and ask whether the ranking matches what you'd say from the floor. If your best server ranks eighth, your weights or your normalization are wrong, and you would rather discover that before the staff sees it. This dry run is the cheapest insurance in the whole build.

Step six — publish the full matrix. Every server sees every line, every weight, and their own numbers. Hidden scoring is treated as arbitrary scoring, and correctly so.
What it costs, how long it takes, and what the tooling runs
The honest answer is that the scoring system itself is nearly free and the cost is almost entirely manager time. Budget it accordingly.
The spreadsheet path. Zero software cost. A manager exports POS data weekly, pastes it into a sheet with the weighting formulas already built, and reviews the output. Build time for a competent spreadsheet is four to eight hours. Ongoing maintenance is roughly 30–60 minutes a week per location. The failure mode is well documented and entirely predictable: the sheet goes stale the first week a manager is short-staffed, and once it is two weeks stale nobody trusts it again. If you go this route, the weekly export must be somebody's named responsibility with a specific day attached, not a general expectation.

POS-native reporting. Most modern restaurant POS platforms — Toast, Square for Restaurants, Lightspeed, TouchBistro among them — expose per-server item mix, check averages, and category-level sales in their reporting layer. That gets you the raw inputs without manual tallying. What they generally do *not* give you out of the box is the weighted composite; you are still assembling the score yourself on top of their data. Pricing on these platforms is quote-driven and varies significantly by hardware configuration, number of terminals, and which add-on modules you enable, so get a current quote rather than trusting any published figure. The relevant question when you evaluate one is narrow: can it export per-server, per-category attachment by daypart, and can it do it on a schedule without a human clicking through a UI?
Dedicated performance and gamification platforms exist — leaderboard and scorecard tools that pipe metrics onto screens in the back of house and into team chat. These are typically priced per user per month and quoted rather than listed. They are generally a better fit for multi-unit groups with a back office than for a single independent restaurant, because the per-seat cost across a 40-person hourly staff adds up fast against a benefit that a well-maintained sheet delivers most of.

Timeline to actual behavior change. Expect roughly this arc: weeks one and two, baseline and silent run. Weeks three and four, publish and absorb the inevitable objections about section fairness. Weeks five through eight, the first real movement — bottom-quartile staff typically show the largest percentage gains because they have the most headroom, and a bottom-quartile server going from a 22% to a 38% attachment rate moves your overall numbers more than your top performer gaining another three points. By month three you should see composite averages stabilize at a new level. Anything that looks like an overnight transformation is usually a measurement artifact — check whether someone changed how a category is coded in the POS before you celebrate.
On bonus economics. If you attach money to the score, weekly payouts in the $20–$50 range per shift-block winner keep the loop tight without meaningful P&L impact. The more important line item is an improvement bonus — a smaller amount paid to anyone who gains a defined number of points over the prior week. Without it, everyone outside the top few stops caring by week three, because they can do the arithmetic and see they will never win.
Where operators get this wrong
Scoring the person instead of the shift. A server who works Tuesday lunch, Thursday dinner, and Sunday brunch should carry three scores, not one blended average. The blended number tells you nothing actionable — you cannot coach "your score is 61" when the real story is a strong lunch performer struggling with dinner pace. Segment leaderboards by shift block: weekday lunch, weekday dinner, weekend dinner, weekend brunch. It also surfaces scheduling wins. Sometimes the fix for a low score is not coaching; it is moving that person to the daypart where they clearly perform.

Using calendar months as the measurement window. A calendar month lets a strong first week carry a weak finish, and it punishes anyone who had two rough shifts on the first and second. Use a rolling window of the last ten shifts the person actually worked. It is always current, it is fair to part-timers who work three shifts a week, and it catches a downward trend inside about a week instead of at month-end when it is already a habit.
Ignoring table-assignment luck. Sections are not equal and everyone on the floor knows it. Neutralize this with a peer multiplier: divide each server's check lift by the average lift of every server who worked that same shift on that same day. A $6 lift on a shift where the floor averaged $4 becomes a 1.5 multiplier; the same $6 on a shift where the floor averaged $7 becomes 0.86. This single adjustment removes most of the "you gave her the good section" objection, which is otherwise the argument that kills these programs.
Treating all attachment as equally difficult. If dessert attachment and drink attachment sit in one bucket, every rational server optimizes for drinks and dessert stays flat forever. Score categories separately and weight them by how hard and how valuable each one is.

Rewarding volume while ignoring sentiment. Covered above, but worth repeating because it is the most expensive version of getting this wrong. Attachment gained through pressure shows up in this month's numbers and disappears from next quarter's return rate. The quality component is not a soft nicety; it is the term that keeps the metric from eating the business.
Publishing a leaderboard and calling it a system. A ranked list with no coaching attached generates resentment among the bottom half and complacency in the top few. The feedback loop is the product; the score is just its input. Within 48 hours of a shift, each person should get two sentences — one specific number, one specific next action. "Attachment was 52%, strong on starters. Lift was $2.10 against a $4 target — let's work dessert offers tomorrow." That is the entire message. No preamble, no blame.
Never re-weighting. Weights set in January describe January's menu. Review them every 90 days with staff input. When a new limited-time offer launches or the beverage program changes, re-weight that week and tell the floor — the whole advantage of a weighted matrix is that you can re-aim the entire team overnight without a new training program.

Choosing your approach: a decision framework
The right build depends on three variables: number of locations, whether your POS exports per-server category data cleanly, and how much manager time you can genuinely commit each week. Be honest on the third one.
Single location, clean POS export, 30+ minutes of weekly manager time. Build the spreadsheet. It will do everything you need, it costs nothing, and full visibility into the formula is an advantage — staff who can see the arithmetic argue with the weights instead of arguing with the concept, and arguing with the weights is a productive conversation.
Single location, weak or manual POS data. Fix the data before you build the score. Get category coding consistent, make sure modifiers and upgrades are ringing as distinct items rather than getting buried in open-price keys, and confirm servers are actually assigned to checks correctly. A weighted score built on miscoded item data produces confident, precise, wrong numbers, which is worse than no score at all.

Two to five locations. Spreadsheet still works, but standardize the category definitions across all units first, and expect that reconciliation to be the bulk of the work. If unit A calls it "app" and unit B calls it "starter," nothing rolls up.
Six or more locations with a back office. This is where a purpose-built performance platform earns its cost, because the value is not the math — you could do that math anywhere — it is automated distribution, consistent definitions enforced by software, and manager accountability that does not depend on anyone remembering to run an export. Confirm before you buy that it integrates directly with your POS; a platform that requires manual data entry recreates the exact staleness problem you paid to eliminate.
Bar-heavy or counter-service formats. Score differently. A bartender's opportunity structure is per-tab, not per-table, and the meaningful categories are premium-spirit conversion, second-round rate, and food attachment from the bar menu. Counter service has a compressed interaction window where the realistic play is a single scripted offer, so attachment rate carries nearly all the weight and check lift carries little. Do not force one matrix across service models that do not resemble each other.
Related questions
How do I score bartenders differently from servers?
Bartenders sell per tab, not per table, with far fewer touchpoints. Score premium-spirit conversion rate, second-round rate, and bar-menu food attachment, using per-tab average instead of per-guest lift. Keep the same three-component structure and weights; only the underlying categories change.
Should upsell scores affect scheduling decisions?
Yes, but as a placement tool rather than a punishment. If someone scores well at brunch and poorly at dinner, that is a fit signal, not a performance failure. Move them toward the daypart where they perform before you conclude they need coaching or removal.
How do I keep upsell scoring from feeling like surveillance?
Publish the entire formula, let staff challenge the weights quarterly, and pair every score with one specific coachable action. Systems feel like surveillance when the math is hidden and the only output is a ranking. Transparency plus coaching changes how the same numbers read.
What if my POS can't break out attachment by server?
Do a manual sample instead of nothing. Have a manager tally offers and conversions for 40–60 checks per server over two weeks. It is less precise than a full export, but it establishes a real baseline and reveals who is not making the offer at all — which is most of what you need.
How long before scores actually move?
Expect measurable movement in weeks five through eight after publishing, with the largest gains in the bottom quartile. Composite averages usually stabilize at a new level by month three. Sudden overnight jumps generally indicate a POS coding change rather than behavior change — verify before celebrating.
FAQ
What's the single biggest mistake in scoring restaurant upsells?
Ranking staff on total dollars sold. That rewards whoever draws the best sections and the busiest shifts, which correlates with seniority far more than with selling skill. Use rate-based measures — attachment percentage and lift against the same-shift peer average — so a Tuesday lunch server and a Saturday dinner server are actually comparable.
How do I compare servers fairly across different dayparts?
Never compare across dayparts at all. Maintain separate leaderboards for weekday lunch, weekday dinner, weekend dinner, and brunch, and compute check lift against the average of servers who worked that specific shift. A person working three different dayparts carries three separate scores.
Should attachment be tracked as one number or by category?
By category, always. Appetizers, sides and modifiers, non-alcoholic beverages, alcohol, premium upgrades, and dessert have very different difficulty and margin profiles. A single blended number lets staff optimize for the easiest category while the hard, high-margin ones stay flat, and you will not see it happening.
How often should I recalculate and share scores?
Recalculate continuously on a rolling ten-shift window, deliver individual feedback within 48 hours of a shift, hold a short weekly team huddle, and formally review weights every 90 days. Daily individual scoring reads as micromanagement; monthly-only reporting is too slow to change a habit.
Does a high attachment rate ever indicate a problem?
Yes — when guest sentiment about that server trends negative at the same time. High attachment paired with recurring "pushy" or "kept pushing" feedback means you are borrowing from repeat-visit revenue to fund this week's appetizers. That is why sentiment carries roughly a quarter of the composite rather than being tracked separately.
Can I run this without any software beyond my POS?
Yes. A spreadsheet with weighting formulas and a scheduled weekly POS export handles a single location completely. The real cost is 30–60 minutes of manager time per week, and the real risk is the sheet going stale. Assign the export to a named person on a named day.
Sources
- https://restaurant.org/ — National Restaurant Association, industry operating benchmarks and workforce resources
- https://pos.toasttab.com/resources — Toast restaurant operations and reporting documentation
- https://squareup.com/us/en/restaurants — Square for Restaurants product and reporting documentation
- https://sha.cornell.edu/ — Cornell Nolan School of Hotel Administration, hospitality management research
- https://hbr.org/topic/sales — Harvard Business Review, sales performance and incentive design coverage
- https://www.restaurantbusinessonline.com/ — Restaurant Business, industry operations and labor coverage
- https://www.nrn.com/ — Nation's Restaurant News, industry reporting on operations and technology
- https://www.lightspeedhq.com/pos/restaurant/ — Lightspeed Restaurant POS reporting documentation
Related on PULSE
- How Do I Score My Counter Staff Across Branches?
- What Service Fees Should a Restaurant or Catering Business Charge?
- How Many Staff Should I Schedule Each Shift at My Sushi Restaurant?
- How Many Staff Should I Schedule Each Shift at My BBQ Restaurant?
- How Many Employees Should I Schedule Each Shift at My Mediterranean Restaurant?
- How Many Employees Should I Schedule Each Shift at My Thai Restaurant?
This page will be disappearing soon. Save it to your device for $1 — or read it free while it is here.
@Kory-White- · if Venmo asks, the last 4 of my number are 2012
This page is gone.
This one is off the shelf now. $1 keeps it on your phone for good — the whole page, pictures and diagrams included.
 pulse-qHow Many Sales Reps Do I Need to Hire for My Pharmaceutical Company in 2026?
 pulse-qHow Many Baristas Should I Schedule Each Shift at My Coffee Drive-Thru in 2026?
 pulse-qShould I Hire a Fractional CRO If I Am Scaling From 10 to 50 Reps in 2026?
 pulse-qWhat Service Fees Should a Mobile Mechanic Charge in 2026?
 pulse-qHow Many Sales Reps Do I Need to Hire for My Home Security and Alarm Company in 2026?
 pulse-qHow Many Employees Should I Schedule Each Shift at My Cigar Lounge in 2026?
 pulse-qWhat Service Fees Should a Pool Service Company Charge in 2026?
 pulse-qWhat Service Fees Should a Painting Contractor Charge in 2026?
 pulse-qHow Do I Raise Contribution Margin Without Raising My Prices in 2026?
 pulse-qHow Many Employees Should I Schedule Each Day at My Bookstore in 2026?