
Forecast Bands Beat Point Estimates — Stat Card
 Curated byKory White · Fractional CRO · Maryland
 PULSEKNOWLEDGE LIBRARY
Quality
Certified


This is a downloadable 1600x500 PNG banner titled "Forecast Bands Beat Point Estimates — Stat Card," rendered in gold serif type on a black field. It states the core RevOps argument in one line: a range with a confidence level beats a single committed number. Use it in forecast-review decks, Slack channels, and LinkedIn posts to reframe how your team talks about pipeline coverage.
What it is and why it matters
This banner is a single, shareable visual that compresses one of the most persistent disagreements in revenue operations into a format a VP can read from across a conference room. The title line — "Forecast Bands Beat Point Estimates" — is a claim, not a slogan. It says that when a sales leader reports "$4.2M this quarter," they are hiding more information than they are sharing. A band of "$3.6M–$4.8M at 80% confidence" carries the same center but tells the CFO, the board, and the demand-gen team how much risk sits inside the number.
The reason this matters operationally is that almost every downstream decision consumes the *shape* of the forecast, not just its midpoint. Hiring plans, inventory or capacity commitments, marketing spend, and cash-flow modeling all depend on the downside case. A Point estimate forces everyone to guess the variance. A band makes the variance explicit, which means the argument moves from "is your number right?" to "is your range calibrated?" — a far more productive conversation.
There is also a behavioral effect. When reps and managers know they will be asked for a range, they stop sandbagging to protect a single number and start disclosing genuine uncertainty. That disclosure is the raw material for better Forecast accuracy over time. Teams that track band hit-rates — how often actuals land inside the stated range — typically find their calibration improves within two to three quarters once the feedback loop is visible.

Finally, the banner exists because the concept is easy to agree with in the abstract and easy to abandon under pressure. Pinning it in a forecast channel or dropping it into a QBR deck gives the RevOps lead a shorthand to point at when a manager reverts to a single committed figure. It is a small piece of visual infrastructure for a cultural change.
The step-by-step process
The graphic itself is not the method — it is the artifact that anchors the method. Here is how a team actually moves from Point Estimates to working Bands, and where the banner fits into that rollout.
Step 1 — Baseline your current accuracy. Before changing anything, pull the last four to eight quarters of committed forecast versus closed actuals. Calculate the mean absolute percentage error. Most mid-market SaaS teams land somewhere between 12% and 25% MAPE on a quarterly commit. You need this number because it becomes the honest width of your first band.
_(14779470303).jpg)
Step 2 — Define three tiers, not five. The most common failure mode is over-engineering the band structure. Start with Commit (high confidence, roughly 90%+), Most Likely (the 50–60% zone), and Upside (stretch, 20–30% probability). Three tiers map cleanly to how executives actually make decisions and fit on one slide.
Step 3 — Attach a confidence percentage to each tier. A band without a stated confidence level is just a wider guess. Write it as "Most Likely: $4.1M–$4.6M at 60% confidence." This forces the forecaster to think probabilistically and gives the consumer a way to weight the number.
Step 4 — Run the bands in parallel with the old point commit for one full quarter. Do not rip out the existing process mid-quarter. Shadow-run the bands, compare them at close, and publish both. This is the single most important step for adoption because it produces evidence instead of argument.
_(14759293332).jpg)
Step 5 — Publish the calibration scorecard. After close, show whether actuals landed inside each band. Track it by segment, by manager, and by deal size. Managers whose Commit bands are hit 95% of the time are sandbagging; managers at 60% are over-committing. Both are fixable once visible.
Step 6 — Put the banner where the conversation happens. Drop the PNG into the forecast-review channel, the QBR template, and the onboarding deck for new managers. It is a reminder, not a training course.
The loop back from the calibration check to the shadow-run is deliberate. Band widths are not set once; they drift as the pipeline mix, deal sizes, and rep tenure change. A team that reviews calibration every quarter keeps its Bands honest. A team that sets them once and forgets will find the ranges widening silently until they become meaningless.
_(14759284942).jpg)
Costs, timelines, and typical ranges
The cost of adopting Forecast Bands is almost entirely time and attention, not software. Most CRM platforms — Salesforce, HubSpot, Dynamics — can store band fields and roll them up with configuration rather than custom development. If you already have a BI layer, the reporting is a few calculated fields. Budget the following.
Timeline. A realistic rollout runs one full quarter of shadow-running plus two to four weeks of setup before that. Setup includes defining the band taxonomy, adding fields to the opportunity and forecast objects, building the roll-up report, and training managers. Total elapsed time from decision to bands-as-primary: roughly four to five months. Teams that try to compress this to six weeks usually skip the shadow quarter and lose the adoption battle.
Analyst time. Expect 40 to 80 hours of RevOps analyst time for configuration, report building, and the first calibration analysis. Ongoing, the process adds maybe 2 to 4 hours per week during forecast cycles — mostly reviewing band movement and flagging deals that jumped tiers without a corresponding stage change.
_(14757111664).jpg)
Typical band widths. For a mid-market B2B SaaS company with $20M–$100M ARR, a healthy quarterly band structure often looks like this: Commit at 90% confidence covering roughly 60–70% of the total forecast value; Most Likely at 55–65% confidence covering 85–95%; Upside at 20–30% confidence covering 105–120%. If your Commit band is wider than 15% of its midpoint, your deal-level data is probably too noisy to support tight bands — fix the data before tightening the range.
Where the money actually shows up. The financial return is not in the forecast itself but in the decisions it enables. A capacity plan built on the downside of a band avoids over-hiring by one or two reps per year in a typical mid-market org — that is $150K–$300K in fully loaded cost avoided. A marketing team that knows the downside case can pull forward demand-gen spend in time to matter. These are the numbers to bring to the CFO when justifying the rollout.
_(14759060802).jpg)
Tooling costs. If you need a dedicated forecasting tool, expect $30K–$120K annually depending on seat count and modules. But the banner concept works with zero additional tooling — a spreadsheet with three columns and a confidence percentage is a legitimate starting point for a team under $10M ARR.
Where teams get it wrong
The failure modes are consistent enough that they can be listed almost as a checklist. If you recognize two or more of these in your own rollout, the problem is the process, not the concept.
Mistake 1 — Treating the band as a range of excuses. Some teams adopt Bands and immediately use the wide end to justify missing the Commit number. This destroys credibility faster than a bad point estimate ever could. The rule must be explicit: the Commit tier is a commitment, and missing it requires the same post-mortem it always did. The band adds information; it does not remove accountability.
_(14759357475).jpg)
Mistake 2 — Too many tiers. Five-tier structures look rigorous and are unusable. Executives cannot hold five probability buckets in their head during a live call. Three is the practical ceiling for a working forecast; four is tolerable if the fourth is a clearly labeled "excluded from plan" bucket.
Mistake 3 — No confidence percentages. A band without a stated confidence level is unfalsifiable. "Somewhere between $3M and $5M" tells the consumer nothing about how to weight it. Always pair the range with a number.
Mistake 4 — Ignoring the calibration feedback loop. The entire advantage of Bands is that they are measurable. If you never check whether actuals landed inside the range, you have replaced one unvalidated number with three unvalidated numbers. The scorecard is not optional.
_(14779151303).jpg)
Mistake 5 — Applying one band width to every segment. Enterprise deals and SMB self-serve renewals have wildly different variance profiles. A single global band width will be too wide for renewals and too narrow for new-logo enterprise. Segment the bands, at minimum splitting new business from renewal and enterprise from mid-market.
Mistake 6 — Letting the banner become decoration. Pinning the graphic is the easy part. If the forecast call still opens with "what's your number?" and never asks "what's your range and confidence?", the banner is wallpaper. The language in the meeting has to change, and that is a manager-enablement job, not a design job.
Mistake 7 — Skipping the shadow quarter. Teams under pressure to show progress often jump straight to bands-as-primary. Without a parallel quarter, there is no evidence base, and the first bad quarter kills the initiative. The shadow quarter is the cheapest insurance you will ever buy.
_(14759253435).jpg)
Decision framework: when to choose what
Not every team should adopt Bands at the same depth, and not every forecast consumer needs the same artifact. The framework below maps the decision to context.
Choose full Bands-as-primary when: you have at least four quarters of clean commit-versus-actual history, your CRM opportunity data is reasonably current (stage and amount updated within the last 14 days for deals closing this quarter), and your executive team has explicitly asked for a range rather than a number. This is the ideal case and probably 30–40% of mid-market teams.
Choose shadow-mode Bands when: you have the data but not the executive buy-in, or your forecast process is mid-transformation for another reason. Run both for a quarter, publish the comparison, and let the evidence make the argument.

Choose a simplified two-tier band when: your team is small (under 15 reps), your deal cycle is short (under 45 days), or your forecast is consumed mainly by a founder who is also the head of sales. Commit plus Upside is enough structure; three tiers is overkill.
Stay on Point Estimates when: your revenue is genuinely concentrated in a handful of large deals where a single deal slipping changes the whole picture, and your board has explicitly said they prefer a conservative single number. Even here, track the band internally — you will want the data when the situation changes.
Do not adopt Bands to solve an accuracy problem. If your point estimates are off by 30%, bands will not fix the underlying data hygiene, stage definitions, or rep behavior. Fix those first; Bands amplify whatever signal you already have, good or bad.
Related questions
What is a forecast band?
A forecast band is a revenue projection expressed as a range with an attached confidence level — for example, "$4.1M–$4.6M at 60% confidence" — rather than a single committed figure. It replaces the Point estimate with a distribution, making the uncertainty in the forecast explicit and measurable.
Why do bands beat point estimates?
Bands carry more information. A single number hides variance that downstream decisions — hiring, spend, capacity — depend on. Bands also create a calibration feedback loop: you can measure how often actuals land inside the range, which point estimates make impossible to assess meaningfully.
How wide should a forecast band be?
Width should reflect historical error, not ambition. Start from your mean absolute percentage error over the last four to eight quarters. If your MAPE is 15%, a Commit band narrower than roughly 10–15% of its midpoint is probably dishonest. Segment widths by deal type.
How many tiers should a forecast have?
Three is the practical maximum for a working forecast: Commit, Most Likely, and Upside. Five-tier structures look rigorous but are unusable in a live review call. Small teams with short cycles can run two tiers — Commit and Upside — effectively.
What is forecast calibration?
Calibration is the match between stated confidence and observed outcomes. If your "90% confidence" Commit band is hit only 70% of the time, you are over-confident. Tracking calibration by manager and segment is the core ongoing discipline that makes Bands worth the effort.
FAQ
Does adopting forecast bands require new software? No. Most CRM platforms can store band fields and roll them up with configuration rather than custom code. Teams under $10M ARR can run a legitimate three-tier band process in a spreadsheet. Dedicated forecasting tools add convenience and scenario modeling, but they are not a prerequisite for the method.
How long before bands improve forecast accuracy? Expect the first measurable calibration improvement within two to three quarters of consistent tracking. The shadow quarter produces the evidence; the following one to two quarters produce the behavior change. Teams that skip the shadow quarter typically see no improvement because they never establish a baseline.
What if my executives insist on a single number? Give them the single number — the Commit tier — but publish the band alongside it. Over one or two quarters, show them the calibration data and the decisions the wider range would have enabled. The argument is won with evidence, not with process reform.
Do bands work for renewal revenue? Yes, and often better than for new business, because renewal variance is lower and more predictable. Renewal bands tend to be tighter — sometimes 5–8% of midpoint at high confidence. Segment them separately from new-logo forecasts, which carry wider ranges.
How do I stop managers from using the wide end as an excuse? Make the Commit tier explicitly accountable. Missing Commit triggers the same post-mortem it always did. The band adds information for planning; it does not dilute the commitment. State this in writing before the rollout, not after the first miss.
Can I use this banner in my own team's materials? Yes. The PNG is designed to be dropped into decks, Slack channels, and LinkedIn posts. If you want to customize the wording or colors for your own team, keep the core claim intact — the value of the artifact is the argument it makes, not the specific typeface.
Sources
- Salesforce — Sales Forecasting Guide
- HubSpot — Sales Forecasting: How to Forecast Sales
- Gartner — Sales Forecasting and Pipeline Management Research
- Harvard Business Review — Why Sales Forecasting Is So Hard
- McKinsey — The B2B Sales Forecast: Getting It Right
- Forrester — Revenue Operations Research
- Sales Management Association — Forecasting Research
- CFO.com — Forecasting and Planning Coverage
Related on PULSE
- Forecast Accuracy Metrics Every RevOps Team Should Track
- How to Run a Shadow Forecast Quarter
- Pipeline Coverage Ratios: What Good Looks Like
- Commit vs. Most Likely vs. Upside: Defining Your Tiers
- Building a Forecast Calibration Scorecard
- When Point Estimates Still Make Sense
This page will be disappearing soon. Save it to your device for $1 — or read it free while it is here.
@Kory-White- · if Venmo asks, the last 4 of my number are 2012
This page is gone.
This one is off the shelf now. $1 keeps it on your phone for good — the whole page, pictures and diagrams included.
 graphicTime to Value > ACV — RevOps Banner
 graphicOutcome pricing beats seat pricing — RevOps Banner
 graphicAI does 60% of SDR work — RevOps Banner
 graphicChampion departure = #1 churn predictor — RevOps Banner
 graphicMQL is dead. Long live PQL. — RevOps Banner
 graphic“A confused buyer never buys.” — LinkedIn Banner
 graphicVP of Sales — LinkedIn Banner
 graphicPerformance — Section Divider Slide
 graphicAI Observability Operator — LinkedIn Banner
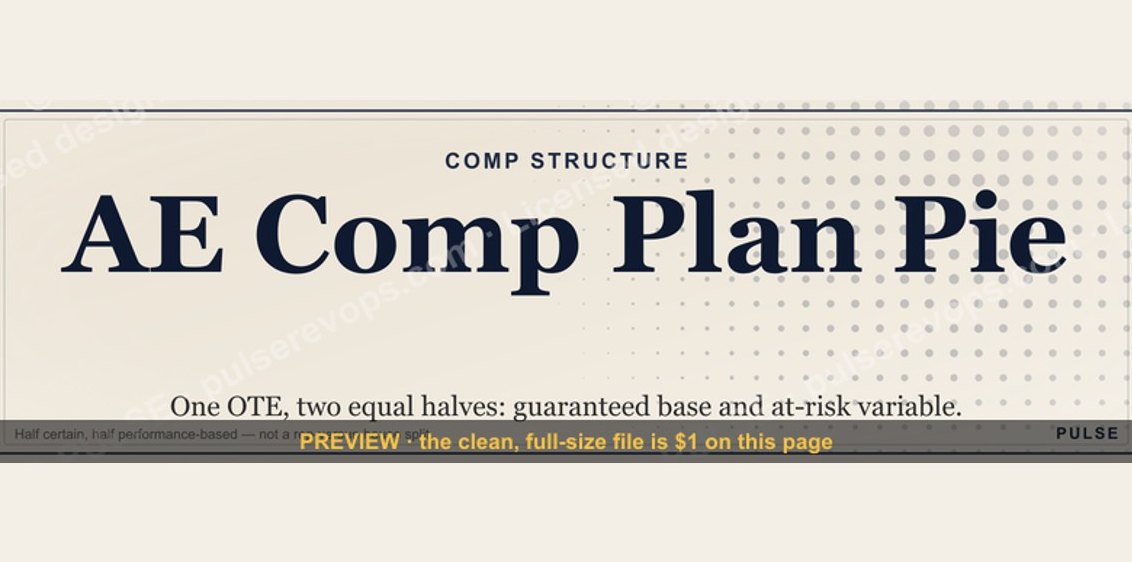 graphicAE Comp Plan Pie — 50/50 Split