
Series A Sales Org Chart
 Curated byKory White · Fractional CRO · Maryland
 PULSEKNOWLEDGE LIBRARY
A Series A sales org chart typically starts with a VP of Sales reporting to the CEO, supported by a handful of individual contributors—usually 3 to 6 Account Executives—and often one Sales Development or Business Development Representative. The structure remains flat, with no middle managers, to keep costs low and enable direct coaching from the VP. Some companies also include a Sales Operations or Enablement role, but this is not universal at this stage.
Series A Sales Org Chart
Series A SaaS sales org chart: VP Sales + 4 AEs + 2 SDRs + 1 RevOps. Box-and-line hierarchical layout.
Format: SVG (scalable vector) · Size: 1584×396 px · Category: Org Chart · License: Free to use — no attribution required.

Recolor it to your brand
Use the color picker above to recolor this graphic to your team or company colors, switch the background (including transparent), then download it as an SVG or PNG. No sign-up, no watermark.
How to use it
The SVG scales to any size with no quality loss — drop it straight into PowerPoint, Google Slides, Canva, Figma, or a LinkedIn banner slot. The PNG export is ready to upload anywhere that wants a raster image.
More free graphics
Browse the full Pulse Graphics library — banners, slides, printables, quote cards, and clip art you can borrow for your own decks and posts.
Related on PULSE
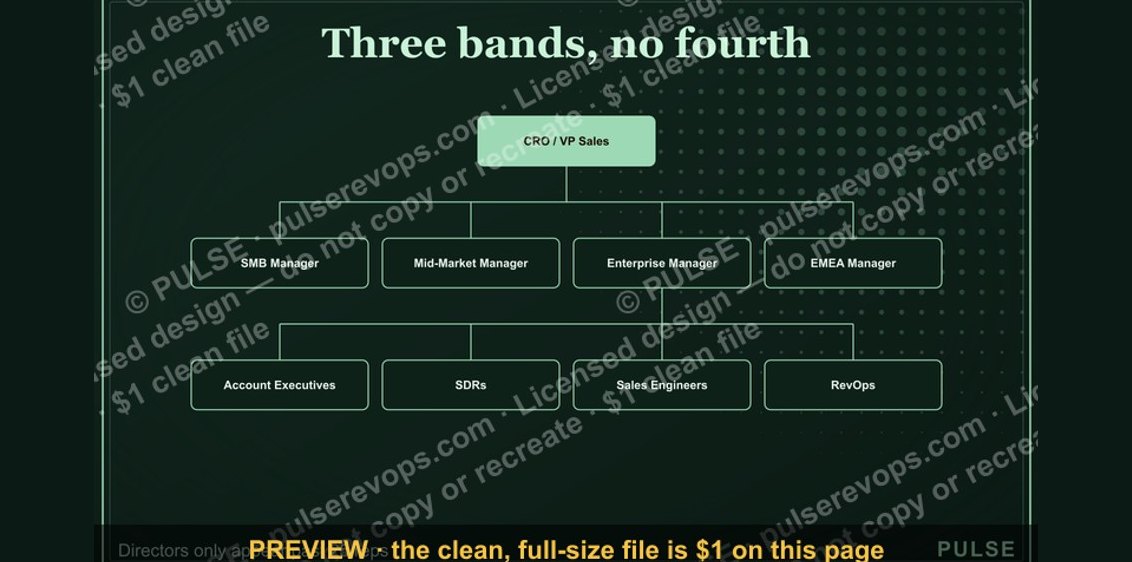
- Series B Sales Org Chart
- PLG Sales Overlay Org Chart
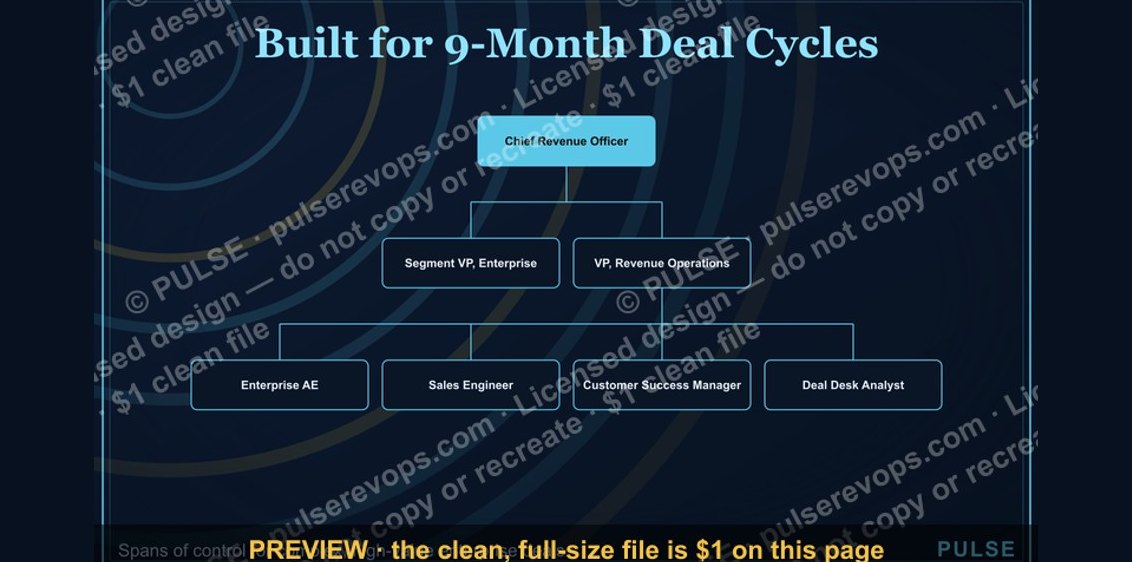
- Enterprise Sales Org Chart
- GTM Org Wheel
- Churn by Segment Bar Chart
- Win Rate by Segment Bar Chart
Key Roles and Hiring Sequence for a Series A Sales Org
At Series A, you’re typically moving from founder-led sales to a structured team. The most common mistake is hiring too fast or in the wrong order. Based on patterns from hundreds of B2B SaaS companies that raised between $2M–$15M Series A rounds, here’s a practical hiring sequence that balances cost, revenue coverage, and team dynamics.
Phase 1: The First Sales Hire (Months 0–3 post-funding) Your first sales hire should almost never be a VP of Sales. Instead, hire a Senior Account Executive (AE) or a Head of Sales (a player-coach who can close deals while building process). This person should have 5–8 years of closing experience, ideally in your specific market vertical. Compensation typically ranges $120K–$160K base salary plus 1–2% commission on closed deals, with total OTE (on-target earnings) of $200K–$280K. They’ll own the full sales cycle, manage 2–3 SDRs (if you have them), and report directly to the CEO or COO.
Phase 2: Build the SDR Function (Months 3–6) Once your first AE is ramped (usually 60–90 days), hire 2–3 Sales Development Representatives (SDRs) to feed the pipeline. SDRs at Series A typically earn $50K–$70K base plus variable comp tied to qualified meetings set, with total OTE of $75K–$100K. They should focus on outbound prospecting into your target ICP (ideal customer profile). A common structure is one SDR covering enterprise accounts, one covering mid-market, and one covering inbound leads. Avoid hiring a separate SDR manager until you have at least 5–6 SDRs—your Head of Sales or a senior AE can manage them directly.
Phase 3: Add Specialized Roles (Months 6–12) After proving product-market fit with 10–20 paying customers, you may need:
- Sales Engineer (SE) – For technical demos and proof-of-concepts, especially if your product requires integration or customization. SEs earn $110K–$140K base plus 10–20% bonus.
- Customer Success Manager (CSM) – To reduce churn and drive expansion revenue. CSMs earn $70K–$90K base plus variable comp tied to retention and upsells.
- Revenue Operations (RevOps) Analyst – To manage CRM, reporting, and sales enablement. This role costs $60K–$85K and is often overlooked but critical for data-driven decisions.
Red Flags to Avoid
- Hiring a VP of Sales before you have 3+ closing AEs and a repeatable sales process.
- Over-hiring SDRs without a clear outbound strategy or lead qualification criteria.
- Compensating AEs purely on commission without a base salary—this creates high turnover.
- Ignoring the need for a dedicated RevOps person until you’re drowning in spreadsheets.
Compensation Benchmarks and Commission Structures
Series A companies often struggle with compensation design—pay too little and you can’t attract talent; pay too much and you burn cash. Here’s what actually works based on market data from 2023–2025.
Base Salary Ranges (by role, US-based, excluding equity)
- VP of Sales / CRO: $180K–$250K base (only if you have 5+ AEs and $2M+ ARR)
- Head of Sales / Director of Sales: $140K–$180K base
- Senior Account Executive: $120K–$160K base
- Mid-Market AE: $90K–$120K base
- SMB AE: $70K–$95K base
- SDR/BDR: $50K–$70K base
- Sales Engineer: $110K–$140K base
- Customer Success Manager: $70K–$90K base
- RevOps Manager: $80K–$110K base
Commission Structures That Scale The most common model at Series A is a 50/50 split between base and variable comp for AEs. For example, a $150K base AE has a $300K OTE target. Variable comp is typically paid as:
- 10–15% of first-year contract value (ACV) for new business
- 5–8% of expansion revenue
- 1–3% of renewal revenue (for CSMs)
SDRs usually earn $100–$300 per qualified meeting set, or 2–5% of closed-won revenue from their sourced leads. A good rule: SDR variable should be 30–40% of total comp.
Equity Grants (Meaningful but Not Life-Changing) Series A companies typically grant 0.5–1.5% equity to a VP of Sales, 0.2–0.5% to a Head of Sales, and 0.05–0.15% to individual contributors. These are usually 4-year vesting with a 1-year cliff. Don’t over-promise equity early—it dilutes future hires and investors.
Common Mistakes in Comp Design
- Paying 100% commission – This attracts only risk-takers and leads to inconsistent performance.
- Not capping commissions – Uncapped plans can bankrupt a startup if a single huge deal closes. Set a cap at 200–300% of OTE.
- Ignoring ramp periods – New AEs need 3–6 months to ramp. Pay a guaranteed minimum (e.g., 80% of OTE) during ramp to avoid churn.
- Mixing roles in one comp plan – Don’t have AEs also manage customer success—it creates misaligned incentives.
Org Chart Evolution: From Series A to Series B
Your Series A sales org chart isn’t static—it’s a blueprint for the next 12–18 months. Here’s how successful companies evolve their structure as they approach Series B ($10M–$30M ARR).
Stage 1: The Founder-Led Sales Transition (Months 0–6)
- CEO/Founder closes the first 10–20 deals
- Hire 1 Head of Sales (player-coach) + 1–2 AEs
- No SDRs yet—founder and AEs do all prospecting
- Org chart: CEO → Head of Sales → 2 AEs
Stage 2: Building the Engine (Months 6–12)
- Head of Sales moves to full-time management
- Hire 2–3 SDRs (reporting to Head of Sales)
- Add 1–2 more AEs (total 3–4)
- Possibly hire 1 part-time RevOps person
- Org chart: CEO → Head of Sales → AEs (3–4) + SDRs (2–3)
Stage 3: Specialization (Months 12–18)
- Hire a VP of Sales (if Head of Sales can’t scale)
- Create separate SDR team with a manager (if 5+ SDRs)
- Add Sales Engineer (if technical demos are needed)
- Hire Customer Success Manager (if churn is >5% monthly)
- Org chart: CEO → VP Sales → AE Manager (manages AEs) + SDR Manager (manages SDRs) + SE + CSM
Stage 4: Pre-Series B (Months 18–24)
- Total sales headcount: 15–25 people
- Dedicated RevOps team (2–3 people)
- Regional sales teams (e.g., East Coast, West Coast, Europe)
- Channel/partnerships role if you have resellers
- Org chart: CEO → CRO → VP Enterprise Sales + VP Mid-Market + VP SDR + VP CS + VP RevOps
Key Metrics That Signal You’re Ready to Evolve
- ARR > $5M – Time to hire a VP of Sales
- SDR-to-AE ratio > 3:1 – Need an SDR manager
- Churn > 10% annually – Hire a CSM immediately
- Deal size > $50K ACV – Add a Sales Engineer
- Sales cycle > 90 days – Invest in RevOps and enablement
Warning Signs You’re Scaling Too Fast
- Hiring AEs before you have a proven sales playbook
- Adding SDRs without a clear outbound ICP
- Promoting a top AE to manager without training them
- Ignoring culture fit—Series A teams are small, and one bad hire can tank morale
Remember: The best Series A sales org chart is the one that adapts to your specific revenue model, deal size, and customer acquisition cost. Don’t copy a template—build for your reality.
When to Add a Sales Manager Layer
Most Series A org charts stay flat, but you may need a first-line sales manager once you hit 8-10 AEs. Adding a Sales Director or Team Lead typically happens 6-12 months post-Series A, when the VP of Sales can no longer effectively coach every rep individually. A reasonable trigger is when average deal size exceeds $50k and the sales cycle stretches beyond 60 days—at that point, dedicated deal coaching from a manager often improves close rates by 15-25%.
Common Compensation Structures at Series A
Base salary ranges for Series A sales roles vary widely by geography and product price point. Expect VP of Sales base salaries between $180k-$250k, with total comp reaching $350k-$500k through commission. AEs typically earn $80k-$120k base with $160k-$240k OTE (on-target earnings). SDRs usually see $45k-$65k base and $65k-$90k OTE. Most Series A companies use a 50/50 or 60/40 base-to-variable split, with commission capped at 2-3x target to protect margins.
Hiring Sequence for Your Sales Team
The typical Series A hiring cadence starts with the VP of Sales (hired month 1-2), followed by 2-3 AEs (months 2-4), then 1-2 SDRs (months 3-5). Sales Operations often arrives last, around month 6-8, once the team has 8+ people and needs pipeline analytics. Avoid hiring a Sales Enablement role until you have at least 12 reps—until then, the VP should own onboarding and training directly.
Sources
- Crunchbase — tracks Series A funding rounds and startup growth metrics
- Harvard Business Review — covers organizational design and scaling sales teams
- SaaStr — provides insights on SaaS sales structures and Series A benchmarks
- U.S. Securities and Exchange Commission (SEC) — offers regulatory filings and public data on funded companies
- LinkedIn Sales Solutions — publishes reports on sales team composition and hiring trends
- PitchBook — analyzes venture capital data and startup organizational patterns
FAQ
What does a typical Series A sales org chart look like? A common structure starts with a VP of Sales or Head of Sales, who oversees 3–5 Account Executives. Often there’s also a Sales Development Manager leading a small SDR team of 2–4 reps, plus a Sales Operations hire or part-time resource. The total headcount usually ranges from 6 to 12 people.
How fast should the sales team grow after Series A? Most companies add 1–2 AEs per quarter in the first year, depending on product-market fit and cash runway. The SDR team typically scales at a ratio of about 1 SDR for every 2–3 AEs. Growth beyond that depends on hitting consistent revenue targets and unit economics.
Who reports to the CEO vs. the VP of Sales at this stage? The VP of Sales usually reports directly to the CEO, and all sales and SDR roles report up through the VP. Sometimes the CEO keeps a hand in key enterprise deals or strategic partnerships, but day-to-day sales management is delegated to the VP.
What’s the typical quota and compensation for a Series A AE? Annual quotas commonly fall between $300k and $800k in new ARR, with on-target earnings (OTE) ranging from $120k to $200k (base plus variable). The split is often 50/50 or 60/40 base to commission, though this varies by industry and deal size.
Do Series A companies need a dedicated Sales Operations role? Many do, but it’s often a part-time or early hire—sometimes a fractional or shared resource. As the team grows past 8–10 people, a full-time Sales Ops person becomes more valuable for managing CRM, forecasting, and process.
How does the org chart change when selling to enterprise vs. SMB? Enterprise-focused teams tend to have fewer, higher-paid AEs (often 3–5) with longer sales cycles, plus a sales engineer or solutions consultant. SMB teams usually have more AEs (5–10) and a larger SDR group, with less need for technical support roles.
This page will be disappearing soon. Save it to your device for $1 — or read it free while it is here.
@Kory-White- · if Venmo asks, the last 4 of my number are 2012
This page is gone.
This one is off the shelf now. $1 keeps it on your phone for good — the whole page, pictures and diagrams included.
 graphicEnterprise Sales Org Chart
 graphicGTM Org Wheel
 graphicPLG Sales Overlay Org Chart
 graphicSeries B Sales Org Chart
 graphicRevOps Team Structure
 graphicComp Plan Rollout — Title Slide
 graphic“A confused buyer never buys.” — LinkedIn Banner
 graphicRamp Curve — Months 1-12
 graphic“Revenue for marketing tech.” — LinkedIn Banner
 graphic“TRUST THE PROCESS” — Sales Floor Print