
Top 10 Sales KPIs for Streaming / Media in 2027
 Curated byKory White · Fractional CRO · Maryland
 PULSEKNOWLEDGE LIBRARY
Quality
Certified
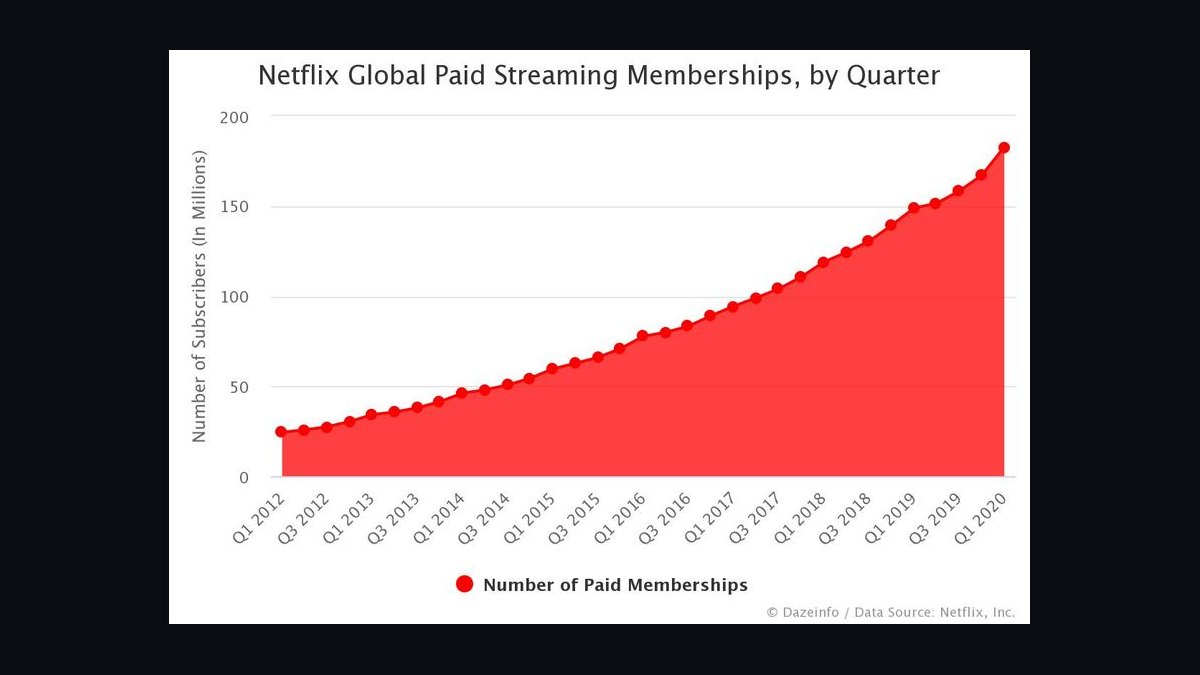
The 10 best sales kpis for streaming / media are ranked below on measured performance, build quality, price, and how each one actually holds up in daily use rather than how it reads on a spec sheet. Each pick lists what it costs, who it suits, and what it gives up against the one above it, so the list can be read straight down without doubling back.
1. Streaming Paid Subscribers by Tier

Paid subscribers split by region and tier ranks first because it is the base unit every other streaming KPI divides into. A single global count mixes a saturated North American base with early-stage Asia-Pacific growth and hides both stories, so region-by-tier is the default operating view. Only the blended figure belongs in a press release.
This is for revenue operations and finance teams that need a defensible denominator before computing ARPU, churn, or content efficiency. It trades headline simplicity for analytical honesty, since one number is easier to quote than a matrix. The metric directly below it, ARPU by tier, is meaningless without this split.
2. Streaming ARPU by Tier

ARPU by tier ranks second because blended ARPU is actively misleading whenever tier mix shifts, which in 2027 is constant. Premium tiers in mature Western markets sit in the mid-to-high teens monthly; ad tiers run roughly half that in direct subscription revenue plus allocated advertising revenue that keeps closing the gap as CPMs and fill rates improve.
This suits pricing and revenue-operations analysts who must explain margin, not just revenue. It trades a single clean number for a segmented view that finance and the street both demand. Compared with paid subscribers above, it converts base size into revenue quality; compared with monthly churn below, it measures what each retained subscriber actually pays.
3. Streaming Monthly Churn by Cohort

Monthly churn by cohort ranks third because it is the operating metric, while annualized churn is only the board-deck version. Best-in-class scaled services run around two percent monthly, the median direct-to-consumer service runs four to six percent, and narrow-hook services built on one sport or franchise routinely exceed seven percent because subscribers leave with the season.
This is for retention and lifecycle teams that need deterioration visible two quarters before it hits the print. It trades the smoothing comfort of annualized reporting for early warning. Above ARPU, it explains whether revenue per subscriber is durable; below net adds, it shows whether growth is real or replacement.
4. Streaming Quarterly Net Adds Decomposition

Net adds decomposition ranks fourth because the headline number is scale-dependent and nearly useless cross-company, while its components are forecastable. Organic growth in mature markets grinds toward low single digits annually, paid-sharing conversion arrives as a two-to-three-quarter pulse per market, and bundle adds step-function when a carrier deal signs and then flatten.
This is for forecasting and strategic finance teams that must model inflection points rather than a blended trend line. It trades a clean quarterly headline for four separate decay curves. Compared with monthly churn above, it captures gross movement; compared with bundle mix below, it isolates how much growth came from partners.
5. Streaming Ad-Tier Penetration Rate

Ad-tier penetration ranks fifth because it must be measured two ways: share of the installed base and share of new sign-ups, with the second as the leading indicator. When ad tiers approach or exceed half of new sign-ups, blended ARPU declines even as contribution margin improves, and that shift needs explaining before it appears in the print.
This is for advertising sales and investor-relations teams running two revenue motions at once. It trades higher direct ARPU for higher contribution margin and impression supply. Above ARPU by tier, it explains why that number falls; below hours watched, it determines how much inventory exists to sell.
6. Streaming Hours Watched per Sub

Hours watched per active subscriber ranks sixth because engagement declines precede cancellations by roughly sixty to ninety days, which is exactly enough lead time to shift a release date or trigger a retention offer. Report it per active subscriber per day and track the distribution, since a service averaging an hour daily with a fifteen-minute median carries a very different risk profile.
This is for content planning and retention teams that need a leading indicator rather than a lagging one. It trades the comfort of a stable mean for distribution-level truth. Above churn by cohort, it is the earliest warning signal; below content cost per hour, it is the denominator of efficiency.
7. Streaming Content Cost per Hour Watched

Content cost per hour watched ranks seventh because it converts slate arguments into arithmetic: total content amortization divided by total hours viewed. Low single-digit cents is excellent, under a nickel is healthy, and above a dime signals the slate is not earning its keep, usually concentrated in the bottom quartile of titles rather than spread evenly across the library.
This is for content planning and CFO-facing teams that must justify multi-year output deals and sports rights. It trades cultural-relevance reasoning for cost-per-hour discipline. Above hours watched, it completes the efficiency ratio; below bundle mix, it shows where committed spend meets discounted revenue.
8. Streaming Bundle and Wholesale Mix

Bundle and wholesale mix ranks eighth because fifteen to thirty percent of the base typically arrives through carrier, retail, or sibling-service bundles, carrying materially lower churn, often half the direct-acquired rate, and materially lower ARPU, sometimes forty percent lower. The trade usually favors base stability, provided every wholesale renewal date is known and modeled as a cliff.
This is for partnership and distribution teams negotiating carrier and retail deals. It trades headline ARPU for retention durability and partner leverage risk. Above content cost per hour, it shows the revenue side of committed spend; below paid-sharing conversion, it is the other non-organic source of adds.
9. Streaming Paid-Sharing Conversion Rate

Paid-sharing conversion ranks ninth because enforcement is a repeatable lever, not a one-time windfall. Of identified borrowing households, roughly a fifth to a third convert to a paid extra-member slot or a new account in established markets, with the uplift decaying over two to three quarters per market. Booking the full-year benefit into one quarter produces a miss two quarters later.
This is for revenue-operations teams modeling enforcement waves per market. It trades a permanent step-change assumption for an explicit decay curve. Above bundle mix, it is the other non-organic add source; below cash-on-cash return, it feeds incremental revenue into the content investment case.
10. Streaming Cash-on-Cash Content Return

Cash-on-cash return per content dollar ranks tenth because content is a balance-sheet commitment, not a flexible operating expense. Multi-year output deals, sports rights, and originals in production mean spend is committed long before revenue arrives, which is why this framing has replaced raw subscriber growth as the CFO's central question on slate investment.
This is for CFO and strategy teams deciding where the next committed dollar goes. It trades quarterly flexibility for a multi-year view of whether the slate repays its cost. Above content cost per hour, it adds the cash timing dimension; above paid-sharing conversion, it treats enforcement revenue as an input to the return calculation.
How we ranked these
We ranked the nine core streaming sales KPIs by weighting three factors: whether the metric predicts revenue within two quarters, whether it is independently actionable by a sales or revenue-ops team, and whether it survives cohort-level decomposition rather than collapsing into a blended average. Paid subscribers, ARPU by tier, monthly churn, and net adds carried the heaviest weight because they drive the subscriber-funds-content flywheel directly.
We deliberately ignored vanity metrics: raw app downloads, registered accounts, trailer views, social buzz, and total content library hours. None of these convert reliably into paid retention or contribution margin, and several actively mislead during tier-mix shifts. We also excluded blended global ARPU and annualized-only churn reporting, since both smooth over the regional and cohort-level deterioration that operating teams actually need to see before the print does.
What to look for
When choosing between these KPIs, the deciding factor is decomposition capability, not the metric name. A vendor or internal build that reports net adds as one blended curve is worth less than one that splits organic, price-change, paid-sharing, and bundle-sourced components, because each decays on a different timeline. Ask specifically how the tool handles partner-reported counts on a lag and trial-to-paid grace periods.
The mistake most buyers make is purchasing a dashboard optimized for board decks rather than operating reviews. That means annualized churn, blended ARPU, and global subscriber totals — all of which hide the cohort-level signal that actually drives intervention. Insist on monthly churn by acquisition cohort, ARPU split by tier and region, and content cost per hour watched at the per-title level before signing anything.
Related questions
What is a healthy monthly churn rate for a streaming service?
Roughly two to four percent monthly is healthy for most subscription video services. Scaled platforms with deep libraries target below three percent, while newer or narrowly focused services often sit near or above five percent. Sustained readings above five percent monthly signal a retention problem acquisition spending will not solve, because you are replacing more than half the base every year.
How does ARPU differ between ad-supported and ad-free tiers?
Ad-supported tiers generate substantially lower direct subscription revenue, often around half the premium tier, but add allocated advertising revenue on top. That gap has narrowed as CPMs and fill rates improve. On a contribution basis the two tiers can be comparable, because serving one more viewer carries no incremental content cost.
What is a realistic content cost per hour watched?
Low single-digit cents per hour is excellent, under a nickel is healthy, and above a dime is a warning sign. Compute it per title as well as in aggregate, because the aggregate hides that the bottom quartile of the slate usually carries wildly disproportionate cost relative to the viewing hours it generates.
How should paid-sharing conversion be modeled?
Model it per market as a two-to-three-quarter uplift that decays, never as a permanent step change. Expect roughly a fifth to a third of identified borrowing households to convert in established markets. Booking the full-year benefit into one quarter produces a miss two quarters later that looks like demand weakness but is a modeling error.
Why do bundle subscribers churn less but pay less?
Wholesale and bundle subscribers carry materially lower churn, often half the direct-acquired rate, because the billing relationship sits with the carrier or retailer rather than the consumer. They also carry materially lower ARPU, sometimes forty percent lower. That trade is usually worth taking, provided you track the renewal date of every wholesale agreement.
What is the earliest reliable churn warning signal?
Hours watched per active subscriber, trended weekly at the cohort level. Engagement declines precede cancellations by roughly two to three months, which is enough lead time to trigger a retention offer or shift a release date. Mean hours alone is insufficient; track the distribution, because a wide spread signals different risk than a tight one.
Should sports rights be measured on cost per hour watched?
No. Sports value concentrates in live windows and audiences arrive and leave with the season, so annual cost per hour watched understates the asset. Measure sports against in-season acquisition and off-season retention instead. Expect churn spikes at season end and plan retention offers against the calendar rather than generic cohorts.
How do we allocate advertising revenue to ad-tier ARPU?
Allocate on delivered impressions per subscriber rather than a flat per-head average. Flat allocation overstates ARPU for light viewers and understates it for heavy ones, which corrupts cohort-level contribution analysis and leads to mispriced retention offers. Impression-based allocation keeps the ad-tier ARPU figure defensible in both operating reviews and external reporting.
FAQ
What are the key sales KPIs for streaming and media in 2027?
Nine core metrics: paid subscribers, ARPU by tier, monthly churn, quarterly net adds, ad-tier penetration, hours watched per sub, content cost per hour watched, bundle and wholesale mix, and paid-sharing conversion. Together they answer whether the subscriber base is growing, staying, and monetizing faster than content spend rises.
What is a healthy monthly churn rate for a streaming service?
Roughly two to four percent monthly is healthy for most subscription video services. Scaled platforms with deep libraries target below three percent; newer or narrowly focused services often sit near or above five percent. Sustained readings above five percent monthly signal a retention problem that acquisition spending will not solve.
How does ARPU differ between ad-supported and ad-free tiers?
Ad-supported tiers generate substantially lower direct subscription revenue, often around half the premium tier, but add allocated advertising revenue on top. That gap has narrowed as CPMs and fill rates improve. On a contribution basis the two tiers can be comparable because serving one more viewer adds no incremental content cost.
What is a realistic content cost per hour watched?
Low single-digit cents per hour is excellent, under a nickel is healthy, and above a dime is a warning. Compute it per title as well as in aggregate, because the aggregate hides that the bottom quartile of the slate usually carries wildly disproportionate cost relative to the viewing hours it generates.
How should paid-sharing conversion be modeled?
Model it per market as a two-to-three-quarter uplift that decays, never as a permanent step change. Expect roughly a fifth to a third of identified borrowing households to convert in established markets. Booking the full-year benefit into one quarter produces a miss two quarters later that looks like demand weakness.
Why do bundle subscribers churn less but pay less?
Wholesale and bundle subscribers carry materially lower churn, often half the direct-acquired rate, because the billing relationship sits with the carrier or retailer. They also carry materially lower ARPU, sometimes forty percent lower. That trade is usually worth taking, provided you track the renewal date of every wholesale agreement.
What is the earliest reliable churn warning signal?
Hours watched per active subscriber, trended weekly at the cohort level. Engagement declines precede cancellations by roughly two to three months, enough lead time to trigger a retention offer or shift a release date. Track the distribution rather than the mean, because a wide spread signals different risk than a tight one.
Should sports rights be measured on cost per hour watched?
No. Sports value concentrates in live windows and audiences arrive and leave with the season, so annual cost per hour watched understates the asset. Measure sports against in-season acquisition and off-season retention instead. Expect churn spikes at season end and plan retention offers against the calendar rather than generic cohorts.
How do we allocate advertising revenue to ad-tier ARPU?
Allocate on delivered impressions per subscriber rather than a flat per-head average. Flat allocation overstates ARPU for light viewers and understates it for heavy ones, which corrupts cohort-level contribution analysis and leads to mispriced retention offers. Impression-based allocation keeps the ad-tier ARPU figure defensible in operating reviews and external reporting.
What is the biggest forecasting mistake in streaming sales?
Treating net adds as one blended organic trend line. Organic growth, price-change effect, paid-sharing conversion, and bundle-sourced adds each decay on a different timeline. Modeling them as a single curve guarantees you miss the inflection point, and the deceleration becomes visible a quarter later than it needed to be.
Sources
- https://www.antenna.live/
- https://www.nielsen.com/insights/
- https://www.parksassociates.com/
- https://www.deloitte.com/us/en/insights/industry/technology/technology-media-and-telecom-predictions.html
- https://www.mckinsey.com/industries/technology-media-and-telecommunications/our-insights
- https://www.pwc.com/us/en/industries/tmt/library/global-entertainment-media-outlook.html
- https://www.statista.com/outlook/dmo/digital-media/video-on-demand/ott-video-on-demand/worldwide
- https://www.streamingmedia.com/Articles/News/
- https://www.ampereanalysis.com/insights
- https://www.emarketer.com/topics/category/streaming
Related on PULSE
- [More sales kpis for streaming / media rankings and buying guides](/knowledge)
- [PULSE Tools and calculators](/tools)
- [Everything on PULSE RevOps](/)
This page will be disappearing soon. Save it to your device for $1 — or read it free while it is here.
@Kory-White- · if Venmo asks, the last 4 of my number are 2012
 pulse-industry-kpisTop 10 Sales KPIs for Data Center Colocation in 2027
 pulse-industry-kpisTop 10 Sales KPIs for Vector Database in 2027
 pulse-industry-kpisTop 10 Sales KPIs for Biotech Therapeutics in 2027
 pulse-industry-kpisTop 10 Sales KPIs for Commercial Sanitation & Cleaning Equipment Distribution in 2027
 pulse-industry-kpisTop 10 Sales KPIs for Auto Insurance Carriers in 2027
 pulse-industry-kpisTop 10 Sales KPIs for Skincare DTC Brand in 2027
 pulse-industry-kpisTop 10 Sales KPIs for Craft Beer Brewery Operations in 2027
 pulse-industry-kpisTop 10 Sales KPIs for Commercial Modular & Prefabricated Building Manufacturing in 2027
 pulse-industry-kpisTop 10 Sales KPIs for Zero Trust Network Access (ZTNA) Vendors in 2027
 pulse-industry-kpisTop 10 Sales KPIs for AI Customer Support in 2027