
What are the key sales KPIs for the Commercial Insulation Contracting industry in 2027?
 PULSEKNOWLEDGE LIBRARY
What are the key sales KPIs for the Commercial Insulation Contracting industry in 2027?
> TL;DR: Commercial insulation contracting in 2027 lives or dies on nine KPIs: bid-hit rate (22-32% on commercial GC bids, 35-45% on mechanical-contractor negotiated work), revenue per crew-day ($4,800-$8,200 for mechanical insulation, $2,400-$3,800 for thermal/acoustic batt and board), backlog coverage (4.5-7.5 months of forward revenue), gross margin by scope (24-28% mechanical, 18-22% thermal, 32-38% firestopping), change-order capture (8-14% of base contract on commercial new construction), labor productivity ($/SF or $/LF installed against estimate), customer concentration (top 5 GCs/MCs <55% of revenue), DSO (52-72 days net of retention), and energy-code retrofit attach rate (15-25% of facility-manager accounts converting to envelope or mechanical upgrade scopes). IECC 2024 adoption, ASHRAE 90.1-2022, and the federal building-performance standards push commercial demand up roughly 6-9% annually through 2028; operators who track these nine numbers weekly beat the field on margin and grow without blowing up working capital.
Why Commercial Insulation Contracting Sells Differently
Commercial insulation is not residential insulation with a bigger truck. The buyer, the scope, the spec, and the cash cycle all behave differently, and KPIs that look right in a Service Titan dashboard will mislead an operator selling into commercial GCs and industrial plants.
Mechanic 1: The buyer is a contractor, not the building owner. Roughly 78-85% of commercial insulation revenue flows through general contractors, mechanical contractors, or sheet-metal contractors as a subcontract scope. The end user, usually a developer, REIT, hospital system, or industrial plant operator, almost never signs the insulation contract directly. That means sales is a B2B relationship sale on bid-day price and a project-management sale on RFI response time, submittal turnaround, and not-blowing-the-schedule. Operators who chase building owners directly waste cycles unless they are pursuing facility-manager retrofit work, which is a separate motion.
Mechanic 2: Scope splits margin three ways. Mechanical insulation (pipe, duct, equipment, fittings) runs 24-28% gross at the project level because labor productivity is measurable in linear feet per crew-day and material is spec'd by R-value or thickness. Thermal/acoustic building insulation (batt, board, spray foam, mineral wool) runs 18-22% because GC bid lists are deeper and price compression is brutal. Firestopping and through-penetration sealing, often pulled into the insulation scope on commercial work, runs 32-38% because UL listings, inspector relationships, and documentation discipline create a real moat. Mixing all three into one "gross margin" number hides where the business is actually making money.
Mechanic 3: Energy code is the demand engine. IECC 2021 and 2024 adoption (now mandatory or referenced in 41 states for commercial construction) and ASHRAE 90.1-2022 have tightened envelope U-values, raised mechanical insulation thickness minimums, and added continuous-insulation requirements that did not exist in older codes. Federal Building Performance Standards (BPS) ordinances in roughly 14 major metros now require existing commercial buildings to hit energy-use-intensity targets, which generates retrofit work. The contractors who track which jurisdictions are on which code cycle, and which retrofit ordinances are triggering compliance deadlines, see demand 18-30 months before the bid list lands.

Mechanic 4: Bidding is volume-and-velocity, not consultative. A mid-size commercial insulation contractor bids 180-340 jobs per year per estimator to win 40-80. Estimating speed, takeoff accuracy on Bluebeam Revu, and supplier price-locks (Owens Corning, CertainTeed, Knauf, Johns Manville, Roxul, Armacell) matter more than discovery calls. The KPI that drives growth is not pipeline coverage in dollars, it is bids-submitted-per-estimator-per-week and the hit-rate that comes out the other end.
The 9 KPIs, In Depth
These are the nine numbers a commercial insulation contractor's sales and ops leadership should see every Monday morning. Benchmarks below are pulled from operator-side data on companies doing $8M-$220M in annual revenue across mechanical, thermal/acoustic, and firestopping scopes.
1. Bid-Hit Rate by Channel. Splits cleanly into three buckets. Open commercial GC bids: 22-32% hit rate is healthy, anything under 18% means you're a price-coverage bidder, anything over 38% means you're leaving margin on the table. Negotiated mechanical-contractor work: 35-45% hit rate is the target, this is where relationships and prior performance pay. Facility-manager direct retrofit: 28-40% hit rate, longer sales cycle but higher margin. Track in Salesforce or B2W with a custom field for channel; if you can't split bid-hit by channel, you are flying blind on where to deploy estimator hours.
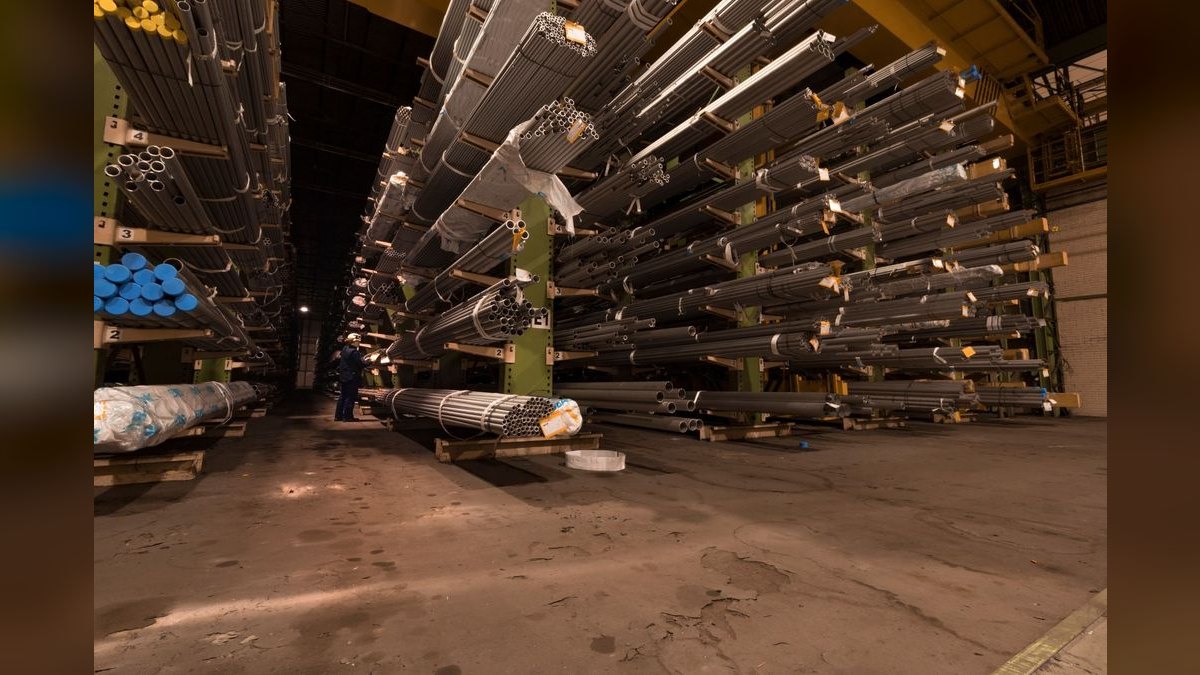
2. Revenue Per Crew-Day. The single best productivity number. Mechanical insulation crews (typically 2-4 installers plus a foreman) should generate $4,800-$8,200 in installed revenue per crew-day on commercial new construction, $5,400-$9,500 on industrial process piping. Thermal/acoustic crews installing batt, board, and spray foam should generate $2,400-$3,800 per crew-day on commercial work. Firestopping crews, smaller (1-2 techs), run $1,800-$2,800 per crew-day. Below the floor, you have a labor-burn or material-flow problem; above the ceiling, you are likely under-billing or running unsustainable crew loading. Track in Procore or Foundation/Sage 100 Contractor with daily field reports.
3. Backlog Coverage (Months Forward). Signed-and-released backlog divided by trailing-3-month average revenue. Commercial insulation contractors should sit at 4.5-7.5 months. Under 4 months means the sales engine is starving and you'll have crew downtime in 90 days. Over 9 months sounds good but usually means you're locked into old pricing on a 2-year schedule and getting squeezed by current material costs. Energy-code-driven retrofit backlog often skews this number; track it separately from new-construction backlog.
4. Gross Margin by Scope. Reported monthly per job, rolled up by scope category. Targets: mechanical insulation 24-28%, thermal/acoustic 18-22%, firestopping 32-38%, industrial/process 26-32%. If your blended GM looks fine at 23% but mechanical is dragging at 19%, you have a productivity, material-waste, or estimating-accuracy problem on the highest-volume scope. Most ERP systems (Sage 300 CRE, Vista, Foundation, COINS) support scope-level cost coding but operators have to enforce the coding discipline at the field level.
5. Change-Order Capture Rate. Change orders as a percentage of base contract value at project close. Commercial new construction: 8-14% is healthy. Industrial: 12-20%. Tenant improvement/retrofit: 6-11%. Under the floor, you are absorbing scope changes that should have been billed, usually because submittal/RFI documentation in Procore is sloppy. Over the ceiling on multiple jobs and you'll burn the GC relationship. The KPI to watch underneath is change-order cycle time: from RFI to executed CO should be under 21 days on commercial work.

6. Labor Productivity ($/SF or $/LF Installed vs Estimate). Field-level productivity tracking against the estimate. For mechanical insulation, track $/LF installed by pipe size and insulation type against B2W or self-built estimating standards. For thermal/acoustic, track $/SF by assembly type. The benchmark: 92-105% of estimated productivity on jobs over 90 days old. Under 88% is a problem (crew, supervision, or estimate accuracy); over 110% means your estimator is sandbagging and you're losing bids you should win. Foreman daily reports in Procore or Raken feed this number.
7. Customer Concentration. Top 5 GCs/MCs as a percentage of trailing-12-month revenue. Healthy range: under 55%. Over 65% and a single GC's bad year tanks your P&L. Commercial insulation contractors who built around one mega-mechanical (Comfort Systems USA, EMCOR, APi Group affiliates) tend to drift to 70-80% concentration; that's not wrong if the relationship is durable, but it has to be a deliberate strategy backed by a customer-diversification pipeline in Salesforce.
8. Days Sales Outstanding (DSO), Net of Retention. Commercial subcontract work carries 5-10% retention held until substantial completion, often 60-120 days past project close. Operating DSO (AR excluding retention) should run 52-72 days. Over 80 days and your working capital is funding the GC's pay-when-paid clause. The fix is not chasing harder, it is contract-front-end discipline (no pay-if-paid clauses, pay-app cycle locked to AIA G702 standard, lien rights preserved) and lien-waiver tracking through Textura or GCPay.

9. Energy-Code Retrofit Attach Rate. New for the 2026-2028 cycle. Of your facility-manager and industrial-plant accounts, what percentage have purchased an envelope, mechanical-insulation, or firestopping retrofit scope in the trailing 12 months? Target: 15-25% attach. Federal BPS deadlines and IECC 2024 retro-commissioning requirements are creating one-time conversion windows; operators who have a named retrofit BD rep and a retrofit-scoped pipeline in Salesforce are pulling 28-35% attach rates and capturing the demand wave.
Real Operators
Five-plus named companies actually running this playbook, with what each one teaches.
Performance Contracting Group (PCG), headquartered in Lenexa, Kansas, is the largest specialty insulation contractor in North America with revenue north of $1B and operations in 40+ states. PCG runs mechanical insulation, thermal, acoustic, firestopping, and specialty scaffolding under one roof. The operator lesson: scope diversification inside one branch P&L lets you cross-sell into the same GC relationship and lift revenue-per-account 2-3x versus a single-scope contractor.
Specialty Products and Insulation (SPI), based in Lancaster, Pennsylvania, is a distribution-plus-fabrication hybrid that also runs contracting operations in select markets. SPI's playbook: control the fab shop and the supplier rep relationships (Owens Corning, Knauf, Johns Manville, Armacell), then bid contracting work at a material-cost advantage. Operators in regional markets can replicate the principle with a stocking-distributor relationship that gives them 60-day price locks on commercial bids.

ISEC Inc., headquartered in Englewood, Colorado, runs specialty interior contracting including insulation, firestopping, and architectural panels across multiple western states. ISEC's lesson: building a firestopping practice with UL listings, FCIA membership, and inspector relationships creates a 32-38% gross-margin business inside an otherwise commodity insulation P&L. Several of the operators on this list run firestopping as their highest-margin scope.
Anning-Johnson Company, a Chicago-based specialty subcontractor with multi-region operations, bundles drywall, ceilings, insulation, and firestopping into a one-stop interiors package for commercial GCs. The operator lesson: when you can self-perform 3-4 adjacent scopes, your bid-hit rate on negotiated work climbs to the 40-50% range because the GC saves coordination overhead.
Distribution International (DI), headquartered in Houston, is primarily a mechanical insulation distributor but operates contracting and fabrication businesses in industrial markets. DI's playbook teaches that industrial process-piping insulation (refineries, chemical plants, LNG, power) carries 26-32% gross margins and 5-7 month backlog visibility because of turnaround scheduling, versus commercial new-construction's tighter margins and shorter visibility.

US Insulation Inc. and a broad bench of regional operators (Brand Industrial Services, IRG, ThermalPro, Mesa Insulation, Bay Insulation Systems on the building side) round out the named-operator set. The smaller regionals teach the most about KPI discipline: a $14M regional insulator running tight on revenue-per-crew-day, scope-segmented gross margin, and change-order capture will out-earn a $40M competitor that doesn't track these numbers weekly.
Failure Modes
Four patterns that kill commercial insulation contractors, in order of frequency observed in operator post-mortems.
1. Blended-Margin Blindness. Operator reports 22% blended gross margin to the bank and to themselves. Looks fine. Underneath: firestopping is doing 36% on $2M of revenue, mechanical is at 21% on $14M, and thermal/acoustic is at 14% on $8M and burning through working capital. Without scope-level cost coding enforced at job-cost entry (Sage 300 CRE, Vista, Foundation, COINS), leadership doesn't see that thermal/acoustic is the cancer. Fix: monthly scope-level GM report, executed at the branch GM level, with a named owner per scope category.
2. Estimator Capacity Strangling Growth. Operator wants to grow 25% but has 2 estimators bidding 180 jobs each per year. To grow revenue 25% on a 28% hit rate, you need ~22% more bids. Estimators max out, takeoff quality drops, hit rate falls from 28% to 21%, and the operator is now bidding more for less revenue. Fix: model estimator capacity per year (target 220-300 bids per estimator with Bluebeam Revu and B2W or Accubid speed), hire ahead of the curve, and track estimator productivity as a sales KPI.

3. Retention and Pay-When-Paid Working-Capital Trap. Operator wins a $4M mechanical insulation scope on a $180M hospital, 10% retention, pay-when-paid clause, 90-day final payment cycle. Three of these jobs running concurrently and the operator is funding $1.2M of retention plus 65-day DSO on $12M of WIP. Bank line tops out, growth stops, owner has to inject cash or sell. Fix: contract-front-end discipline (no pay-if-paid, retention reduction at 50% completion, lien rights preserved), AR aging review weekly, and retention tracking in Textura or GCPay.
4. Energy-Code Demand Wave Missed. IECC 2024 adoption, ASHRAE 90.1-2022, and federal BPS deadlines create demand spikes 12-24 months ahead of bid lists. Operators who don't have a named BD rep tracking jurisdiction-level code-adoption calendars and BPS compliance deadlines see competitors win the early retrofit work and lock in 3-year facility-manager MSAs at premium margins. Fix: jurisdiction-level demand calendar maintained quarterly, retrofit-scoped pipeline segment in Salesforce, named retrofit BD rep with comp tied to attach rate.
Reporting Cadence
Daily. Field foremen submit daily reports in Procore or Raken: crew hours, units installed (LF, SF, or equipment), material consumed, weather/site delays, RFI requests. Estimating logs every bid submitted and every win/loss with reason code. PM logs change-order status. Takes the foreman 8-12 minutes; takes the estimator 3-5 minutes per bid logged.

- Crew hours and units installed by job
- Bids submitted and wins/losses logged
- RFI and submittal status by active job
- Material releases and delivery confirmations
- Safety and incident reporting
Weekly. Monday sales standup (45 min): bid calendar for the week, last week's hit rate, lost-bid debrief on the top 3 misses, pipeline coverage. Wednesday ops review (60 min): WIP report, productivity variance by job, change-order aging, AR over 60 days.
- Bid-hit rate trailing 4 weeks by channel
- Revenue per crew-day trailing 7 days
- AR aging and pay-app status
- Change-order aging by job
- Backlog coverage in months forward
Monthly. Branch P&L close by the 12th of the following month: revenue by scope, gross margin by scope, labor productivity variance, WIP-to-billing reconciliation, customer concentration update.

- Scope-level gross margin (mechanical, thermal/acoustic, firestopping, industrial)
- Labor productivity vs estimate by job
- Customer concentration top 5
- DSO net of retention
- Estimator productivity (bids submitted, hit rate)
Quarterly. Strategy review at the branch and corporate level: backlog quality and coverage, customer-diversification progress, retrofit attach rate, jurisdiction-level energy-code and BPS calendar update, capex and hiring plan.
- 12-month backlog quality review
- Customer-diversification scorecard
- Energy-code retrofit attach rate
- Jurisdiction BPS deadline calendar
- Estimator and PM hiring forecast

30/60/90 Day Plan
For an operator stepping into a commercial insulation contracting business that does not yet run on these nine KPIs, a 90-day install plan.
Days 1-30: Instrument the Numbers. Stand up scope-level cost coding in the ERP (Sage 300 CRE, Vista, Foundation, or COINS). Force every job to be coded mechanical, thermal/acoustic, firestopping, or industrial at job-setup. Roll out Procore or Raken daily field reports if not already in place. Pull last 12 months of bid history into a Salesforce or B2W dashboard split by channel (GC open bid, MC negotiated, FM direct). Baseline the nine KPIs. Don't change anything operational yet; just measure.
Days 31-60: Fix the Two Worst Numbers. Pick the two KPIs furthest from benchmark and run a focused fix. If revenue-per-crew-day is low, audit crew loading and material-flow on the three biggest active jobs. If scope-level GM shows thermal/acoustic underwater, do a bid-discipline reset (raise the no-bid floor, walk away from the bottom-quartile GCs). If DSO is over 80, run a contract-front-end audit on the next 10 bids and tighten pay-app and retention language. Hold a weekly review on just these two KPIs with named owners.
Days 61-90: Build the Sales Engine. Install the bid-channel split in Salesforce, set hit-rate targets by channel, hire or reassign an estimator if capacity is the constraint. Stand up a retrofit-BD function with a named rep and a jurisdiction-level BPS calendar. Hold the first quarterly strategy review using the new dashboard. By day 90, leadership should be running the business off the nine KPIs in the weekly and monthly cadence above, with a named owner per number.
FAQ
Q1: How do commercial insulation KPIs differ from residential insulation KPIs? A: Residential lives on lead-to-job conversion, average ticket, and crew-day count because the buyer is the homeowner and the cycle is 7-21 days. Commercial lives on bid-hit rate by channel, scope-level gross margin, backlog coverage in months, and DSO net of retention because the buyer is a GC or MC and the cycle is 60-180 days from bid to billing. Trying to run a commercial insulation contractor off residential dashboards (Service Titan, JobNimbus) misses the working-capital and scope-mix dynamics that drive the P&L.
Q2: What's the right bid-hit rate target if we bid mostly open commercial GC work? A: 22-32% is healthy. Under 18% and you're a price-coverage bidder, padding GC bid lists without a real shot; reset your go/no-go filter and walk away from work where you have no relationship and no spec advantage. Over 38% and you're underpricing; raise your floor and watch margin climb without revenue dropping materially.
Q3: How do we handle pay-when-paid clauses without losing the bid? A: You usually can't strike pay-when-paid entirely on large commercial GC contracts, but you can negotiate three things that materially reduce working-capital burn: retention reduction at 50% completion, a hard payment cap (e.g., 75 days from pay-app submission regardless of owner payment), and clear lien-rights preservation. Most national GCs (Turner, Skanska, Mortenson, Suffolk, DPR, JE Dunn, Whiting-Turner) will negotiate these terms with a contractor who shows up with specific redlines rather than blanket objections.
Q4: Which energy codes and BPS ordinances matter most for 2027 demand planning? A: IECC 2024 (now referenced or adopted in 41+ states for commercial construction) tightens envelope U-values and adds continuous-insulation requirements. ASHRAE 90.1-2022 raises mechanical insulation thickness minimums. Federal BPS ordinances in New York City (Local Law 97), Washington DC, Boston, Denver, St. Louis, Chula Vista, Reno, Maryland, Colorado, and Washington State drive existing-building retrofit deadlines through 2030. Build a jurisdiction-level calendar tracking adoption dates and compliance deadlines, then map your facility-manager account list against it.
Q5: How big does a commercial insulation contractor need to be before scope-level gross margin reporting is worth the effort? A: $4-5M in revenue. Below that, the operator usually has visibility into every job and can keep scope-level GM in their head. Above $5M, blended-margin reporting hides too much, and the cost of installing scope-level cost coding in the ERP (1-2 weeks of controller time plus PM training) pays back inside 90 days through better bid discipline and crew-loading decisions.
Q6: What's the right way to comp a retrofit BD rep on energy-code-driven work? A: Base salary in the $85-115K range for a rep with 5-8 years of commercial insulation or building-envelope experience, plus a variable component tied to two metrics: retrofit attach rate (15-25% target across the assigned facility-manager and industrial-plant book) and gross-margin dollars on closed retrofit scopes. Avoid commission on top-line revenue alone; it incents the rep to chase low-margin commodity scopes instead of the higher-margin firestopping, mechanical retrofit, and envelope-upgrade work that the BPS demand wave is actually creating.
Related on PULSE
- [What are the key sales KPIs for the Residential & Light-Commercial Spray Foam Insulation Contracting industry in 2027?](/knowledge/ik0225)
- [What are the key sales KPIs for the Industrial Insulation Contracting industry in 2027?](/knowledge/ik0141)
- [What are the key sales KPIs for the Commercial Mechanical Insulation industry in 2027?](/knowledge/ik0051)
- [What are the key sales KPIs for the Commercial HVAC Service Contracting industry in 2027?](/knowledge/ik0081)
- [What are the key sales KPIs for the Commercial Plumbing Contracting industry in 2027?](/knowledge/ik0071)
- [What are the key sales KPIs for the Commercial Roofing Contracting industry in 2027?](/knowledge/ik0064)
Sources
- International Code Council, IECC 2024 Commercial Provisions and state-by-state adoption tracker
- ASHRAE Standard 90.1-2022, Energy Standard for Buildings Except Low-Rise Residential
- US Department of Energy, Building Performance Standards Coalition jurisdictional database
- National Insulation Association (NIA), Mechanical Insulation Market Reports 2024-2026
- Insulation Outlook magazine, contractor benchmarking and operator case studies
- Construction Financial Management Association (CFMA), Annual Construction Industry Financial Survey
- Engineering News-Record (ENR), Top 600 Specialty Contractors rankings and revenue data
- Firestop Contractors International Association (FCIA), UL-listed contractor program data
- Dodge Construction Network, commercial construction starts and bid-volume data
- AGC of America, commercial subcontractor working-capital and DSO surveys
- Procore Technologies, commercial subcontractor productivity benchmarking reports
- Bluebeam Inc., commercial estimating productivity benchmarks
- Manufacturer technical data from Owens Corning, CertainTeed, Knauf Insulation, Johns Manville, Armacell, Roxul/Rockwool
- Textura and GCPay aggregated commercial subcontractor pay-app and retention cycle data
 pulse-toolsHow Many Staff Should I Schedule Each Shift at My Sushi Restaurant?
 pulse-toolsHow Many Sales Reps Do I Need to Hire for My Window Replacement Company?
 pulse-toolsHow Many Employees Should I Schedule Each Shift at My Bowling Alley?
 pulse-toolsHow Many Sales Reps Do I Need to Hire for My Healthcare SaaS Company?
 pulse-toolsHow Many Sales Reps Do I Need to Hire for My Marketing Agency?
 tlHow Many Baristas Should I Schedule Each Shift at My Coffee Shop?
 pulse-toolsHow Many Employees Should I Schedule Each Day at My Wine Shop?
 tlHow Many Sales Reps Do I Need to Hire for My Merchant Services Company?
 pulse-toolsHow Many Employees Should I Schedule Each Shift at My Movie Theater?
 pulse-toolsHow Many Sales Reps Do I Need to Hire for My Solar Company to Hit Its Install Goal?