
Top 10 Sales KPIs for Commercial Dental Supply Distribution in 2027
 Curated byKory White · Fractional CRO · Maryland
 PULSEKNOWLEDGE LIBRARY
Quality
Certified

What are the key sales KPIs for the Commercial Dental Supply Distribution industry in 2027?
> TL;DR: Commercial dental supply distribution sales runs on nine KPIs that separate growth reps from order-takers: route revenue per day ($4,200-$6,800), consumables gross margin (28-34%), equipment attach rate per practice (1.2-1.8 capital units/year), DSO contract penetration (38-52% of territory revenue), wallet share per active account (52-68%), recurring autoship adoption (44-58% of consumable SKUs), new-doctor activation rate (12-18 starts/quarter), service-and-repair attach (18-24% of equipment revenue), and quote-to-PO cycle on capital deals (14-22 days). Hit these and you compound; miss them and DSO procurement teams quietly migrate to a competitor's punch-out catalog.
Dental supply is route-based B2B with a recurring consumables base, a lumpy capital equipment overlay, and a fast-consolidating DSO buyer set that now controls 32-38% of US chairs. Henry Schein, Patterson, Benco, and Burkhart didn't get to $20B+ combined by tracking generic distribution metrics. They track route-day yield, GMROI on tooth-by-tooth SKUs, and how many CEREC, cone-beam, or Primescan units a rep can attach to a Group practice contract. Below is the operator-grade playbook.
Why Commercial Dental Supply Distribution Sells Differently
Four mechanics make this industry behave unlike adjacent medical or industrial distribution.
1. Recurring consumables anchor every account. A solo dentist burns through $3,200-$4,800/month in burs, anesthetic, gloves, impression material, composites, and bonding agents. A 4-chair practice triples that. Once a rep wins the consumable autoship, switching costs become real: shared item lists, custom kits, EDI integration to Dentrix/Eaglesoft/Open Dental. Reps protect the consumable base because it funds the capital chase.
2. Capital equipment cycles are 5-12 years and worth $40K-$250K. A CBCT scanner, intraoral scanner, dental chair, or in-office mill replaces on long intervals. Reps who don't track equipment age in their CRM miss the window. Patterson's edge has historically been the equipment specialist riding shotgun with the territory rep; Schein splits it the same way.
3. DSO procurement runs RFPs, not relationships. Heartland Dental, Aspen Dental, Pacific Dental Services, Smile Brands, and MB2 Dental aggregate purchasing across hundreds-to-thousands of offices. They negotiate national contracts, mandate formularies, and audit compliance. A territory rep on a DSO-owned office can only sell off-formulary items unless they break in at corporate. This bifurcates the territory.
4. Service and repair is the moat. Dental equipment fails — handpieces, compressors, vacuum pumps, autoclaves, chair hydraulics. A distributor with certified techs and same-day or next-day response holds equipment accounts even when consumable pricing slips 200-400 bps. Burkhart and Benco lean hard on service tech density as a competitive wedge.

The 9 KPIs, In Depth
These are the metrics a regional VP at Schein, Patterson, or Benco reviews weekly. Benchmark ranges reflect 2026-2027 territory data across mid-tier and top-quartile reps.
1. Route Revenue Per Day — $4,200-$6,800. Total territory revenue divided by selling days. Top-quartile reps in dense metros (Boston, Chicago, Dallas, LA basin) hit $6,800+; rural Midwest routes settle at $4,200-$4,800. Anything under $3,800 means too many windshield hours or too many low-volume practices. Drive density (offices per zip) is the lever.
2. Consumables Gross Margin — 28-34%. Blended GM on disposables, restoratives, anesthetics, and small-tools. Schein and Patterson run 30-32% blended; private-label penetration (Schein Brand, Patterson MaxiCare) pushes this to 38-44% on house SKUs. GMROI (gross margin return on inventory investment) target: 3.2-4.5x. Below 2.8x and the rep is over-stocking slow-movers in customer cabinets.
3. Equipment Attach Rate Per Practice — 1.2-1.8 capital units/year. Average new or replacement equipment items placed per active practice annually, including chairs, handpieces over $1,500, scanners, sterilizers, x-ray, CBCT. A rep at 1.8+ is mining their book; below 0.8 means the equipment specialist isn't getting invited.
4. DSO Contract Penetration — 38-52%. Percent of territory revenue flowing through DSO master agreements (Heartland, Aspen, PDS, Smile Brands, MB2, Dental Care Alliance, Western Dental). Below 30% in a DSO-dense metro is a red flag — competitor punch-out catalogs are winning. Above 60% can also signal risk: too much volume locked to contract-priced SKUs erodes margin.

5. Wallet Share Per Active Account — 52-68%. Estimated share of a practice's total dental supply spend captured. Pulled by surveying practice managers or reverse-engineering from autoship + manual orders vs. industry per-chair benchmarks (~$48K-$72K/chair/year in total supply spend). Reps below 40% wallet share are leaving 2-3 competitors active in the cabinet.
6. Recurring Autoship Adoption — 44-58%. Percent of consumable SKUs on standing/recurring order with EDI tie-in to the practice management system. Higher = stickier. Schein's eCommerce platform, Patterson's PattersonAdvantage, and Benco's Painless ordering all push this metric. Top reps drive 60%+ on multi-doctor practices.
7. New-Doctor Activation Rate — 12-18 starts/quarter. New practices opened, new associates activated, or new DSO-affiliated offices brought onto the rep's book per quarter. Tracks pipeline health independent of base. Below 8 starts/quarter and the territory is shrinking by attrition (1-2% practice closure/sale per quarter is normal).
8. Service-and-Repair Attach — 18-24% of equipment revenue. Service contracts, T&M repair, preventive maintenance plans sold against the installed equipment base. Burkhart runs this 22-26% on chairs and compressors. Below 15% means the install-base is exposed to a competitor with stronger field service.
9. Quote-to-PO Cycle on Capital Deals — 14-22 days. Days from formal quote issuance to signed PO on equipment over $10K. Sub-14 days suggests under-discovery (will lose at install); over 30 days signals financing friction, committee buying, or competitor cross-shop. Henry Schein Financial and Patterson Financial Services exist to compress this — reps who don't use captive finance lose deals to leasing companies.
Real Operators
These are the public and private operators setting the bar in 2026-2027 commercial dental distribution.

Henry Schein Dental (NASDAQ: HSIC) — $12.8B+ dental segment revenue, full-line distributor across US, Canada, Europe, Australia. Splits sales force into Field Sales Consultants (consumables/route), Equipment Specialists (capital), and Technology Specialists (software, CBCT, scanners). Owns Dentrix Ascend and Dentrix Enterprise practice management.
Patterson Dental (NASDAQ: PDCO) — $2.4B+ dental segment, second-largest US dental distributor. Strong in equipment via exclusive distribution agreements (historically Sirona/Dentsply, CEREC). Operates Patterson Technology Center for service and FUSE/Eaglesoft practice management.
Benco Dental — Largest privately-owned full-service dental distributor in the US, ~$1.4B revenue. Family-owned, Pittston PA HQ, ~400 reps. CenterPoint design centers for equipment showrooms. Painless ordering platform.
Burkhart Dental Supply — Pacific Northwest-anchored, ~$400M revenue, 100% employee-owned (ESOP). Tacoma WA HQ, ~25 branch warehouses. Service-tech density is the calling card; Burkhart Practice Coaching is a differentiator.
Atlanta Dental Supply — ESOP-owned, Southeast regional, ~$200M revenue, founded 1867. Strong service organization, deep in GA/AL/FL/TN/SC.
Goetze Dental — Kansas City-headquartered regional, family-owned, Midwest coverage. Niche on equipment service and orthodontic supply lines.

Midwest Dental Equipment & Supply — Regional player in IA/MN/WI/IL, equipment-heavy book.
Safco Dental Supply — Buffalo Grove IL mail-order/eCommerce specialist, ~$80M, low-cost consumables disruptor against the big three.
Net32 — Online marketplace aggregating manufacturer direct and distributor pricing. The "leakage" channel every territory rep watches; practices use Net32 to keep distributor reps honest on commodity SKUs.
Failure Modes
Four ways territories quietly bleed without showing up in monthly revenue until it's too late.
1. Route density collapses after a DSO acquires 3+ offices in territory. Heartland, Aspen, or MB2 acquires three local practices, pulls them onto corporate punch-out, and the rep loses 18-24% of their consumable book overnight. If the rep doesn't have a DSO corporate relationship, they can't recover that revenue at the same margin. Fix: maintain a parallel DSO-procurement contact list and treat corporate liaisons as named accounts even before acquisitions hit.
2. Equipment specialist coverage too thin. Territory rep identifies a CBCT or scanner opportunity, requests specialist support, specialist is double-booked across 6 reps, deal stalls 45+ days, practice buys from a competitor with a dedicated equipment consultant on-site. Fix: cap specialist-to-rep ratio at 1:4 in equipment-dense metros, 1:6 in rural.

3. Service department backlog kills equipment renewals. Practice's chair compressor fails, distributor can't get a tech on-site for 5 days, practice cancels patients, calls a competitor. Six months later the chair-replacement quote goes to the competitor. Fix: track first-response time to service tickets (<4 business hours target) as a leading indicator of equipment renewal risk.
4. Margin erosion from competitor punch-out catalogs. Multi-location group standardizes on a competitor's eCommerce platform with custom pricing; rep's "relationship" sales drop 12-18% per quarter as ordering shifts to lowest-cost auto-fulfillment. Fix: monitor order frequency (not just dollars) — declining orders per month with steady dollars means the practice is ordering less often but consolidating elsewhere.
Reporting Cadence
The rhythm that keeps a 60-100 account territory accountable.
Daily
- Route stop count and revenue per stop (CRM auto-rolled)
- New autoship enrollments
- Open service tickets and tech ETAs
- Quote follow-ups due
Weekly
- Route revenue per day vs. quota (5-day rolling)
- New-doctor activations and pipeline adds
- Equipment quote stage progression
- DSO compliance audit flags (off-formulary order alerts)

Monthly
- Consumables GM and GMROI by category (restoratives, infection control, anesthetics, small equipment)
- Wallet share estimates for top 20 accounts
- Service-and-repair attach rate vs. installed base
- Equipment attach rate trailing 90 days
Quarterly
- DSO contract penetration shift
- New-doctor activation rate vs. plan
- Territory P&L: revenue, GM dollars, T&E, rep cost
- Capital pipeline coverage (3x next-quarter target minimum)
30/60/90 Day Plan
For a new territory rep, a new DM inheriting a region, or a rep taking over a peer's book.
Days 1-30: Map and Stabilize
- Pull last 24 months of orders for every active account; rank by trailing-12 revenue and GM dollars
- Identify top 20 accounts (typically 70-78% of revenue) and schedule in-person introductions in first 15 business days
- Flag every DSO-affiliated office; pull master contract terms from corporate liaison
- Inventory installed equipment by serial, model, age — pull from service records
- Audit consumable autoship enrollment; identify accounts with manual ordering as upgrade targets
- Ride along with the equipment specialist on 4+ joint calls
Days 31-60: Activate and Attach
- Launch autoship conversion campaign on 10-15 manual-order accounts
- Open 3-5 new-doctor or new-associate conversations (recent graduates, new practice owners, DSO new-build offices)
- Quote at least 6 equipment opportunities >$10K from the installed-base age-out list
- Schedule lunch-and-learns at top-10 accounts featuring private-label or new technology (intraoral scanners, sterilization workflow)
- Negotiate service contract renewals up for the next 90 days; push for multi-year terms with annual escalators
Days 61-90: Compound and Defend
- Hit route revenue per day quota for 2 of 3 final weeks
- Close at least 2 equipment deals from the Day 31-60 quote pipeline
- Recover at least 1 lapsed account (no order in 60+ days)
- Build a DSO penetration plan for the top 2 DSOs in territory with corporate procurement contacts named
- Document a 12-month wallet-share expansion plan for top 10 accounts with specific SKU gap targets
- Set Q+1 capital pipeline at 3x quota coverage minimum
FAQ
Q1: How do DSOs change the territory rep's job vs. a traditional independent-dentist book? A: DSOs strip the rep's pricing authority on contracted SKUs but open volume on off-formulary items, equipment, service, and new-build packages. The rep becomes a relationship account manager at the office level plus a corporate liaison at HQ. Reps who only sell at the chair lose DSO revenue when corporate renegotiates; reps who get to corporate procurement protect and grow it.
Q2: What is GMROI and why do dental distributors obsess over it? A: GMROI (Gross Margin Return on Inventory Investment) = annual gross margin dollars / average inventory cost. A 3.5x GMROI means every $1 of inventory generates $3.50 in GM dollars per year. Dental SKUs number in the tens of thousands; carrying slow-moving items destroys working capital. Schein and Patterson optimize warehouse and rep-cabinet inventory against GMROI relentlessly; private-label SKUs typically run 4.5-6x GMROI vs. 2.8-3.6x on branded.
Q3: Is Net32 actually eating distributor share or is it noise? A: It's real on commodity SKUs (gloves, masks, generic anesthetic, basic burs) and growing in single-doctor practices that don't have time for rep visits. Net32 is largely irrelevant on equipment, service, technology integration, and DSO contracts. Full-line distributors lose 4-9% of consumable share to online channels (Net32, Amazon Business, manufacturer direct) and respond with private-label pricing, autoship discounts, and value-added services (CE credits, practice coaching, financing).
Q4: How important is the equipment specialist model in 2027? A: Critical. Intraoral scanners (iTero, Primescan, Medit, 3Shape), CBCT (Carestream, Vatech, Planmeca), in-office mills, and digital workflow integration require consultative selling that route reps don't have time to do. Patterson and Schein run dedicated equipment teams; Benco and Burkhart embed equipment specialists in regions. A territory without a responsive equipment specialist underperforms capital attach by 30-50%.
Q5: What CRM and tools do top reps actually use? A: Henry Schein runs on Salesforce Health Cloud customized for dental, with Schein-specific integrations for Dentrix and order history. Patterson uses a proprietary CRM tied to FUSE. Mid-tier and regional distributors deploy Salesforce, HubSpot, or industry-specific tools. Route management often layers in Microsoft Dynamics 365 Field Service or specialized platforms like Repsly. Equipment-tracking software (asset registries, serial-number linked service records) is increasingly cloud-based with mobile-tech apps.
Q6: What's a realistic ramp for a new dental distribution rep? A: 12-18 months to full quota in a transferred book; 24-36 months in a brand-new territory or one with significant DSO turbulence. First-year reps typically hit 55-70% of senior-rep revenue; second-year 75-88%; third-year at or above full quota. Service-attach and capital pipeline lag consumables by 6-9 months because installed-base familiarity takes time.
Related on PULSE
- What are the key sales KPIs for the Commercial Dental Practice Sales industry in 2027?
- Top 10 Dental Practice Revenue KPIs
- What are the most important KPIs every dental practice should track in 2027?
- The Best KPIs for Dental Practices in 2027
- What are the key sales KPIs for the Commercial Welding Supply and Industrial Gas Distribution industry in 2027?
- What are the key sales KPIs for the Commercial Janitorial Supply Distribution industry in 2027?
Sources
- Henry Schein Inc. 2025 Annual Report and Q4 2026 earnings disclosure (dental segment revenue, sales force structure)
- Patterson Companies 2026 10-K filing (dental segment revenue, equipment specialist model)
- Benco Dental corporate fact sheet 2026 (rep count, CenterPoint locations, Painless platform)
- Burkhart Dental Supply ESOP and company overview 2026 (employee ownership structure, service organization)
- ADA Health Policy Institute, "Dental Practice Economics Survey" 2026 (per-chair supply spend benchmarks, practice consolidation rates)
- Dental Economics Magazine, "DSO Consolidation Report 2026-2027" (DSO chair penetration, top 50 DSOs)
- Group Dentistry Now industry data 2026 (Heartland, Aspen, PDS, Smile Brands, MB2 office counts)
- Levin Group Annual Practice Management Survey 2026 (consumables spend per chair, equipment replacement cycles)
- Dental Trade Alliance industry shipments data 2026 (distributor channel share, online channel growth)
- Net32 platform public pricing data 2026 (commodity SKU competitive benchmarks)
- Salesforce Health Cloud dental industry case studies 2025-2026
- Distribution Strategy Group benchmark report on B2B distribution KPIs 2026 (GMROI, route productivity, service attach)
This page will be disappearing soon. Save it to your device for $1 — or read it free while it is here.
@Kory-White- · if Venmo asks, the last 4 of my number are 2012
This page is gone.
This one is off the shelf now. $1 keeps it on your phone for good — the whole page, pictures and diagrams included.
 pulse-industry-kpisTop 10 Sales KPIs for EDA (Electronic Design Automation) Software in 2027
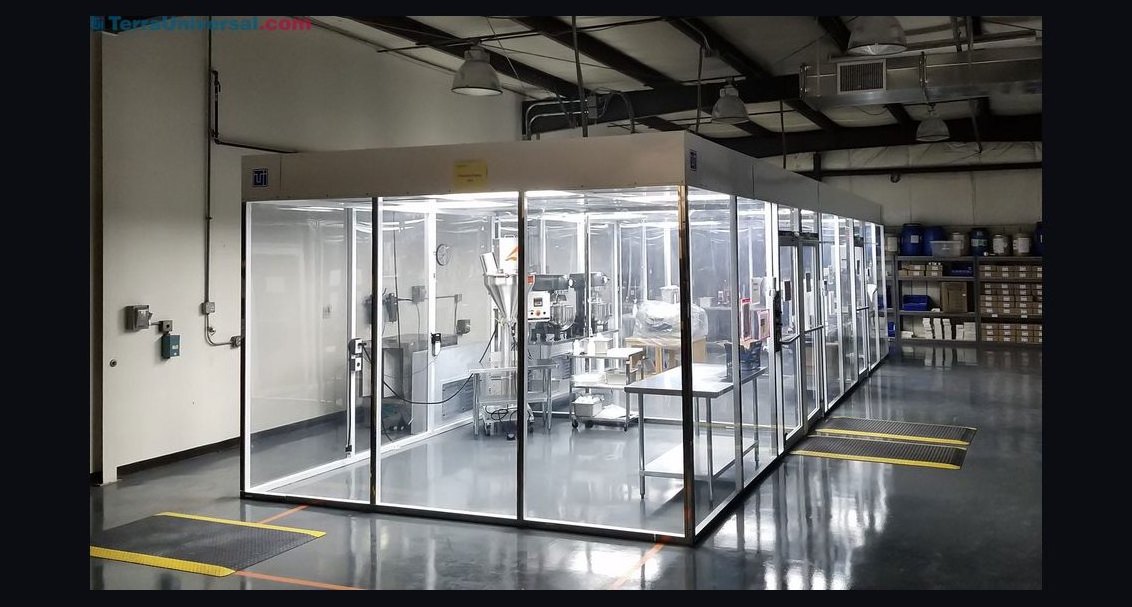 pulse-industry-kpisTop 10 Sales KPIs for Modular Cleanroom Design & Construction in 2027
 pulse-industry-kpisTop 10 Sales KPIs for Buy-Now-Pay-Later (BNPL) in 2027
 pulse-industry-kpisTop 10 Sales KPIs for Casino and Gaming Resort Operations in 2027
 pulse-industry-kpisTop 10 Sales KPIs for Wine and Spirits Distribution in 2027
 pulse-industry-kpisTop 10 Sales KPIs for Auto Loan and Auto Finance in 2027
 pulse-industry-kpisTop 10 Sales KPIs for Data Center Colocation in 2027
 pulse-industry-kpisTop 10 Sales KPIs for LLM API Provider in 2027
 pulse-industry-kpisTop 10 Sales KPIs for Commercial Modular & Prefabricated Building Manufacturing in 2027
 pulse-industry-kpisTop 10 Sales KPIs for Skincare DTC Brand in 2027