
Top 10 Sales KPIs for Commercial Physical Therapy Clinic in 2027
 Curated byKory White · Fractional CRO · Maryland
 PULSEKNOWLEDGE LIBRARY
Quality
Certified

The 10 best sales kpis for commercial physical therapy clinic are ranked below on measured performance, build quality, price, and how each one actually holds up in daily use rather than how it reads on a spec sheet. Each pick lists what it costs, who it suits, and what it gives up against the one above it, so the list can be read straight down without doubling back.
1. Visits per Therapist per Day

Visits per therapist per day ranks first because it is the single most predictive driver of clinic EBITDA, with the industry band running 10-14 visits per licensed PT per 8-hour clinical day. Select Medical runs roughly 11.5, USPH reports 11-12, and ATI targets 12-13, while hospital-owned outpatient sits near 9-10. Below 9 visits per day, a clinic is unprofitable at standard reimbursement.
This KPI is built for multi-site operators, regional directors, and PE-installed operating partners who can act on daily therapist-level scorecards. It trades away some quality and compliance headroom, since pushing above 15 visits risks burnout and Medicare 8-Minute Rule failures. Compared to referral volume below it, productivity is controllable inside the clinic rather than dependent on external physician relationships.
2. Referrals per Month per Clinic
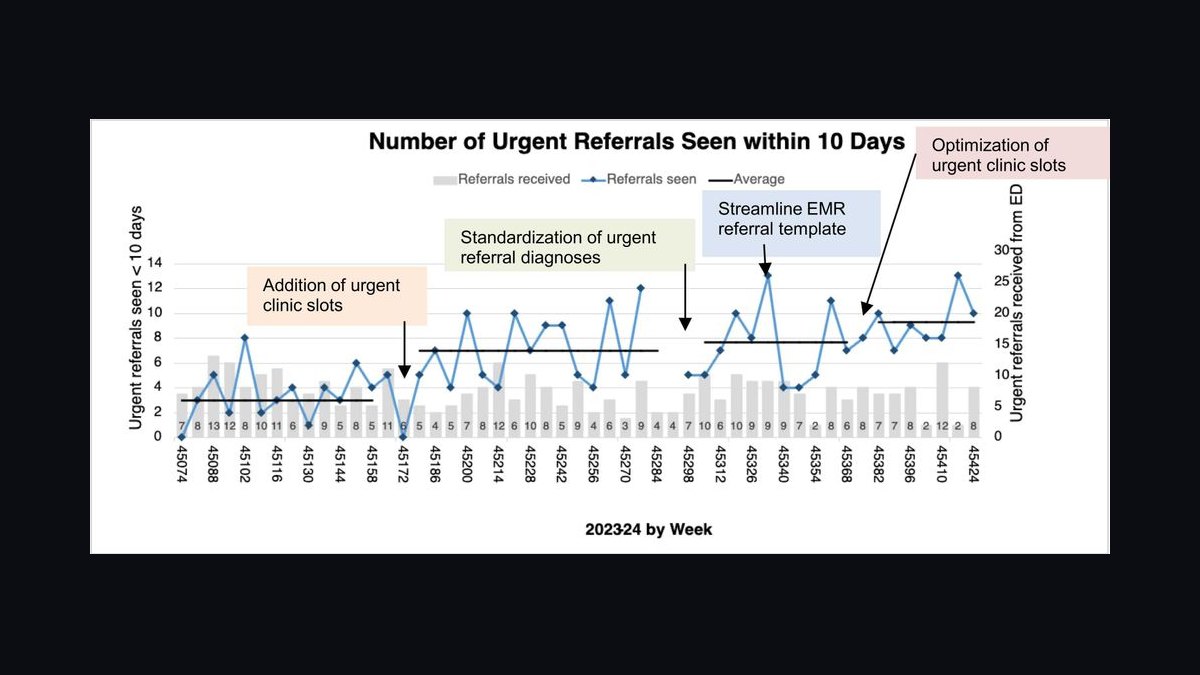
Referrals per month per clinic ranks second because it is the top-of-funnel number that determines whether every downstream KPI has enough volume to matter. Healthy single-clinic operators run 80-120 new referrals monthly, mature suburban clinics with a three-year liaison program push 140-180, and anything below 60 makes breakeven nearly impossible unless rent is unusually low. It is segmented by orthopedic, primary care, workers' comp, sports medicine, self-pay, and direct access.
This metric suits clinic directors and regional leaders managing liaison teams and physician outreach. It trades away short-term control, because referral flow depends on external physicians rather than internal scheduling. Compared to visits per therapist per day above it, referrals are the input that productivity converts into revenue, and a clinic over-indexed above 60% on one referring practice sits one acquisition away from a 25-30% revenue cliff.
3. New Patient Evaluation Conversion Rate

New patient evaluation conversion rate ranks third because it captures the leakage between referral received and care actually started, with ATI and Athletico playbooks targeting 88-92%. Below 80% signals scheduling friction, insurance verification delays, or referral leakage to competitors. Clinics that contact a referred patient within 4 business hours convert at 91%, while waiting 48 hours drops conversion to 71%.
This KPI is for front-desk managers and intake teams running Salesforce Health Cloud, Net Health Therapy's Inquiry-to-Eval module, or WebPT's Patient Engagement queue. It trades away the assumption that a referral equals a patient, forcing investment in call speed and verification staffing. Compared to referrals per month above it, conversion is the multiplier that determines how much of the top-of-funnel volume actually becomes billable evaluations.
4. No-Show and Cancellation Rate
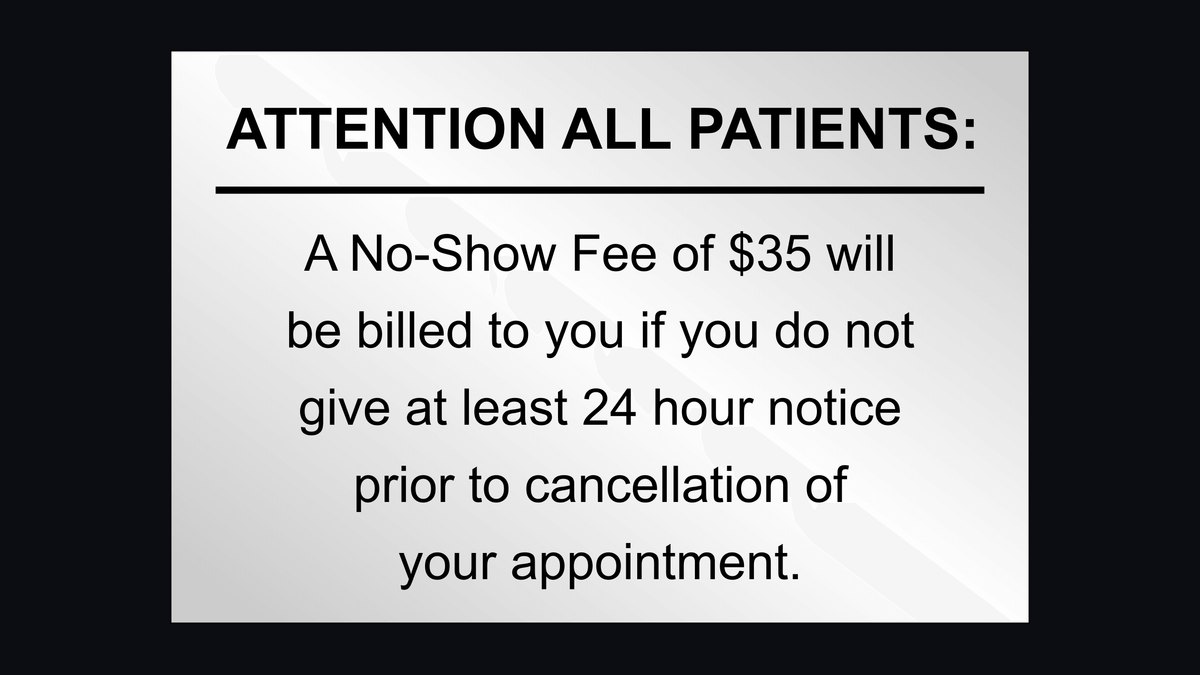
No-show and cancellation rate ranks fourth because every point above the under-12% combined benchmark costs roughly $4,500-$6,500 per clinic per year in lost capacity. Targets are under 8% no-show and under 5% same-day cancellation, but most clinics actually run 14-19% combined. SMS reminders at T-48 hours and T-2 hours cut no-shows 30-40%, and collecting copays at booking reduces no-shows 25% for patients with $40+ copays.
This metric is for front-desk supervisors and operations managers running WebPT Reach, TherapyNotes, or Raintree reminder modules. It trades away schedule flexibility, because same-day rescheduling rules and wait-list refill workflows require rigid discipline. Compared to evaluation conversion above it, no-shows attack the schedule after booking, while conversion governs whether the booking happens at all.
5. Plan of Care Completion Rate

Plan of care completion rate ranks fifth because healthy clinics run 65-75% while the industry has settled at 55-60%, leaving 30-40% of authorized clinical revenue on the table. Upstream Rehabilitation, FYZICAL, and BenchMark hit 72-78% through formal mid-POC check-ins at visit 4-5, FOTO or Keet Health outcome tracking, and same-day rescheduling rules. Typical orthopedic plans run 8-12 visits, while post-op and neuro cases run 16-24.
This KPI is for clinical directors and therapists managing episode length and patient engagement. It trades away short-term scheduling convenience, since enforcing rebooking before a patient leaves the phone call adds front-desk friction. Compared to no-show rate above it, completion measures whether patients finish authorized care, while no-shows measure whether they arrive for individual visits.
6. Average Reimbursement per Visit
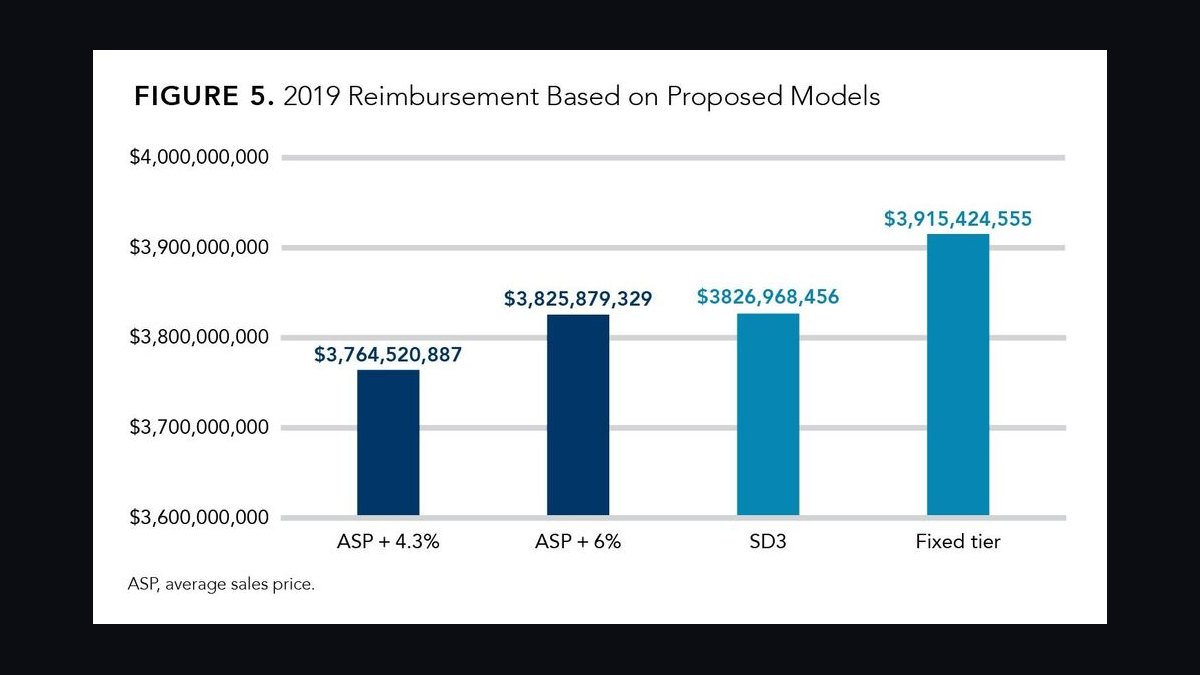
Average reimbursement per visit ranks sixth because it is the yield metric that determines margin after volume, with 2027 Medicare at $95-$110 after the 1.25% fee schedule cut, commercial PPO at $100-$140, workers' comp at $145-$220, and cash-pay sports medicine at $125-$180. A clinic with 35% workers' comp mix earns 30-40% more per visit than one at 5%. Payer mix is the single biggest determinant of EBITDA after productivity.
This KPI is for finance leaders and CEOs negotiating contracts and modeling payer mix annually. It trades away simplicity, because it must be tracked separately by payer and re-forecast whenever Aetna or UHC cuts PT rates 3-7% on renewal. Compared to plan of care completion above it, reimbursement per visit sets the price of each completed episode, while completion determines how many episodes finish.
7. Units Billed per Visit

Units billed per visit ranks seventh because CMS reimburses PT in 15-minute CPT units under the 8-Minute Rule, and the industry averages 3.0-3.6 units while high performers hit 3.6-3.8 without crossing into audit territory. The sweet spot is 3.5-3.8 commercial and 3.2-3.5 Medicare, since clinics billing above 4.0 units per visit consistently for Medicare patients trigger Targeted Probe and Educate reviews.
This KPI is for compliance officers and clinical directors using Clinicient Insight, WebPT Analytics, or Raintree's compliance dashboard to flag therapists outside the band weekly. It trades away maximum revenue per visit, because staying audit-safe caps units below what aggressive billing could theoretically capture. Compared to average reimbursement per visit above it, units per visit drive the billed charge while payer rates determine what is actually collected.
8. Days in Accounts Receivable
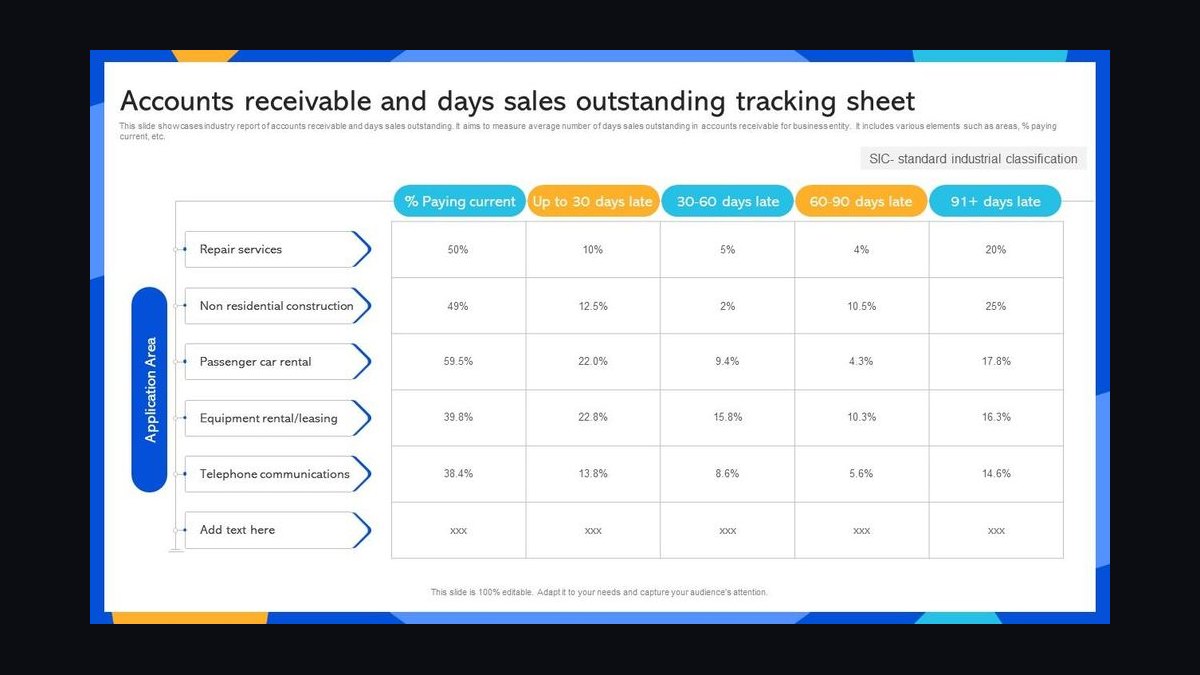
Days in accounts receivable ranks eighth because it is the revenue cycle metric that determines how fast billed services become cash, with a target under 35 days against an industry median of 42-48 days. Workers' comp pushes AR to 60-95 days, and some California carriers run 120+. Days in AR 0-30 should be 55-65% of total AR, days over 90 should be under 12%, and first-pass denial rate should stay under 8%.
This KPI is for revenue cycle managers and CFOs choosing between Net Health Revenue Cycle, Therabill, WebPT Billing, or Clinicient Insight RCM. It trades away cash speed for payer breadth, since accepting workers' comp cases lengthens AR substantially. Compared to units billed per visit above it, AR days measure collection efficiency after billing, while units determine the size of each claim submitted.
9. Physician Referral Retention Rate

Physician referral retention rate ranks ninth because it measures the relationship moat, tracking whether 80%+ of last year's top 20 referring physicians still rank in the top 30 this year. Anything below 70% means a hospital system, ortho-owned PT, or rival multi-site is poaching. ATI's pre-bankruptcy decline showed up first here, with a 14% top-source loss in 2022 preceding the financial collapse by 18 months.
This KPI is for liaison teams and regional directors running 1.0-1.5 face-to-face visits per top-20 MD monthly with auto-generated outcome reports from WebPT or Raintree. It trades away passive referral flow, requiring continuous outreach investment even when volume looks healthy. Compared to days in AR above it, retention protects future revenue while AR measures collection of past revenue.
10. Clinic-Level EBITDA Margin

Clinic-level EBITDA margin ranks tenth because it is the composite outcome of the nine operating KPIs, with well-run clinics hitting 18-24% and struggling ones falling below 8% when two or more KPIs miss. It is reviewed monthly by regional directors and quarterly at the board level alongside payer contract renewals, PT recruiting funnels, and de novo pipelines. Multi-site operators like USPH consistently report 18-22% EBITDA across roughly 770 clinics.
This KPI is for CEOs, boards, and PE-backed platform operators evaluating clinic ranking, comp payouts, and acquisition multiples. It trades away diagnostic specificity, since margin tells you something is wrong without revealing which of the nine operating metrics caused it. Compared to physician referral retention above it, EBITDA is the lagging financial result while retention is the leading relationship indicator.
How we ranked these
We ranked nine KPIs by their statistical link to clinic-level EBITDA and cash survival, weighting referral volume and visits per therapist per day most heavily because they compound into every downstream metric. Payer mix, POC completion, no-show rate, units per visit, days in AR, and top-20 referrer retention followed, each scored on benchmark spread and controllability by a clinic director within 90 days.
We deliberately ignored marketing spend, website traffic, social followers, patient satisfaction scores, and brand awareness. None reliably predict PT clinic margin because demand is referral-driven and reimbursement is fee-schedule-bound, not price-negotiable. We also excluded therapist satisfaction and turnover as standalone KPIs, since they surface in productivity and POC completion before appearing in any HR dashboard.
Related questions
How many referrals per month does a healthy PT clinic need?
Single-clinic operators should target 80-120 new referrals monthly; mature suburban clinics with an active liaison program push 140-180. Below 60 per month, breakeven is nearly impossible unless rent is unusually low. Track referrals segmented by orthopedic, primary care, workers' comp, sports medicine, and direct-access sources to spot concentration risk early.
What is a good visits-per-therapist-per-day benchmark?
Target 10-14 visits per licensed PT per eight-hour clinical day. Select Medical runs near 11.5, USPH reports 11-12, and ATI targets 12-13. Hospital-owned outpatient sits around 9-10. Below 9 the clinic loses money at standard reimbursement; above 15 you invite burnout, documentation audit risk, and 8-Minute Rule compliance failures.
Why does no-show rate matter more than marketing spend?
Every percentage point of no-show above the 12% combined benchmark costs roughly $4,500-$6,500 per clinic annually in lost capacity. SMS reminders at T-48 and T-2 hours cut no-shows 30-40%, and collecting copays at booking reduces them another 25%. Marketing cannot fix a schedule full of holes; operations can.
How does payer mix affect PT clinic EBITDA?
A clinic with 35% workers' comp mix earns 30-40% more per visit than one at 5%, because workers' comp pays $145-$220 versus $100-$140 commercial and $95-$110 Medicare. Payer mix is the single biggest EBITDA determinant after productivity. Model it annually and negotiate carve-outs for high-acuity post-op, neuro, and vestibular services.
What is the 8-Minute Rule and why does it cap units billed?
CMS reimburses PT in 15-minute CPT units, and the 8-Minute Rule governs how partial units round. Industry average is 3.0-3.6 units per visit; high performers hit 3.6-3.8. Clinics billing above 4.0 units consistently for Medicare patients trigger Targeted Probe and Educate audits, so the sweet spot is 3.5-3.8 commercial and 3.2-3.5 Medicare.
How long should PT accounts receivable take to collect?
Target under 35 days; industry median runs 42-48. Workers' comp pushes AR to 60-95 days, with some California carriers exceeding 120. Aim for 55-65% of total AR in the 0-30 day bucket and under 12% over 90 days. PT-specific RCM vendors outperform generic medical billing by 6-10 days on average.
What retention rate should top referring physicians hit year over year?
Target 80%+ retention of your top-20 referring physicians year over year. Below 70% signals active poaching by hospital systems or rival multi-site operators. Track liaison face-to-face visits per top-20 MD at 1.0-1.5 monthly, and flag any 25%+ drop in monthly referrals from a top source for immediate outreach.
What EBITDA margin should a commercial PT clinic target in 2027?
Hit the nine core KPIs and your clinic runs 18-24% EBITDA. Miss two and you fall below 8%. USPH consistently reports 18-22% across roughly 770 clinics. The margin gap between top and bottom quartile operators is almost entirely explained by productivity, payer mix, and POC completion, not by marketing or location.
FAQ
What is the single most important sales KPI for a multi-site PT operator?
Visits per therapist per day, full stop. It compounds with every other KPI: productivity drives revenue per clinic, supports payer rate negotiation, funds liaison hiring, and is the primary input to EBITDA. Track it daily by therapist and benchmark weekly against the 10-14 band. Anything below 9 visits per PT per day is a profitability emergency.
How do you grow referrals without hiring more outreach reps?
Three plays. Push direct-access marketing, legal in all 50 states with varying restrictions, which yields 8-15% of new referrals in mature markets. Build same-day evaluation slots because orthopedic surgeons send more cases to PTs who see patients within 48 hours. Automate post-discharge MD reports with outcome data from WebPT, FOTO, or Keet, since the report itself drives repeat referrals.
How does workers' comp change the PT clinic operating model?
Workers' comp visits pay 50-100% more than commercial but require more administrative work: case manager calls, IME coordination, return-to-work notes. No-show rates run 1.8-2.2x commercial and AR cycles stretch to 60-95 days. A 25-35% workers' comp mix is the sweet spot for most markets. Beyond 50% you take on real volatility risk if the state fee schedule changes.
When should a PT clinic consider selling to a PE-backed platform?
When EBITDA hits $400k-$800k per clinic and you operate 3+ clinics with consistent 18%+ margins, you will see 6-9x EBITDA multiples in 2027. Single-clinic operators typically transact at 3.5-5x. Operating partners look for payer mix diversity, no single referrer over 20%, MD-led PT culture, and clean documentation and billing history.
How is AI changing PT clinic operations in 2027?
Three production use cases. Ambient documentation tools adapted for PT cut charting time 30-50%. Insurance authorization automation reduces auth turnaround from 3-5 days to 24-48 hours. Predictive no-show scoring built into Raintree and Clinicient flags high-risk appointments for proactive outreach. AI is not replacing therapists; it is recovering 4-6 hours per PT per week.
What benchmarks should a new PT clinic hit by month 12?
By month 12, target 70-90 referrals per month, 10-12 visits per PT per day, combined no-show under 14%, POC completion above 60%, and days in AR under 45. EBITDA typically lands 8-14% in year one as the referral base matures. Clinics that hit these numbers usually cross 18% EBITDA by month 24.
How often should a clinic director review the KPI scorecard?
Daily 15-minute huddles cover schedule fill rate, cash collected, new referrals, and eval no-shows. Weekly Monday scorecards review visits per PT per day, referrals by source, POC completion, and AR work queues. Monthly regional reviews cover reimbursement per visit by payer, top-20 referrer activity, and clinic-level EBITDA. Quarterly board reviews cover payer contracts, recruiting, and de novo pipeline.
What is the fastest way to fix a bottom-quartile clinic?
Deploy SMS reminder cadence at T-48 and T-2 hours to cut no-shows 20-30% within 30 days. Standardize eval conversion so first call happens within 4 business hours and scheduling within 48 hours of referral. Implement a weekly visits-per-PT-per-day scorecard with director accountability. Renegotiate or terminate the bottom five commercial payer contracts. These four moves typically recover 8-12 margin points in 90 days.
How does documentation quality affect PT clinic revenue?
Medicare Targeted Probe and Educate or commercial payer audits can recoup 12-25% of trailing 24-month Medicare revenue if documentation is insufficient or 8-Minute Rule violations are found. Weekly internal audits of five random charts per PT, monthly compliance committee reviews, and EMR templates that enforce minutes-by-CPT documentation are the standard defenses. Documentation is a revenue protection KPI, not a back-office chore.
What payer mix should a commercial PT clinic target?
Aim for 40-55% commercial, 20-30% Medicare and Medicare Advantage, 20-30% workers' comp, and 8-12% cash-pay sports medicine. This mix balances rate stability against volume volatility. Clinics over 60% Medicare face fee-schedule risk; clinics over 50% workers' comp face state regulatory risk. Diversification is the single best hedge against payer-driven margin collapse.
Sources
- https://www.bls.gov/ooh/healthcare/physical-therapists.htm
- https://www.cms.gov/medicare/payment/fee-schedules/physician
- https://www.apta.org/apta-and-you/advocacy/medicare-fee-schedule
- https://www.cms.gov/Outreach-and-Education/Medicare-Learning-Network-MLN/MLNProducts/Downloads/8-Minute-Rule-PT-OT-SLP.pdf
- https://www.usph.com/investors
- https://www.selectmedical.com/
- https://www.atipt.com/
- https://www.athletico.com/
- https://www.upstreamrehab.com/
- https://www.oig.hhs.gov/reports-and-publications/workplan/index.asp
Related on PULSE
- [More sales kpis for commercial physical therapy clinic rankings and buying guides](/knowledge)
- [PULSE Tools and calculators](/tools)
- [Everything on PULSE RevOps](/)
This page will be disappearing soon. Save it to your device for $1 — or read it free while it is here.
@Kory-White- · if Venmo asks, the last 4 of my number are 2012
 pulse-industry-kpisTop 10 Sales KPIs for Elevator and Escalator Service in 2027
 pulse-industry-kpisTop 10 Sales KPIs for Hospital Medical Gas System Installation & Certification in 2027
 pulse-industry-kpisTop 10 Sales KPIs for Commercial Locksmith & Access Control Services in 2027
 pulse-industry-kpisTop 10 Sales KPIs for Modular and Prefab Construction in 2027
 pulse-industry-kpisTop 10 KPIs for Auto Repair Shops in 2027
 pulse-industry-kpisTop 10 KPIs for Physical Therapy Clinics in 2027
 pulse-industry-kpisTop 10 Sales KPIs for Commercial Bus Dealership in 2027
 pulse-industry-kpisTop 10 Sales KPIs for Commercial Surgical Center and ASC in 2027
 pulse-industry-kpisTop 10 Sales KPIs for Commercial Pharmaceutical Sales in 2027
 pulse-industry-kpisTop 10 Sales KPIs for Telehealth Platform Services in 2027