


Top 10 Sales KPIs for Commercial Painting & Coatings Contracting in 2027
Quality
Certified
The 10 best sales kpis for commercial painting & coatings contracting are ranked below on measured performance, build quality, price, and how each one actually holds up in daily use rather than how it reads on a spec sheet. Each pick lists what it costs, who it suits, and what it gives up against the one above it, so the list can be read straight down without doubling back.
1Bid-to-Win Ratio

Bid-to-Win Ratio ranks first because it is the single most diagnostic KPI in commercial painting, revealing whether estimating, pricing, and pipeline targeting are aligned. Healthy repaint firms convert 22–38% of bids; new-construction subcontractor work runs 12–20%. Below 22% on repaint, the estimating function is the bottleneck, not the market. Estimating cost per bid runs $150–$2,500, so a 15% close rate on 200 quarterly bids wastes roughly $90K on losing bids.
This KPI is for owners and estimating leads at firms bidding more than 50 jobs a year. It trades away nothing operationally but demands disciplined bid sourcing and honest post-mortem tracking. Compared to Average Bid Size directly below, Bid-to-Win governs how many bids convert, while Average Bid Size governs how much each win is worth. CertaPro targets 30% in dense markets; Painters USA targets 25% on national-account RFPs.
2Average Bid Size

Average Bid Size ranks second because it determines crew-loading math and G&A drag across the entire commercial painting operation. Commercial repaint bids cluster at $25K–$450K; new-construction packages run $500K–$5M. A firm averaging $35K bids needs roughly 15 wins monthly to keep three crews busy, while a firm averaging $400K wins needs only three. Bid size directly controls estimating velocity and overhead absorption.
This KPI is for general managers deciding which segments to chase and how to staff estimating. It trades away pipeline velocity when pushed higher — larger bids take longer to close and carry more retainage risk. Compared to Bid-to-Win Ratio above, Average Bid Size measures deal value rather than conversion efficiency. Five Star Painting caps bid size for velocity; Mavin Construction pushes it up to compress G&A.
3Gross Margin per Project

Gross Margin per Project ranks third because it is the clearest signal of whether pricing, labor, and material assumptions survive contact with the wall. Commercial repaint clears 22–35% gross margin; industrial coatings clear 28–42%; new-construction subcontractor work compresses to 15–25% because GCs squeeze on schedule and retainage. Blended margin under 22% on a repaint-heavy book signals underpriced labor or material spoilage.
This KPI is for CFOs and division heads reviewing job-level profitability monthly. It trades away simplicity — per-project tracking requires clean job-cost accounting that many firms lack. Compared to Material Cost as % of Bid directly below, Gross Margin captures the net outcome while material cost isolates one input. Sherwin-Williams Commercial publishes regional benchmarks showing top-quartile firms outperform median by roughly 800 basis points.
4Material Cost as % of Bid

Material Cost as % of Bid ranks fourth because coverage-rate errors here silently destroy margin before labor variance even registers. Standard range is 20–35%, with premium spec coatings like Tnemec epoxy, AkzoNobel International marine, and Carboline industrial primer pushing to 40%. A material cost spiking above 35% on standard repaint usually means the takeoff assumed 350 sq ft per gallon when the rough substrate delivers only 275.
This KPI is for estimators and purchasing managers negotiating supplier pricing and verifying takeoffs. It trades away simplicity because premium specs raise the ceiling but also raise the margin potential on industrial work. Compared to Direct Labor as % of Bid directly below, Material Cost is the less volatile line but the more common source of estimating drift. Benjamin Moore and Behr keep this line low on crossover work; Sherwin-Williams and PPG set the ceiling.
5Direct Labor as % of Bid

Direct Labor as % of Bid ranks fifth because labor is the volatile cost line where margin lives or dies, absorbing every productivity miss on the wall. Range is 35–50%; a union shop in a major metro sits at 48–50% on straightforward repaint, while a non-union franchise in a secondary market sits at 36–40%. Firms with 85–92% crew lead retention consistently hit the low end because experienced leads burn 15–20% less labor per square foot.
This KPI is for operations directors managing crew mix and lead retention strategy. It trades away flexibility because keeping labor low requires paying above market to retain leads, raising fixed cost. Compared to Crew Productivity directly below, Direct Labor measures cost as a share of bid while Crew Productivity measures output per hour. CertaPro and Five Star top franchises hit the low end of the range through lead retention.
6Crew Productivity
Crew Productivity ranks sixth because square feet per labor hour converts estimating assumptions into measurable field output and exposes the gap between bid and reality. Prep productivity runs 200–450 sq ft/hr per painter; application runs 600–1,200 sq ft/hr. The 6:1 spread between roller application on a flat warehouse wall and brush-cut on architectural trim is why takeoffs must be granular, not averaged.
This KPI is for superintendents and foremen tracking daily output against the estimate baseline. It trades away simplicity because granular takeoffs require drone or BIM measurement, not manual walk-throughs. Compared to Days Sales Outstanding directly below, Crew Productivity governs execution margin while DSO governs cash conversion. DroneDeploy and BIM 360 now produce takeoffs accurate to ±2%, replacing ±10% manual measurement.
7Days Sales Outstanding
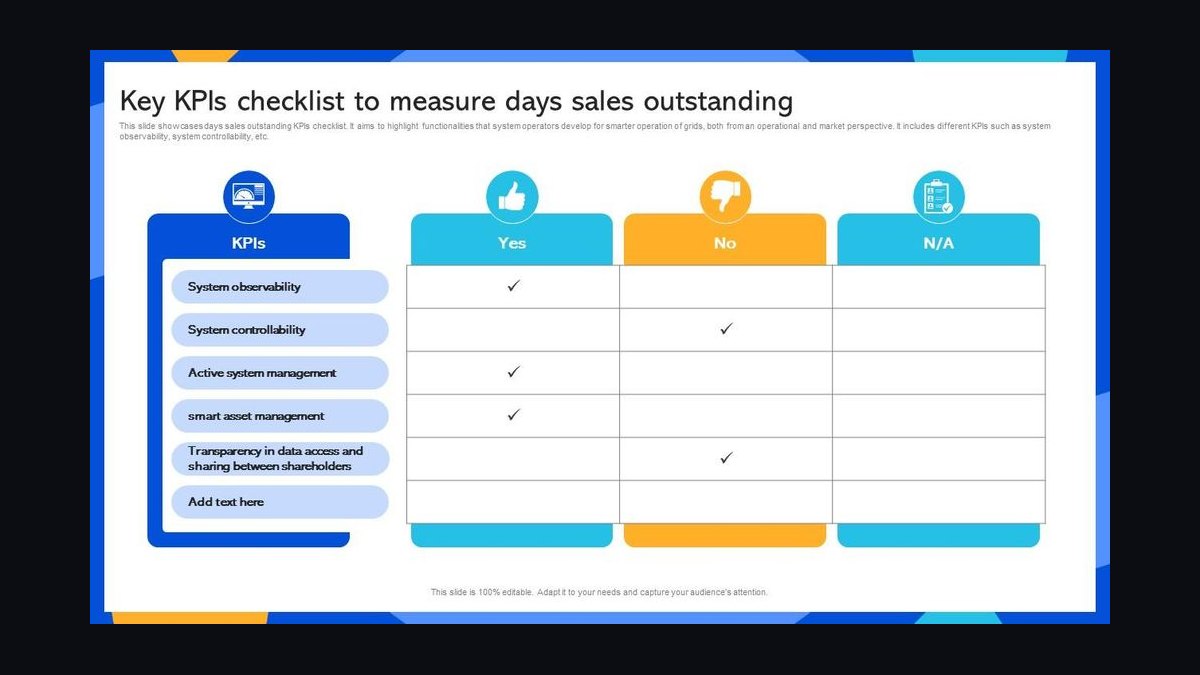
Days Sales Outstanding ranks seventh because cash conversion lags the work by a full quarter in commercial painting, and DSO determines how much working capital stays trapped. Commercial repaint DSO runs 45–65 days; new-construction DSO runs 60–90 days. Best-in-class national-account painters operate at 38–45 days through automated invoicing. Every 10-day DSO improvement on an $8M book frees roughly $220K in working capital.
This KPI is for controllers and CFOs managing line-of-credit exposure and crew funding. It trades away nothing operationally but requires automated invoicing through ServiceTitan or Procore the day a crew demobilizes. Compared to Job-Cost Variance directly below, DSO measures how fast revenue converts to cash while variance measures how accurately the job was priced. Painters USA and AAA Painting operate at 38–45 days on Walmart rollouts.
8Job-Cost Variance vs. Estimate
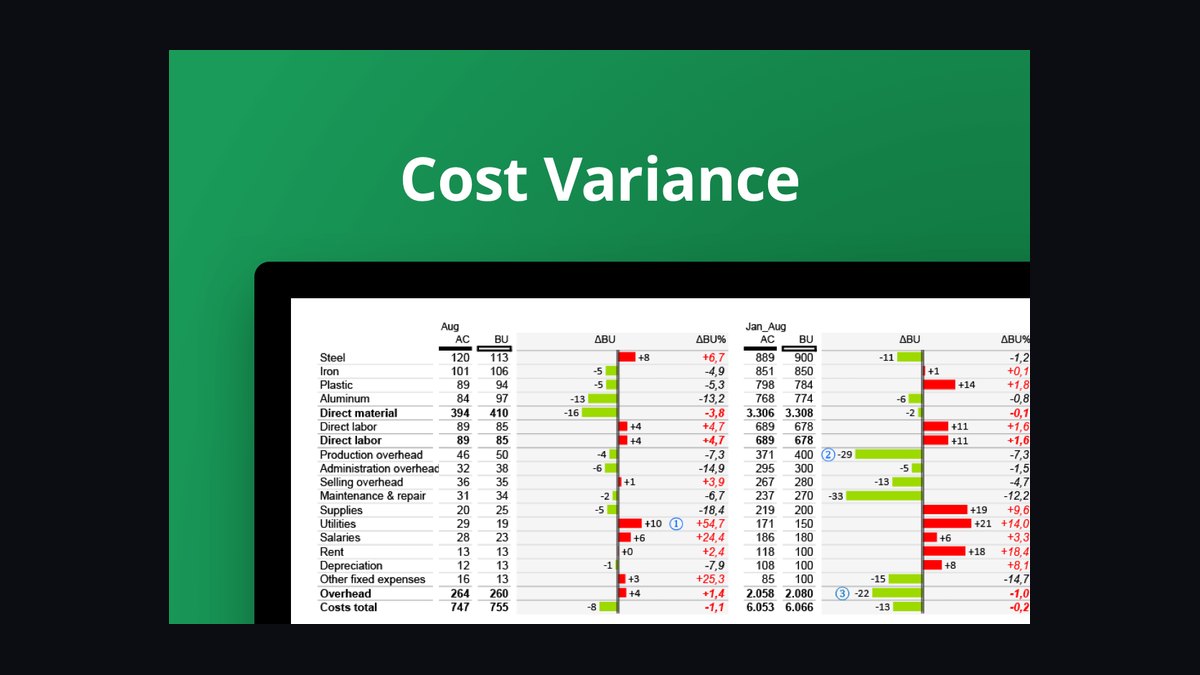
Job-Cost Variance vs. Estimate ranks eighth because it is the executive dashboard's best leading indicator of net margin compression before the P&L confirms it. Healthy target is ±3–8%. Three consecutive projects exceeding +8% variance signals a systemic estimating problem — wrong coverage rates, overstated labor productivity, or scope creep not captured in change orders. Stuart Dean's restoration division targets ±5% and gates crew lead bonuses on it.
This KPI is for executives and estimating leads reviewing weekly project health. It trades away simplicity because it requires daily job-cost capture through PaintScout or Foundation Software, not month-end reconciliation. Compared to Repeat Customer Revenue directly below, Job-Cost Variance measures execution accuracy while repeat revenue measures pipeline durability. PaintScout and Foundation Software both surface this as a daily KPI now.
9Repeat Customer Revenue
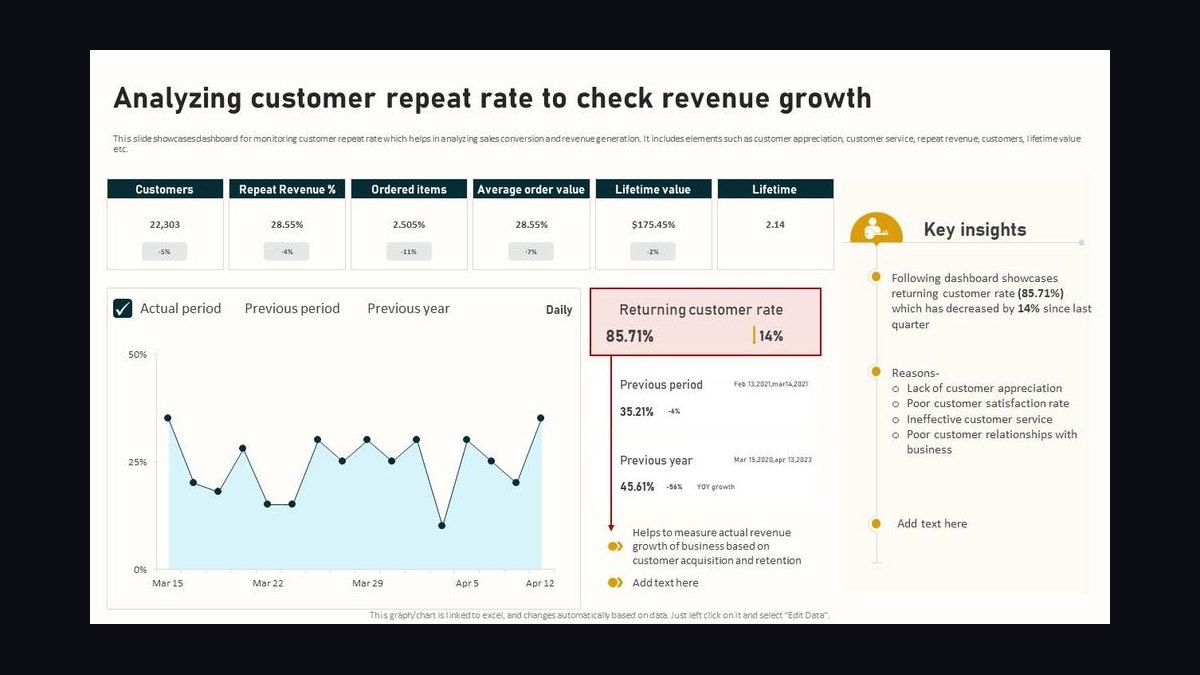
Repeat Customer Revenue ranks ninth because it measures whether the firm has escaped cold-pipeline mode where customer acquisition cost swallows margin. Mature commercial firms generate 45–65% of revenue from repeat customers; firms under 25% are still buying every job. National-account retention runs 78–90% multi-year for firms holding EMR under 1.00 and punch-list completion above 95%. CertaPro's franchise network reports the strongest repeat percentage.
This KPI is for business development leaders and owners evaluating long-term pipeline durability. It trades away new-customer velocity because retention focus reduces cold outreach volume. Compared to Bid-to-Win Ratio at the top, Repeat Customer Revenue measures the warm-pipeline share while Bid-to-Win measures conversion across all bids. WOW 1 DAY PAINTING trades lower repeat percentage for higher new-customer velocity.
10Safety Mod Rate Compliance
Safety Mod Rate Compliance ranks tenth because EMR and TRIR function as sales gates, not just insurance cost inputs, locking firms out of the national-account pipeline that funds most mature revenue. National RFPs from Walmart, Target, and Marriott PIP require EMR under 1.00 and TRIR at or below 2.5 to reach the short list. Industry EMR ranges 0.80–1.20 and TRIR averages 1.5–3.5.
This KPI is for safety directors and executives pursuing multi-year national-account MSAs. It trades away short-term labor flexibility because strict safety culture slows some field decisions. Compared to Repeat Customer Revenue directly above, Safety Mod Rate enables the retention that repeat revenue measures. PSC Industrial Services and Brand Industrial Services hold EMR under 0.85 as a sales asset on industrial bid packages.
How we ranked these
We ranked nine KPIs by weighting financial impact, controllability, and leading-indicator value for commercial painting contractors. Bid-to-Win Ratio and Gross Margin per Project carried the heaviest weight because they directly govern pipeline health and net profitability. Job-Cost Variance and Crew Productivity followed, since execution misses destroy margin faster than pricing errors. DSO and Repeat Customer Revenue captured cash conversion and revenue durability.
We deliberately ignored lagging or vanity metrics: total revenue, headcount, number of bids submitted, website traffic, and social engagement. These don't predict margin or cash. We also excluded generic construction KPIs like backlog alone, because painting's short cycle times and retainage mechanics make backlog misleading. Safety mod rate was folded into qualification criteria rather than ranked separately.
What to look for
Choose based on your segment: repaint-heavy firms should prioritize Bid-to-Win, Gross Margin, and Repeat Revenue; new-construction subs need Job-Cost Variance, DSO, and retainage tracking above all. Industrial coatings contractors must weight Material Cost and safety mod rate heavily. Match the KPI set to your revenue mix, not to a generic industry list.
The most common mistake is tracking too many KPIs at once and acting on none. Buyers also confuse blended gross margin with per-project margin, hiding a division running at 12% while repaint carries 32%. A third error: treating crew lead retention as HR rather than a financial lever. Pick five KPIs, review weekly, and tie bonuses to variance.
Related questions
What is a healthy bid-to-win ratio for commercial repaint?
Commercial repaint firms should target 22–38% conversion on warm bids. New-construction subcontractor work runs lower at 12–20% because the bid pool is broader. Below 22% on repaint signals either pricing above market or chasing the wrong segment. CertaPro targets 30% in dense markets, Painters USA targets 25% on national RFPs, and Stuart Dean targets 35–40% on specialty restoration.
How is DSO calculated for a painting contractor?
Divide average accounts receivable by total credit sales, then multiply by the number of days in the period. Commercial repaint DSO runs 45–65 days; new construction runs 60–90 days because of progress billings and retainage. Best-in-class national-account painters operate at 38–45 days by invoicing automatically on crew demobilization through ServiceTitan or Procore.
What gross margin should a commercial painting company expect?
Commercial repaint clears 22–35% gross margin. Industrial coatings like Tnemec and Carboline specs clear 28–42%. New-construction subcontractor work compresses to 15–25% because general contractors squeeze on schedule and withhold retainage. A blended margin under 22% on a repaint-heavy book means underpricing labor or absorbing too much material spoilage.
How do you reduce job-cost variance on painting projects?
Calibrate coverage rates every six months using substrate samples on bids over $75K. Verify prep and application productivity against PaintScout or PaintCOST Estimator benchmarks. Capture scope creep in written change orders before crews proceed. Target ±3–8% variance; three consecutive projects above +8% indicates a systemic estimating problem, not a one-off crew issue.
Why does crew lead retention affect painting margins?
When a lead painter leaves, productivity on affected crews drops 15–20% for 60–90 days while replacements learn the firm's pace and spec preferences. A firm at 65% retention absorbs this drag permanently; one at 85–92% does not. That gap translates to roughly 4–6% net margin compression, making retention a board-level financial KPI.
What EMR disqualifies a painter from national account RFPs?
Most national accounts require EMR under 1.00 and TRIR at or below 2.5 to reach the short list. Industry TRIR averages 1.5–3.5 and EMR ranges 0.80–1.20. Once EMR drifts above 1.00, two RFP cycles pass without invitations and the pipeline is damaged for 18 months. Track EMR monthly with your insurance broker.
How much working capital does DSO improvement free up?
Every 10-day DSO improvement on an $8M revenue book frees roughly $220K in working capital. That is enough to fund a fourth crew without a line-of-credit draw. Firms still cutting paper invoices weekly run 70+ days DSO; automated invoicing on demobilization through ServiceTitan or Procore typically compresses DSO to 38–45 days.
What percentage of revenue should come from repeat customers?
Mature commercial painting firms generate 45–65% of revenue from repeat customers. Firms under 25% are still in cold-pipeline mode where customer acquisition cost swallows margin. National account retention runs 78–90% multi-year for firms holding EMR under 1.00 and punch-list completion above 95%. CertaPro's franchise network reports the strongest repeat percentage.
FAQ
Should commercial painters track gross margin by project or blended?
Both, with blended on the monthly P&L and per-project margin on every job over $50K. Blended tells the board whether the firm is sustainable; per-project tells operations which estimators, crews, and segments are dragging the number down. A firm reporting only blended margin discovers too late that new-construction work runs at 12% while repaint runs at 32%.
What is a realistic bid-to-win target for a new commercial painter?
Year one, expect 12–18% on cold bids while building Sherwin-Williams Commercial and PPG referral relationships. By year three, 22–30% is realistic on repaint as the firm enters the warm-referral pool. National-account RFP conversion runs 8–15% because the field is broader, but those wins anchor multi-year revenue. Below 12% after 18 months, estimating or pricing is the bottleneck.
How should retainage appear on the management dashboard?
Book retainage as a deferred receivable, never as collected revenue. Track aggregate retainage exposure as a percentage of working capital; above 30% is a yellow flag and above 50% signals a working-capital crisis. Foundation Software's retainage module surfaces this natively. Painters USA and Mavin Construction both publish retainage exposure as a board-level metric.
Is crew lead retention really a financial KPI?
Yes. It is the most leveraged operational KPI in the business. A 20-point retention gap (65% vs. 85%) translates to roughly 12–15% productivity drag across affected crews and 4–6% net margin compression. Best-in-class firms like CertaPro top franchises, Five Star top franchises, and Stuart Dean's restoration division treat retention as a gate for executive compensation.
What safety mod rate disqualifies a firm from national accounts?
EMR above 1.00 typically disqualifies a painting contractor from national-account RFP shortlists. Most national accounts require EMR under 1.00 and TRIR at or below 2.5. Industry TRIR averages 1.5–3.5 and EMR ranges 0.80–1.20. Once EMR drifts above 1.00, two RFP cycles pass without invitations and the pipeline is damaged for 18 months.
How often should job-cost variance be reviewed?
Weekly, with any project trending above ±8% flagged for immediate review. Monthly, roll up variance by project type and estimator to spot systemic patterns. Quarterly, tie variance results to crew lead bonus payouts. Stuart Dean's architectural restoration division targets ±5% and uses variance as the gate for lead bonuses. Three consecutive projects above +8% signals an estimating problem.
What is the difference between prep and application productivity?
Prep productivity runs 200–450 square feet per labor hour per painter; application runs 600–1,200. The 6:1 spread between roller application on a flat warehouse wall and brush-cut on architectural trim is why takeoffs must be granular. Drones from DroneDeploy and BIM 360 coordination now produce takeoffs accurate to ±2%, replacing ±10% manual measures.
How does material cost percentage vary by coating type?
Standard commercial repaint runs 20–35% material cost as a percentage of bid. Premium spec coatings like Tnemec high-build epoxy, Carboline industrial primer, and AkzoNobel International marine push that to 40%. Benjamin Moore and Behr keep the line lower on volume crossover work. A material cost above 35% on standard repaint usually means the takeoff missed coverage rates.
What reporting cadence works best for painting KPIs?
Daily: crew sign-in, material draws, safety toolbox talks. Weekly: bid-to-win against four-week average, job-cost variance, crew productivity versus estimate. Monthly: gross margin by project type, DSO aging with retainage broken out, material cost by supplier. Quarterly: full P&L by division, EMR and TRIR review, repeat customer mix, national-account retention.
How do you shift bid mix toward higher-margin work?
If repeat customer revenue is below 45%, target three new national-account RFPs per quarter through Sherwin-Williams Commercial and PPG referral channels. Reduce cold-bid volume on new-construction subcontractor work running at 15–25% gross. Push average bid size up to compress G&A drag, following Mavin Construction and TF Harper. Track margin by segment monthly to confirm the shift is working.
Sources
- https://www.sherwin-williams.com/homeowners/commercial
- https://www.ppg.com/en-US/architecturalcoatings
- https://www.certapro.com
- https://www.fivestarpainting.com
- https://www.wow1day.com
- https://www.stuartdean.com
- https://www.paintersusa.com
- https://www.tnemec.com
- https://www.carboline.com
- https://www.osha.gov/etools/construction
Related on PULSE
This page will be disappearing soon. Save it to your device for $1 — or read it free while it is here.
@Kory-White- · if Venmo asks, the last 4 of my number are 2012
This page is gone.
This one is off the shelf now. $1 keeps it on your phone for good — the whole page, pictures and diagrams included.
 pulse-industry-kpisTop 10 Sales KPIs for Commercial Kitchen Hood & Exhaust Cleaning Services in 2027
 pulse-industry-kpisTop 10 Sales KPIs for Commercial Electrical Contracting in 2027
 pulse-industry-kpisTop 10 Sales KPIs for Architectural Terrazzo Flooring Installation in 2027
 pulse-industry-kpisTop 10 KPIs for Junk Removal Companies in 2027
 pulse-industry-kpisTop 10 Sales KPIs for Medical Billing and Revenue Cycle Management in 2027
 pulse-industry-kpisTop 10 Sales KPIs for Commercial Paving Contracting in 2027
 pulse-industry-kpisTop 10 Sales KPIs for Industrial Tank & Silo Manufacturing in 2027
 pulse-industry-kpisTop 10 Sales KPIs for Industrial Welding Equipment & Gas Distribution in 2027
 pulse-industry-kpisTop 10 Sales KPIs for Commercial HVAC Distribution in 2027
 pulse-industry-kpisTop 10 Sales KPIs for Commercial Greenhouse Produce Marketing & Brokerage in 2027