
Top 10 Sales KPIs for Commercial Hydroponic Vertical Farm Operations in 2027
 Curated byKory White · Fractional CRO · Maryland
 PULSEKNOWLEDGE LIBRARY
Quality
Certified

The 10 best sales kpis for commercial hydroponic vertical farm operations are ranked below on measured performance, build quality, price, and how each one actually holds up in daily use rather than how it reads on a spec sheet. Each pick lists what it costs, who it suits, and what it gives up against the one above it, so the list can be read straight down without doubling back.
1. Contracted Offtake Coverage KPI
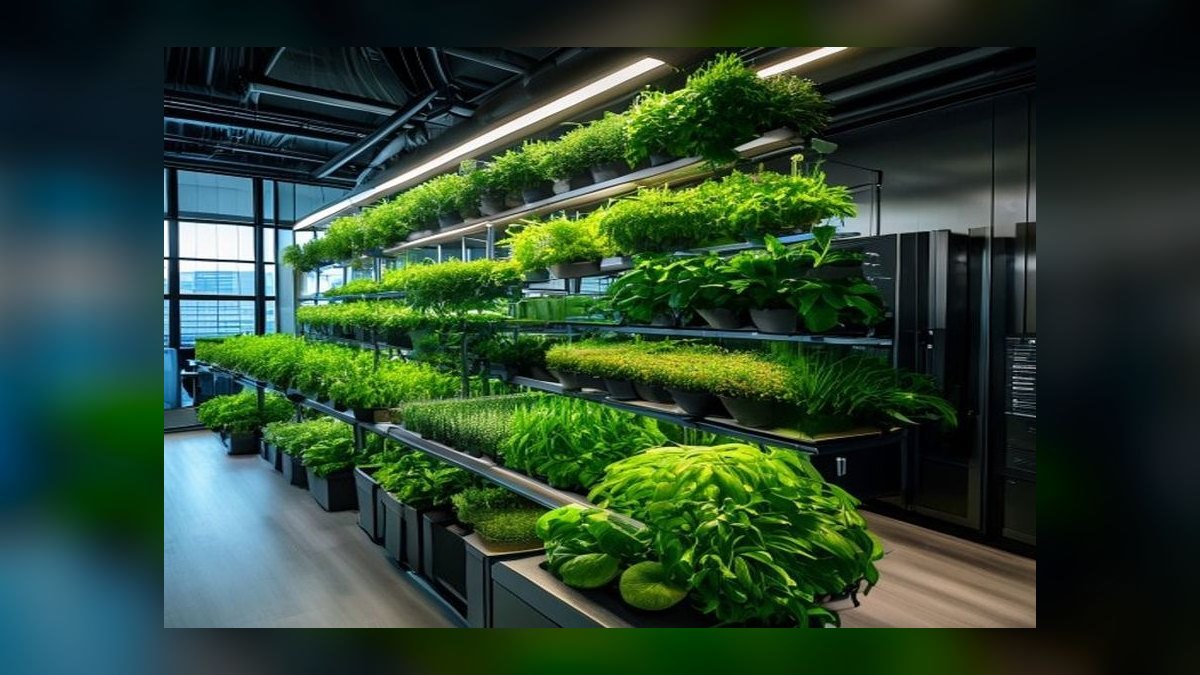
Contracted offtake coverage ranks first because it is the only sales metric that can still be acted on before the tray is planted. It measures committed volume divided by forecast harvest for the same SKU and week, reported on rolling 4-, 8-, and 13-week forward windows. Mature operations target 80% or more committed before planting, leaving 15% to 20% open for spot sales and sampling.
It is built for sales leaders and boards at fixed-cost farms where energy runs 25% to 40% of operating cost and unsold harvest becomes compost. It trades away the comfort of revenue reporting, which only confirms a decision made weeks earlier. Compared to revenue per square foot directly below, coverage is forward-looking and actionable; revenue per square foot is the lagging confirmation.
2. Revenue Per Square Foot KPI

Revenue per square foot of grow space ranks second because it ties commercial performance back to the balance sheet asset. Measured on active grow-canopy area across all tiers, planning ranges commonly land around $120 to $300 per square foot annually, with leafy greens and herbs at the lower-to-middle end and strawberries or branded packaged salads at the top.
It suits operators and investors evaluating asset productivity, but it trades away timeliness: the number is a lagging confirmation of planting decisions made two months prior. Compared to contracted offtake coverage above, it cannot be acted on before harvest. Compared to capacity utilization below, it captures price and mix, not just whether racks are full.
3. Capacity Utilization KPI

Capacity utilization ranks third because it shows whether fixed grow space is actually producing saleable output. Sustained utilization of 90% or better is the working target, with the residual accounted for by planned sanitation, crop transitions, and R&D trials. Above 95% for extended periods is usually a warning, not a triumph, because sanitation cycles get skipped.
It is built for grow and operations leaders running multi-tier rack systems, and it trades away margin context: planting a low-margin SKU into every open tray produces a beautiful utilization chart and a worse P&L. Compared to revenue per square foot above, utilization is a volume metric; the two must be read together or the mix decision is made blind.
4. Contract Renewal Rate KPI
Contract renewal rate ranks fourth because it measures whether the committed base survives past its initial term. Targets run 85% or better, and the leading indicator of a non-renewal is almost always fill-rate deterioration two to three months before the renewal window opens. Buyers rarely announce dissatisfaction; they quietly dual-source and then decline to renew.
It is built for account management and sales leadership at farms with 12-to-24-month contract terms. It trades away early warning: by the time renewal rate moves, the account relationship has already degraded. Compared to average contract value directly below, renewal rate measures durability of the base; ACV measures its size, and a large account that churns is worse than a small one that stays.
5. Average Contract Value KPI
Average contract value ranks fifth because it sizes both the sales team and the facility's account math. Annualized ACV commonly ranges from roughly $40,000 for an independent grocer or single restaurant group up to $250,000 or more for a regional chain or institutional foodservice account. A facility needing $6M committed means roughly 24 accounts at $250K or 150 accounts at $40K.
It is built for sales leaders and finance teams doing headcount and coverage planning. It trades away channel context: distributor-sourced volume typically carries 10 to 20 points less margin than direct accounts, so a high ACV through distribution may be worth less than a lower direct one. Compared to renewal rate above, ACV is a sizing metric, not a durability metric.
6. Price Premium Versus Field KPI

Price premium versus field produce ranks sixth because it measures how well sales has communicated supply-chain predictability rather than negotiating on cost per pound. Sustained premiums of roughly 15% to 40% over comparable field-grown equivalents are the working range, with specialty greens and herbs in dense urban markets at the top and bulk lettuce at the bottom.
It is built for pricing and commercial leaders at farms selling on consistency, spec, and 52-week delivery windows. It trades away durability: the premium erodes quietly through case-deal concessions, freight absorption, and promotional allowances, so it must be measured net of all of those, not off the rate card. Compared to average contract value above, premium measures price quality, not account size.
7. Customer Acquisition Cost KPI
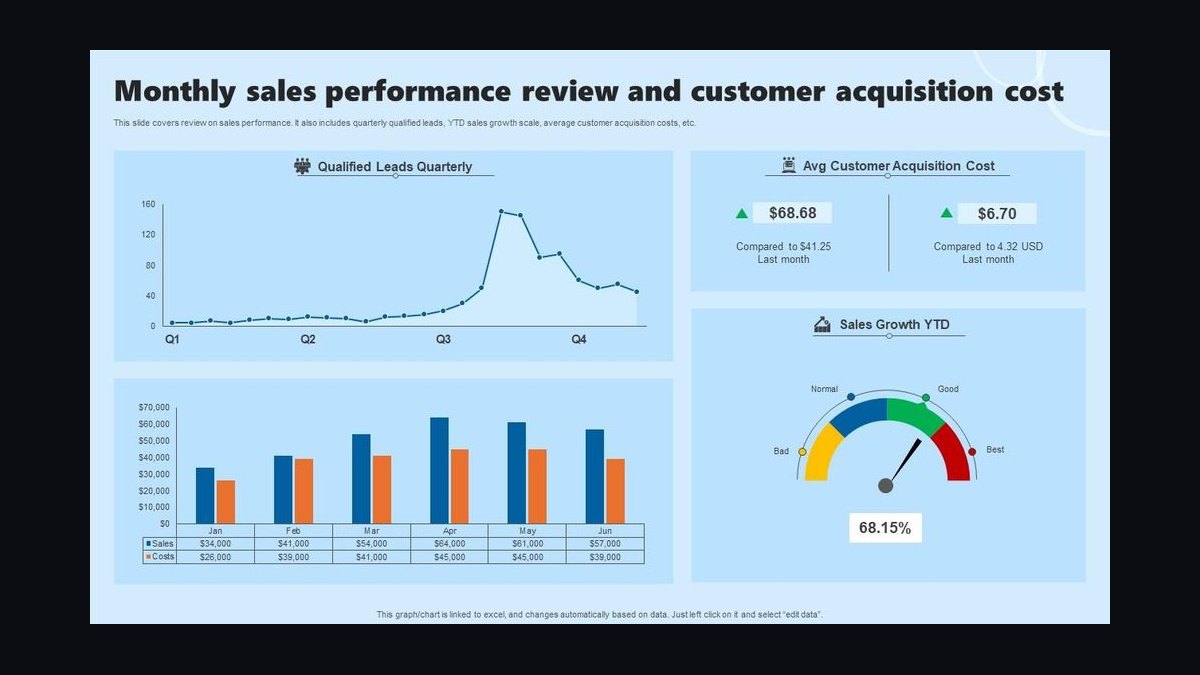
Customer acquisition cost ranks seventh because it determines whether the sales motion is economically repeatable. Loaded CAC, fully burdened with sales salary, travel, samples, trade show spend, and marketing allocation, should generally sit under 15% of first-year contract value, with payback inside 6 to 12 months of gross profit. A 3:1 LTV:CAC ratio is the floor for a healthy motion.
It is built for sales operations and finance leaders planning channel and geographic expansion. It trades away speed: judged as a raw dollar figure, CAC looks terrible when sales cycles run 45 to 120 days, so it must be read on payback period instead. Compared to price premium above, CAC measures cost to win; premium measures price realized after winning.
8. Order Fill Rate KPI
Order fill rate ranks eighth because it is a sales metric disguised as a logistics metric. Targets run 98% or higher, and below 95% you are actively training a buyer to dual-source. A single short-shipped week can cost a shelf placement that took nine months to win, and the miss needs to route to the account owner the same day with a reason code.
It is built for account managers and fulfillment teams at farms where perishability compresses the recovery window to a 10-to-16-day shelf life. It trades away root-cause clarity unless every miss carries a reason code: yield shortfall, quality rejection, logistics, or customer-side change. Compared to customer acquisition cost above, fill rate protects the base; CAC builds it.
9. Yield Consistency KPI

Yield consistency ranks ninth because it defines what the sales team is allowed to promise. Cycle-to-cycle variance under 8% is what lets sales commit firm volume; variance above roughly 8% to 10% forces reps to sandbag commitments, which structurally caps coverage no matter how hard they prospect. It belongs on the sales dashboard, not just the grower's.
It is built for sales and grow leadership jointly, because the corrective action sits with the grow team while the commercial consequence lands on sales. It trades away short-term flexibility: freezing new firm commitments when variance exceeds 10% protects renewals but slows bookings. Compared to order fill rate above, yield consistency is the upstream cause; fill rate is the downstream symptom.
10. Deal Cycle Length KPI

Deal cycle length ranks tenth because it sets the pipeline forecast's honesty. Plan on 45 to 120 days from qualified conversation to executed agreement, with small independent accounts closing in under 30 days and large retail or institutional accounts routinely running past 120. The gating items are third-party food-safety audits, insurance review, EDI onboarding, and a category-review calendar that may open twice a year.
It is built for sales managers forecasting quarterly bookings at farms selling into grocery and foodservice. It trades away comparability across segments: a blended average hides that institutional deals move on a calendar the rep does not control. Compared to yield consistency above, deal cycle length shapes pipeline timing; yield consistency shapes whether signed volume can actually be delivered.
How we ranked these
We ranked the ten sales KPIs by weighting four factors: direct impact on fixed-cost recovery, actionability inside a weekly cadence, data availability from systems farms already run, and whether the metric predicts renewal risk rather than merely describing past revenue. Contracted offtake coverage carried the heaviest weight because it is the only number that can still change a planting decision.
We deliberately ignored generic SaaS and field-agriculture benchmarks, gross revenue totals, social-media engagement, and any metric requiring data most vertical farms do not instrument. We also excluded vanity utilization figures and list-price premium, since both can look healthy while realized economics deteriorate. Crop-specific yield-per-tray rankings were dropped because they vary too widely by system design to compare across operations.
What to look for
When choosing between these KPIs, match the metric to your binding constraint. A farm with low coverage and high utilization needs commitment metrics, not efficiency metrics. A farm with stable coverage but falling renewals needs fill-rate and service-recovery tracking. Buy or build the smallest system that surfaces your actual constraint weekly, and insist on per-zone and per-SKU segmentation rather than facility-wide averages.
The mistake most buyers make is adopting a full enterprise dashboard suite before definitions are settled. They license software, import messy contract PDFs, and end up reporting a revenue-per-square-foot number nobody trusts because footprint and canopy area were mixed. Fix the denominator, decompose contracts into weekly committed cases, and instrument fill-rate reason codes first. Tooling is the last step, not the first.
Related questions
How is contracted offtake coverage actually calculated?
Divide committed volume by forecast harvest volume for the same SKU and week, counting firm contractual commitments only. Report it on rolling 4-, 8-, and 13-week forward windows so a near-term cliff cannot hide behind a strong current month. Indicative or handshake volume belongs in a separate pipeline line and should never be folded into the headline coverage figure.
Should revenue per square foot use facility footprint or canopy area?
Canopy area across all rack tiers is the more defensible operational metric because it reflects the productive asset. Facility footprint is the better investor-facing number since it ties directly to lease and debt service. Report both, label each clearly on the dashboard, and never switch definitions between reporting periods without restating prior figures.
What sales headcount does a vertical farm actually need?
Work backward from average contract value. A facility needing $6M in committed annual revenue requires roughly 40 accounts at $150K ACV or 150 accounts at $40K, and those demand completely different team structures. Add reps only after coverage stalls with a full pipeline, because adding headcount against unstable yield simply accelerates fill-rate misses and renewal losses.
Why does yield consistency belong on a sales dashboard?
Yield consistency defines what the sales team is allowed to promise. Cycle-to-cycle variance above roughly 8% to 10% forces reps to sandbag commitments, which structurally caps coverage no matter how strong the pipeline looks. When variance spikes, the correct commercial response is freezing new firm commitments until the biology stabilizes, not prospecting harder.
How do you measure price premium without fooling yourself?
Measure net realized price per case delivered, not rate card. Subtract freight absorption, promotional allowances, shrink credits, case-deal discounts, and any rebates before comparing against field-grown equivalents. A 30% list premium can quietly become an 8% realized premium through back-door concessions, and only the net number tells you whether the value proposition is actually holding.
What is a healthy contract renewal rate for a vertical farm?
Target 85% or better on annualized committed volume. The leading indicator of a non-renewal is almost always fill-rate deterioration two to three months earlier, which is why renewal rate and order fill rate belong side by side on the same dashboard view. A falling renewal rate with healthy coverage means the forward number is about to break.
How long should a vertical farm deal cycle realistically run?
Plan on 45 to 120 days from qualified conversation to executed agreement. Independent grocers and single restaurant groups can close under 30 days. Large retail and institutional accounts routinely exceed 120 because gating items are third-party food-safety audits, insurance review, EDI onboarding, and a category-review calendar that may only open twice a year.
What utilization level should a vertical farm actually target?
Sustained utilization around 90% is the working target, with the residual absorbed by sanitation, crop transitions, and trials. Above 95% for extended periods is usually a warning sign rather than a triumph, because it typically means sanitation cycles are being skipped. That shows up six to twelve weeks later as pathogen pressure and a yield-consistency collapse.
FAQ
What is the single most important sales KPI for a vertical farm in 2027?
Contracted offtake coverage, measured as committed volume divided by forecast harvest volume on a rolling forward window. It is the only metric that tells you today whether next month's harvest already has a home. A farm running 60% coverage is not sitting on 40% upside; it is quietly burning 40% of its fixed cost base.
Why is revenue a poor primary metric for vertical farm sales teams?
Revenue is a lagging confirmation of a planting decision made roughly two months earlier. By the time revenue misses, the harvest is already unsellable and the product has a ten-to-sixteen-day shelf life. Bookings-to-forecast is the metric that can still be acted on, because it changes what goes into the tray next week.
How should customer acquisition cost be judged in this sector?
Loaded CAC, including salary, travel, samples, trade shows, and marketing allocation, should generally sit under 15% of first-year contract value with payback inside 6 to 12 months of gross profit. Against a typical 12-to-24-month contract with renewals, a 3:1 LTV-to-CAC ratio is the floor for a healthy motion.
What order fill rate should a vertical farm commit to contractually?
Target 98% or higher on promised lines delivered. Below 95% you are actively training a buyer to dual-source, and a single short-shipped week can cost a shelf placement that took nine months to win. Every miss needs a reason code routed to the account owner the same day, not just an operations log entry.
How do you avoid over-concentrating the offtake base?
Set explicit guardrails and report them alongside coverage. A reasonable rule is that no single account exceeds roughly 25% to 30% of committed volume and no single channel exceeds about 40%. A farm hitting 85% coverage with two accounts has not de-risked; it has simply transferred its risk to a counterparty.
What does a healthy average contract value range look like?
Annualized ACV commonly runs from roughly $40,000 for an independent grocer or single restaurant group up to $250,000 or more for a regional chain or institutional foodservice account. That spread is what sizes the sales team, because filling a facility needing $6M committed means very different hiring plans at each end.
How long does it take to stand up a working KPI system?
Realistically six to twelve weeks. Two to three weeks on metric definitions and the CRM contract object, three to four weeks instrumenting fulfillment reason codes, then a full quarter of running the weekly cadence before trend lines are trustworthy enough to make planting decisions against. Skipping the definition phase is the usual cause of failure.
Why does channel mix matter more than gross revenue by channel?
Distributor and partner-sourced volume typically carries 10 to 20 points less margin than direct accounts, but also lower CAC and steadier volume. Teams measuring only gross revenue by channel over-rotate toward whichever channel books fastest, which is usually the worst unit economics. Report contribution margin by channel or the mix decision is blind.
What should trigger a pricing review rather than more prospecting?
Coverage below roughly 75% at the 8-week forward mark, combined with high utilization, signals speculative planting rather than a pipeline problem. The correct response is a pricing and mix review plus shifting trays to firm-demand SKUs, not adding sales headcount against capacity that is already full and unsold.
How do multi-site vertical farm operators avoid masking a failing site?
Report every metric per site before rolling it up. A strong site will hide a failing one in the blended average, and corrective actions are site-specific. The same rule applies to mixed crop systems: a hydroponic leafy-green zone and a vertical strawberry zone should never share a single revenue-per-square-foot line.
Sources
- https://www.ers.usda.gov/topics/farm-economy/
- https://www.ams.usda.gov/services/local-regional/food-supply-chain
- https://www.fda.gov/food/food-safety-modernization-act-fsma
- https://www.energy.gov/eere/buildings/lighting-standards
- https://www.nrel.gov/buildings/
- https://www.cdc.gov/food-safety/
- https://www.bls.gov/iag/tgs/iag445.htm
- https://www.gao.gov/products/gao-24-105610
Related on PULSE
- [More sales kpis for commercial hydroponic vertical farm operations rankings and buying guides](/knowledge)
- [PULSE Tools and calculators](/tools)
- [Everything on PULSE RevOps](/)
This page will be disappearing soon. Save it to your device for $1 — or read it free while it is here.
@Kory-White- · if Venmo asks, the last 4 of my number are 2012
This page is gone.
This one is off the shelf now. $1 keeps it on your phone for good — the whole page, pictures and diagrams included.
 pulse-industry-kpisTop 10 Sales KPIs for Commercial Fire & Water Damage Restoration in 2027
 pulse-industry-kpisTop 10 Sales KPIs for Commercial Sound Masking & Acoustic Systems in 2027
 pulse-industry-kpisTop 10 Sales KPIs for Fire Protection and Life Safety Systems in 2027
 pulse-industry-kpisTop 10 Sales KPIs for Skincare DTC Brand in 2027
 pulse-industry-kpisTop 10 Sales KPIs for Theme Park and Attraction Operations in 2027
 pulse-industry-kpisTop 10 Sales KPIs for Cyber-Insurance Carriers in 2027
 pulse-industry-kpisTop 10 Sales KPIs for Shopify Plus Merchant in 2027
 pulse-industry-kpisTop 10 Sales KPIs for Industrial Robotics Integration in 2027
 pulse-industry-kpisTop 10 Sales KPIs for Commercial Window & Curtain Wall Manufacturing in 2027
 pulse-industry-kpisTop 10 Sales KPIs for Auto Loan and Auto Finance in 2027