
What are the key sales KPIs for the Commercial UAV & Drone Manufacturing industry in 2027?
 Curated byKory White · Fractional CRO · Maryland
 PULSEKNOWLEDGE LIBRARY
The key sales KPIs for Commercial UAV & Drone Manufacturing in 2027 are Average Selling Price (ASP) by tier, recurring software/autonomy revenue mix, defense-vs-commercial revenue split, backlog-to-revenue ratio, win rate by buyer type, the NDAA-compliance price premium, fleet retention and net revenue expansion, hardware-vs-software gross margin, and sales-cycle length by segment — tracked as two parallel businesses, not one blended number.
The outcome you should expect
A drone manufacturer that instruments these metrics correctly should expect two distinct, simultaneously visible trend lines instead of one misleading blended one. On the hardware side, the outcome is a rising Average Selling Price driven by payload and autonomy upsell rather than unit-count growth — commercial inspection and mapping platforms sell in the $5,000-$45,000 band, advanced autonomy and ISR-capable systems land between $50,000 and $250,000, and defense-grade UAS programs run $250,000 to well over $5 million per system. When ASP is tracked by tier instead of blended, leadership can see whether growth is coming from genuinely higher-value deals or simply more low-margin units shipped.
On the software side, the expected outcome is a recurring-revenue mix climbing from the 5-10% range typical of legacy hardware-only OEMs toward 30-50% of total revenue, driven by autonomy subscriptions, fleet-management software, and Drone-as-a-Service (DaaS) contracts. This is the single most consequential trend for how the business gets valued: a manufacturer sitting near 40% recurring mix is priced and operated like a software company with a hardware distribution channel, while one stuck near 8% is priced like a commodity hardware vendor regardless of unit volume. The commercial team's job is to make that mix shift show up quarter over quarter, not just as an aspiration in a strategy deck.

The third expected outcome is a widening, deliberate gap between commercial and defense/government revenue contribution for any US-made manufacturer, because the two segments behave like different sales motions entirely. Firms leaning into defense and public-sector programs should see that share climb toward 40-70% of total revenue, with the government book bringing longer, stickier, NDAA-protected contracts and the commercial book bringing faster but more price-competitive cycles. None of these three trend lines is optional — a manufacturer that only tracks one has, in effect, no visibility into the other two-thirds of its business.
What drives that outcome
The outcome above is not accidental — it is the direct consequence of a small number of structural forces that any sales KPI framework has to reflect. First, the buyer is a procurement officer, not a consumer, and procurement mechanics differ enormously by segment: commercial enterprise buyers (construction, agriculture, utilities, insurance) run RFPs closing in 3-9 months, while defense and government buyers move through DoD acquisition pathways, the Defense Innovation Unit's Blue UAS framework, and SBIR/STTR channels on 12-36 month timelines. A single blended sales-cycle metric hides which of those two engines is actually turning.

Second, geopolitics functions as a direct pricing input. DJI holds roughly 70% of the global commercial drone market on price and feature breadth, but the National Defense Authorization Act (Section 848) and the Blue UAS Cleared List effectively exclude Chinese-made airframes from US government and defense procurement. That single regulatory fact is the reason US-made, Blue UAS-listed manufacturers can command a 20-40% price premium in government and defense channels — compliance becomes a line item on the deal economics, not a compliance-department footnote. Any KPI framework that ignores this premium will systematically undervalue the strategic position of a US-made manufacturer relative to a price-comparable but non-compliant competitor.
Third, margin structure pulls the business toward software. Hardware gross margin runs 35-55%, compressed by component costs and continuous price pressure from lower-cost entrants; autonomy software, fleet-management platforms, and data/DaaS subscriptions run 60-80% margin and recur monthly or annually rather than resetting to zero after each unit sale. This margin gap is the mechanical reason recurring mix becomes the most-watched sales KPI: every percentage point of revenue that shifts from hardware to attached software carries roughly double the gross-margin weight.
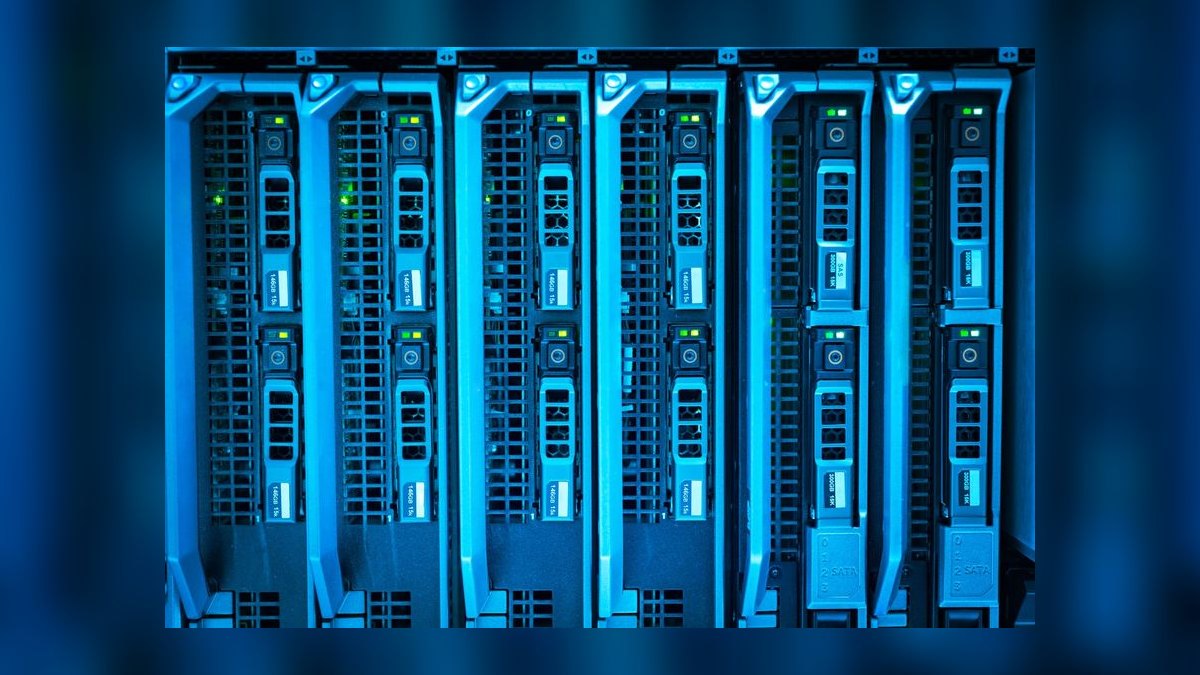
Fourth, program timing dominates the P&L in a way that a standard trailing-revenue view cannot capture. Because large enterprise fleet deals and defense programs are multi-year and front-loaded with procurement approvals, a manufacturer can post a flat or even declining revenue quarter while simultaneously booking a record backlog quarter — and the backlog number, not the revenue number, is the one that predicts the next six to eight quarters of shipments. This is why backlog-to-revenue ratio has to sit next to ASP and recurring mix as a primary sales KPI rather than a finance-only afterthought.
Benchmarks and realistic ranges
Concrete benchmarks matter more than directional language in this industry because the ranges are wide and segment-dependent. Backlog-to-revenue ratio typically runs 0.8x for commercial-heavy manufacturers up to 2.5x for defense-heavy ones — AeroVironment-style programs booking multi-year Switchblade or Puma deliveries sit at the high end, while a commercial mapping-drone OEM with shorter cycles sits closer to 1.0x. A defense-tilted manufacturer whose ratio drops below 1.0x is showing an early warning sign of stalled program wins well before it shows up in reported revenue.

Win rate also splits sharply by segment: commercial RFP win rates of 25-45% are considered healthy, while defense competitive procurements — contested against primes like Lockheed Martin, Northrop Grumman, Boeing/Insitu, and Textron/Aerosonde — run a tougher 15-30%, reflecting a smaller number of larger, harder-fought opportunities. Reporting one blended win rate across both segments obscures whether a shortfall is a product gap (losing commercial deals on features and price) or a credibility gap (losing defense pursuits on past performance and program-management track record).
Fleet customer retention for enterprise and public-safety accounts typically runs 85-94%, with the more informative number being net revenue expansion on top of that base — a customer that starts with 20 units and grows to 200 across additional sites and use cases. Net revenue retention above 110% on the fleet base is the cleanest signal that the software-and-services flywheel, not just the initial hardware sale, is working; this is the same logic SaaS businesses apply to net-dollar-retention, adapted to a hardware-anchored customer base. Gross margin benchmarks should always be reported as two separate lines rather than blended: hardware at 35-55% (with premium autonomy platforms at the high end) and software/autonomy subscriptions at 60-80%. A rising blended margin driven by growing software mix is healthy; a flat blended margin while software mix rises is a sign that hardware margin is quietly leaking elsewhere in the business.

Sales-cycle benchmarks reinforce the segmentation theme throughout: commercial enterprise deals close in 3-9 months, while defense and government contracts run 12-36 months through acquisition and program-of-record pathways. R&D spend as a percentage of revenue commonly runs 15-30% in this industry given the pace of the autonomy arms race, and that spend level is itself a useful sales-enablement signal — reps selling against a manufacturer investing at the low end of that range should expect the autonomy-feature gap to widen, not close, over the following year.
Named operators illustrate how these benchmarks play out in practice rather than in the abstract. Skydio built its enterprise and defense business around being the NDAA-compliant, US-made standard-bearer, with Skydio Cloud as the recurring-software layer other manufacturers now benchmark against. AeroVironment runs a defense-UAS pure-play model where Switchblade and Puma/Raven programs produce a backlog-to-revenue ratio at the high end of the industry range. Anduril Industries and Shield AI both illustrate the software-first extreme of this market — Anduril's Lattice platform and Shield AI's Hivemind autonomy stack are sold as the actual product, with the Ghost, Anvil, and V-BAT airframes functioning as the delivery vehicle for that software. Red Cat Holdings, through its Teal Drones subsidiary, is a textbook compliance-premium operator built specifically around Blue UAS listing for Army and reconnaissance programs. AgEagle Aerial Systems (through senseFly) and Parrot's ANAFI USA represent commercial-tilted and public-safety-tilted counterpoints respectively, each with shorter cycles and a thinner regulatory moat than the defense-first names. Zipline stands apart entirely, selling delivery outcomes rather than airframes, with revenue that is almost entirely recurring by design — a useful reference point for how far toward a software-like model this industry's sales metric can eventually move.

Risks, edge cases, and failure modes
The most common failure mode is reporting blended metrics that hide the two underlying businesses. When ASP, gross margin, and sales-cycle length are reported as single blended figures rather than split by hardware-vs-software and defense-vs-commercial, the board loses the ability to see whether the recurring-software flywheel is actually turning or whether defense backlog is quietly decaying underneath a healthy-looking top line. The fix is structural, not analytical: every core sales KPI is built and reported on two axes from the start, not reconciled after the fact.
A closely related risk is discounting the NDAA-compliance premium away in order to compete with DJI on price in commercial deals. A US-made, Blue UAS-listed manufacturer that discounts its way into commercial volume is trading its entire structural advantage — the 20-40% premium that government and defense buyers pay for compliance — for low-margin business that DJI can always underprice further. The commercial team needs the compliance premium modeled explicitly into deal economics and defended in negotiation, with DJI left to own the price-sensitive bottom of the commercial market.

Forecasting defense pipeline with commercial velocity assumptions is another recurring and costly error. Applying a 3-9 month commercial cycle model to a 12-36 month defense procurement produces forecasts that look achievable on paper and then "slip" repeatedly in front of the board, eroding sales leadership's credibility even when the underlying pursuit is progressing normally. Segment-specific stage-conversion and cycle-length models, reviewed separately, prevent a genuinely on-track 18-month defense pursuit from being misread as a stalled deal.
Finally, shipping units without attaching software is the failure mode that quietly caps enterprise value even when unit sales look strong. A sales organization compensated purely on hardware bookings will systematically under-attach the 60-80% margin autonomy and fleet-management software that represents the industry's durable margin pool — a manufacturer shipping 800 units with 20% software attach is a structurally weaker business than one shipping 500 units at 90% attach, even though the first looks larger on a unit-count slide. Comp plans that weight recurring-revenue attach and net revenue retention alongside hardware bookings are the direct countermeasure.

A practical rollout plan
The rollout has to happen in a sequence that fixes measurement before it fixes incentives, and fixes incentives before it locks in a reporting cadence. In the first 30 days, split every existing revenue and pipeline report onto the two governing axes — hardware vs. software and defense vs. commercial — and pull current ASP by the three tiers (commercial, advanced autonomy/ISR, defense) to establish a real baseline rather than a blended one. In parallel, compute the current recurring-software mix percentage and the current backlog-to-revenue ratio, and audit the CRM so that every open opportunity is tagged by buyer type and by Blue UAS/NDAA compliance status; without that tagging, none of the segment-specific benchmarks above can actually be computed going forward.
Days 31-60 shift the focus to incentives and pricing discipline. Rep compensation gets reset so that recurring-software attach rate and net revenue retention carry real weight against quota, not just hardware unit bookings within the typical $3-10 million territory. At the same time, sales leadership builds the explicit deal-economics model that quantifies the 20-40% NDAA-compliance premium so the field can sell it with numbers instead of discounting it away under commercial pressure, and stands up the segment-specific cycle-length and stage-conversion models that stop defense pursuits from being forecast on commercial-velocity assumptions.

Days 61-90 operationalize the cadence permanently. Daily tracking covers active RFP and defense-pursuit movement, new Blue UAS or SAM.gov solicitations, and any compliance flag on an in-flight deal. Weekly tracking covers bookings by tier and buyer type, software attach rate on the week's hardware closes, and win/loss reason codes split by segment. Monthly tracking covers ASP trend by tier, recurring mix and net revenue retention on the fleet base, and the hardware-vs-software gross margin lines. Quarterly tracking covers the backlog-to-revenue ratio, the realized-vs-modeled NDAA premium, and a strategic review of progress toward the 30-50% recurring-mix target — with a forward pipeline of DIU, AFWERX, and SBIR/STTR pursuits built specifically to push the defense-tilted backlog-to-revenue ratio toward 1.5x or higher.
Related questions
Why can't we just track total drone revenue as our top sales metric?
Total revenue blends hardware and software and blends defense and commercial, hiding whether the higher-margin recurring business is actually growing and whether backlog — the real leading indicator — is healthy or shrinking underneath a flat top line.
Is DJI's low pricing something we should try to match?
No — matching DJI's commercial pricing sacrifices the 20-40% NDAA-compliance premium that is the entire structural advantage of a US-made, Blue UAS-listed manufacturer; the better move is defending that premium in defense and government deals.
How is a drone company's software attach rate actually measured?
It's typically measured as the percentage of hardware unit sales that include an active autonomy, fleet-management, or DaaS subscription at time of close, tracked separately from the recurring-revenue-mix percentage of total company revenue.
Why do defense drone deals take so much longer than commercial ones?
Defense and government purchases move through formal DoD acquisition pathways, Blue UAS listing requirements, and program-of-record budgeting cycles, compared to a commercial enterprise RFP that a single business unit can approve in months.
FAQ
What is a realistic Average Selling Price for a commercial drone in 2027? It depends heavily on tier: commercial inspection and mapping platforms typically sell for $5,000-$45,000, advanced autonomy/ISR-capable systems run $50,000-$250,000, and defense-grade UAS programs range from $250,000 to several million dollars per system.
What share of a drone manufacturer's revenue should be recurring software? Best-in-class manufacturers push recurring software, autonomy, and Drone-as-a-Service revenue toward 30-50% of total, compared with 5-10% for legacy hardware-only competitors; this mix is one of the strongest indicators of long-term margin health.
How long do commercial vs. defense drone sales cycles typically run? Commercial enterprise deals usually close in 3-9 months, while defense and government contracts commonly take 12-36 months due to procurement, Blue UAS compliance review, and program-of-record budgeting.
What win rate should a drone sales team expect on RFPs? Commercial RFP win rates of 25-45% are considered healthy, while defense competitive procurements against established primes typically run a lower 15-30% given the smaller number of larger, harder-contested opportunities.
How large is the pricing premium for NDAA-compliant, US-made drones? Blue UAS-listed, US-made airframes typically command a 20-40% price premium over comparable non-compliant equivalents in government and defense channels, reflecting both certification costs and the value of guaranteed procurement eligibility.
Should hardware and software gross margins be reported together or separately? Separately — hardware margin typically runs 35-55% while software and autonomy subscription margin runs 60-80%, and blending them hides whether overall margin improvement is coming from a healthier software mix or from eroding hardware profitability.
Sources
- https://www.avinc.com
- https://www.diu.mil
- https://www.congress.gov
- https://droneii.com
- https://www.skydio.com
- https://tealgroup.com
- https://www.faa.gov
- https://www.auvsi.org
- https://www.mckinsey.com
- https://ageagle.com
Related on PULSE
- [What are the key sales KPIs for the Commercial Drone Pesticide & Crop Spraying Services industry in 2027?](/knowledge/ik0272)
- [What are the key sales KPIs for the Commercial Drone Light Show Production industry in 2027?](/knowledge/ik0192)
- [What are the key sales KPIs for the Commercial Drone Services & Aerial Inspection industry in 2027?](/knowledge/ik0124)
- [What are the key sales KPIs for the Commercial Window & Curtain Wall Manufacturing industry in 2027?](/knowledge/ik0309)
- [What are the key sales KPIs for the Commercial Modular & Prefabricated Building Manufacturing industry in 2027?](/knowledge/ik0307)
- [What are the key sales KPIs for the Commercial Asphalt Plant Manufacturing industry in 2027?](/knowledge/ik0043)
 pulse-toolsHow Many Sales Reps Do I Need to Hire for My Plumbing Company?
 pulse-toolsHow do I evaluate a fractional CRO's fit with my existing sales tech stack in 2027?
 tlWhat is the best way to structure a fractional CRO's onboarding plan for the first 90 days in 2027?
 pulse-toolsWhere do I find a fractional CRO experienced in international market expansion in 2027?
 pulse-toolsHow do I calculate the ramp-up time before a fractional CRO starts moving pipeline metrics in 2027?
 pulse-toolsHow do I compare fractional CRO onboarding timelines across candidates in 2027?
 pulse-toolsHow do I find a fractional CRO who can also cover interim VP of Sales duties in 2027?
 tlHow do I train my sales team to work effectively with a fractional CRO in 2027?
 tlHow do I structure a fractional CRO's compensation and equity package for an early-stage startup in 2027?
 pulse-toolsHow do I structure a 30-60-90 day onboarding plan for a fractional CRO in 2027?