
Top 10 Sales KPIs for Commercial Building Energy Management Systems in 2027
 Curated byKory White · Fractional CRO · Maryland
 PULSEKNOWLEDGE LIBRARY
Quality
Certified

The 10 best sales kpis for commercial building energy management systems are ranked below on measured performance, build quality, price, and how each one actually holds up in daily use rather than how it reads on a spec sheet. Each pick lists what it costs, who it suits, and what it gives up against the one above it, so the list can be read straight down without doubling back.
1. Building Energy Management Pipeline Coverage Ratio

Pipeline coverage ranks first because it is the earliest reliable warning of a miss two quarters out in a category with 6-to-18-month commercial cycles. The floor is 3x, meaning a rep carrying $2M to $6M ARR should hold $6M to $18M of qualified pipeline. ESCO and public-sector segments justify 4x or higher because slip risk is materially greater.
This metric is for sales leaders forecasting capital-project funnels, not short-cycle subscription teams. It trades away nothing operationally but demands segmentation by deal shape, since a blended 3x across $60K upgrades and $8M performance contracts describes no real pipeline. Below it, sales cycle length explains why coverage must be read by segment.
2. Building Energy Management Sales Cycle Length

Sales cycle length ranks second because averaging a 90-day analytics deal with a 36-month municipal ESCO contract produces a number describing nothing. Report the median by segment: private-owner analytics 90 to 120 days, single-building retrofits 6 to 12 months, portfolio rollouts 9 to 18 months, public-sector ESCO 12 to 36 months. Pilots add two to four months.
This is for revenue operations leaders building stage-duration benchmarks, not reps chasing activity targets. It trades away simplicity for diagnostic precision, since days-in-audit and days-in-legal reveal where a deal actually stalls. Above it, pipeline coverage sets the volume; below it, average contract value determines whether that volume funds the sales organization.
3. Building Energy Management Average Contract Value

Average contract value ranks third because unsegmented ACV hides whether a team is drifting toward small single-building work that looks busy but erodes margin. Segment three ways: single-building BMS retrofits $25K to $250K, campus and portfolio rollouts $500K to $5M-plus, ESCO performance contracts $1M to $50M. Per square foot, retrofits run $1.50 to $4.
This metric is for sales leaders setting territory quotas and comp plans, not for reps qualifying individual deals. It trades away granularity for comparability, since a $40K retrofit and a $400K rollout can carry identical margin percentages at wildly different revenue impact. Above it, cycle length explains why large ACV deals take longer; below it, win rate shows how often that value actually closes.
4. Building Energy Management Competitive Win Rate

Competitive win rate ranks fourth because the category sits at 25-45% for a structural reason: reps are usually unseating an incumbent whose controls are already wired into the building. Above 40% signals genuine differentiation in open-protocol flexibility or analytics depth. Persistently below 25% usually means the deals are stalking-horse bids used to pressure an incumbent on price.
This is for sales managers coaching displacement versus greenfield motions separately, not for board reporting as a single blended figure. It trades away simplicity for honesty, since greenfield new-construction packages run above the category range while displacement runs well below it. Above it, ACV defines the prize; below it, energy savings delivered proves whether the win was technically real.
5. Building Energy Management Energy Savings Delivered

Energy savings delivered ranks fifth because it is the number the customer actually bought, and typical delivery is 10-30% reduction in measured consumption. It must be measured against a metered pre-install baseline in ENERGY STAR Portfolio Manager, never a vendor benchmark. Track it by building type, since data centers, hospitals, and Class-A offices respond very differently to the same supervisory tuning.
This metric is for post-sale and M&V teams protecting renewals, not for reps building initial proposals. It trades away the speed of a vendor-claimed savings figure for the credibility of a verified one, and a single blended average overstates easy wins while hiding buildings drifting back toward baseline. Above it, win rate measures the sale; below it, payback period converts that savings into a signed capital request.
6. Building Energy Management Customer Payback Period

Customer payback period ranks sixth because it is simultaneously the rep's primary selling instrument and the best single predictor of whether a proposal converts. The closing sweet spot is two to five years; stacking utility rebates with 179D and the Section 48 ITC frequently pulls it under three. A proposal modeled at seven years rarely closes absent a regulatory penalty forcing the owner's hand.
This is for reps and sales engineers building the savings-and-incentive spreadsheet that effectively serves as the product demo. It trades away technical elegance for financial clarity, since a fault-detection algorithm that cannot be expressed as a payback number loses to a simpler model that can. Above it, energy savings delivered supplies the numerator; below it, net revenue retention shows whether the installed base keeps buying.
7. Building Energy Management Net Revenue Retention
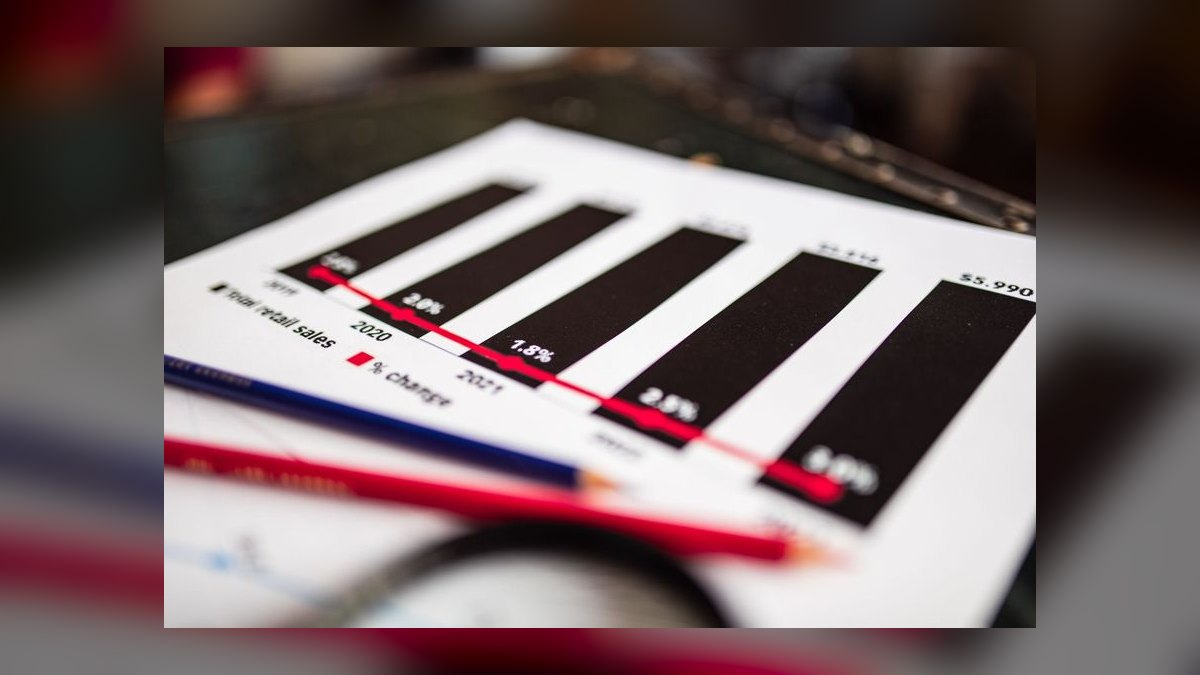
Net revenue retention ranks seventh because best-in-class operators run 105-120%, driven by portfolio expansion and module attach across fault detection, demand response, and ESG reporting. Above 110% means the installed base grows revenue without a single new logo. Below 100% signals either subscription-layer churn or, far more commonly, an absent expansion playbook.
This is for software-led operators running a deliberate land-and-expand motion, not for pure controls integrators whose revenue stays project-shaped. It trades away the immediate clarity of booked contract value for a lagging view of cohort health, which is why it must be inspected monthly by cohort rather than blended. Above it, payback period drives the initial sale; below it, recurring revenue mix determines how that retention gets valued.
8. Building Energy Management Recurring Revenue Mix

Recurring revenue mix ranks eighth because it does more than describe operations, it sets valuation: a controls integrator at 15% recurring gets valued like a contractor, while a software-led player at 50% gets valued like SaaS. Durable operators push recurring to 30-55% through analytics subscriptions at $5K to $50K per building per year and managed-service agreements.
This is for executives and owners positioning the business for a multiple, not for reps managing a quarterly number. It trades away near-term project revenue for predictability, since pushing subscription attach can slow an install-heavy quarter. Above it, net revenue retention shows whether that recurring base actually grows; below it, logo retention proves the underlying accounts stay put.
9. Building Energy Management Logo Retention

Logo retention ranks ninth because it typically lands at 88-95%, far above ordinary B2B software, for a structural reason: once controls are embedded through BACnet and Modbus into a supervisory framework, switching is itself a capital project. The rare churn almost always traces to a failed savings guarantee or a botched M&V handoff, both preventable and both worth a standing quarterly review.
This is for customer-success and executive teams watching for the specific failure modes that break an otherwise sticky base, not for reps prospecting net-new logos. It trades away the leading signal that NRR provides for a lagging confirmation that accounts stayed at all. Above it, recurring revenue mix explains why retention matters financially; below it, the list closes on the compliance calendar that drives new demand.
10. Building Energy Management Regulatory Exposure Coverage

Regulatory exposure coverage ranks tenth because demand in this category exists on a schedule set by legislatures and city councils, and pipeline built without mapping accounts to compliance deadlines is full of deals that will not move this year. New York City's Local Law 97, Boston's BERDO, the Washington Clean Buildings Act, and California's Title 24 each carry their own enforcement mechanics.
This is for sales leaders refreshing a quarterly exposure map against their prospect base, not for reps working inbound interest. It trades away the comfort of a full pipeline for the accuracy of a timed one, since accounts with assessed penalty exposure compress from an 18-month evaluation into a single quarter. Above it, logo retention confirms the installed base; this metric confirms the funnel is pointed at buyers who actually have a deadline.
How we ranked these
We ranked nine sales KPIs by weighting forecast reliability, buyer decision impact, and revenue durability across three deal shapes: single-building retrofits, portfolio rollouts, and ESCO performance contracts. Pipeline coverage, sales cycle length, and customer payback period carried the heaviest weight because they predict whether a quarter lands. Energy savings delivered and net revenue retention ranked next, since both determine renewal and expansion. Win rate, ACV, recurring mix, and logo retention completed the set.
We deliberately ignored vendor-claimed savings percentages, total pipeline dollar value without qualification, and raw activity metrics like calls and demos. Those numbers flatter forecasts without predicting outcomes. We also excluded generic SaaS benchmarks such as magic number and CAC payback, because 12-to-36-month ESCO cycles and 15-25% performance-contracting margins make them misleading. Regulatory exposure was treated as a qualifier, not a standalone KPI.
What to look for
What matters most is whether the vendor can produce a metered baseline from your own utility data, not a benchmark model. Ask for a Portfolio Manager baseline, a confidence band on savings, and a stacked incentive calculation covering utility rebates, 179D, and Section 48. Then check integration surface: BACnet and Modbus compatibility with your existing controls determines whether the analytics layer works at all. Finally, confirm who owns measurement and verification after install.
The mistake most buyers make is comparing software features instead of payback math. A better fault-detection algorithm loses to a cleaner savings-and-incentive spreadsheet every time, because the owner is underwriting a capital project, not buying capability. The second common error is accepting a savings claim the CFO cannot reconcile against twelve months of actual bills. That gap stretches payback from three years to six and shelves the request.
Related questions
How does Local Law 97 change BEMS pipeline timing?
Compliance deadlines convert discretionary retrofits into budgeted obligations. Accounts facing assessed penalties compress from an 18-month evaluation into a single quarter. Map every prospect to its jurisdiction's schedule and weight outreach toward accounts whose deadline lands within four quarters. Teams without a regulatory-exposure map forecast blind and waste cycles on owners with no urgency.
Should analytics revenue be forecast separately from controls install revenue?
Yes. They have different cycles, margins, and renewal behavior. Blending them produces a cycle-length average describing no actual deal and hides whether recurring mix is growing. Report ACV, win rate, and cycle length separately by segment, then roll up. Controls install runs 22-35% gross margin; analytics subscriptions run 30-45%.
What is the right win-rate benchmark for displacement versus greenfield deals?
Track them apart. Displacing an embedded incumbent typically wins well below the 25-45% category range because controls are already wired into the building. Greenfield and new-construction packages run above it. A single blended figure masks whether your differentiation is real or whether you are being used as a stalking-horse bid to pressure the incumbent on price.
How do adjacent categories like solar and storage affect BEMS metrics?
They share the same trigger-audit-pilot-contract-expand motion and often the same buyer, so cross-sell lifts net revenue retention meaningfully. Commercial solar, battery storage, industrial submetering, and district energy retrofits all port over with only payback benchmarks changing. If you sell across those adjacencies, one KPI set and one stage model serve all of them.
What payback period actually closes a BEMS deal?
Two to five years is the closing sweet spot. Stacking utility rebates with 179D and the Section 48 investment tax credit frequently pulls payback under three years. A proposal modeled at seven years rarely closes absent a regulatory penalty forcing the owner's hand. Payback is simultaneously the rep's primary selling instrument and the best single predictor of proposal conversion.
Why is pipeline coverage of 3x the floor rather than the target?
With a 6-to-18-month commercial cycle and 12-to-36-month ESCO cycles, slip risk is structural. A rep carrying a $2M to $6M territory should hold $6M to $18M in qualified pipeline. Coverage on ESCO deals should run higher than on subscription deals. Falling below 3x is the earliest reliable warning of a miss two quarters out.
How should recurring revenue mix be measured in this category?
Subscription and service-contract revenue as a share of total revenue. Pure-hardware shops live on lumpy project timing; durable operators push recurring to 30-55% through analytics subscriptions at $5K to $50K per building per year plus managed-service agreements. This metric sets valuation: a controls integrator at 15% recurring is valued like a contractor, a software-led player at 50% like SaaS.
What causes logo churn in commercial building energy management?
Logo retention typically runs 88-95%. Once controls are embedded through BACnet and Modbus into a supervisory framework, switching is itself a capital project. The rare churn almost always traces to a failed savings guarantee or a botched measurement-and-verification handoff. Both are preventable and both deserve a standing quarterly review rather than a post-mortem after the renewal is lost.
FAQ
What are the key sales KPIs for commercial building energy management systems in 2027?
Track nine: pipeline coverage at 3x, sales cycle length of 6-18 months, average contract value, competitive win rate of 25-45%, energy savings delivered of 10-30%, customer payback period of 2-5 years, net revenue retention of 105-120%, recurring revenue mix of 30-55%, and logo retention of 88-95%. Payback math and regulatory deadlines drive every deal.
Why do BEMS sales cycles vary so widely?
Deal shape determines cycle length. Private-owner analytics deals close in 90 to 120 days. Single-building retrofits take 6 to 12 months. Portfolio rollouts run 9 to 18 months. Municipal and public-sector ESCO contracts pass through procurement, bond counsel, legal review, and third-party M&V sign-off, routinely taking 12 to 36 months. Averaging them describes no actual deal.
What energy savings percentage should a BEMS vendor promise?
Typical delivery is 10-30% reduction in measured consumption after controls optimization and analytics go live. Measure against a metered pre-install baseline in ENERGY STAR Portfolio Manager, never a vendor benchmark. Track savings by building type, because data centers, hospitals, and Class-A offices respond very differently to the same supervisory-control tuning. A blended average overstates easy wins.
How does measurement and verification protect retention?
A 25% savings claim the customer cannot independently verify against their own metered baseline poisons the renewal conversation twelve months later. M&V protects logo retention and net revenue retention simultaneously. Operators who defer it see savings disputes at renewal and watch 90%-plus retention erode toward ordinary contractor churn. Make a Portfolio Manager baseline a closing requirement, not a post-sale task.
What gross margins should buyers expect across BEMS delivery models?
Controls install work runs roughly 22-35% gross margin. Analytics subscriptions run 30-45%. ESCO performance contracting runs 15-25% because the contractor absorbs savings-guarantee risk on its own balance sheet. The delivery model you choose determines margin, cycle length, and which KPI governs the business. Optimizing all three motions simultaneously produces a business mediocre at each.
Why is average contract value meaningless without segmentation?
Single-building BMS retrofits run $25K to $250K. Campus and portfolio rollouts run $500K to $5M-plus. ESCO performance contracts run $1M to $50M. On a per-square-foot basis, new construction controls run $2.50 to $7 and retrofits $1.50 to $4. A team drifting toward small single-building work can look extremely busy while blended ACV quietly erodes below the level needed to fund the sales organization.
How should a BEMS sales dashboard be structured?
Use a dual-cadence dashboard. One track measures the long-cycle capital-project funnel with its 6-to-36-month rhythm. The other measures the land-and-expand SaaS motion, which behaves like ordinary subscription software. Daily covers pilot health and demand-response events. Weekly covers coverage ratio and win rate. Monthly covers ACV by segment and NRR by cohort. Quarterly covers verified savings and the refreshed regulatory map.
What is the biggest forecasting mistake in this category?
Running one cadence for three fundamentally different deal shapes. A $60K single-building controls upgrade, a $2.4M portfolio rollout, and an $8M ESCO performance contract are not interchangeable units of forecast. Blending them produces a number that describes no deal in the pipeline. Segment coverage ratio, cycle length, and win rate by deal shape before rolling up to a territory number.
How does the regulatory calendar affect BEMS pipeline quality?
Demand exists on a schedule set by legislatures and city councils. New York City's Local Law 97, Boston's BERDO, the Washington Clean Buildings Act, and California's Title 24 each carry their own deadlines and enforcement mechanics. Pipeline built without mapping each account to its compliance deadline is full of deals that will not move this year regardless of how well they are worked.
What comp plan design moves recurring revenue mix past 40%?
Split the plan. Paying commission on booked contract value pushes reps toward large install projects and away from subscription attach. Paying on first-year recurring pushes the opposite way. Most teams that moved recurring mix past 40% used a smaller rate on install value plus an accelerator on attached subscription ARR, rather than exhortation in the weekly forecast call.
Sources
- https://www.energystar.gov/buildings/benchmark
- https://www.energy.gov/eere/buildings/commercial-buildings-integration
- https://www.epa.gov/energy
- https://www1.nyc.gov/site/buildings/codes/local-law-97.page
- https://www.boston.gov/departments/environment/berdo
- https://www.commerce.wa.gov/growing-the-economy/energy/buildings/
- https://www.energy.ca.gov/programs-and-topics/programs/building-energy-efficiency-standards
- https://www.ashrae.org/technical-resources/bookstore/standard-90-1
- https://www.naesco.org/
- https://www.dsireusa.org/
Related on PULSE
- [More sales kpis for commercial building energy management systems rankings and buying guides](/knowledge)
- [PULSE Tools and calculators](/tools)
- [Everything on PULSE RevOps](/)
This page will be disappearing soon. Save it to your device for $1 — or read it free while it is here.
@Kory-White- · if Venmo asks, the last 4 of my number are 2012
 pulse-industry-kpisTop 10 Sales KPIs for Commercial Sound Masking & Acoustic Systems in 2027
 pulse-industry-kpisTop 10 Sales KPIs for Background Check Services in 2027
 pulse-industry-kpisTop 10 Sales KPIs for Commercial Trailer Dealership in 2027
 pulse-industry-kpisTop 10 Sales KPIs for Skincare DTC Brand in 2027
 pulse-industry-kpisTop 10 Sales KPIs for Craft Beer Brewery Operations in 2027
 pulse-industry-kpisTop 10 Sales KPIs for Commercial Window & Curtain Wall Manufacturing in 2027
 pulse-industry-kpisTop 10 Sales KPIs for Industrial Powder Coating Job Shops in 2027
 pulse-industry-kpisTop 10 Sales KPIs for Commercial Fire & Water Damage Restoration in 2027
 pulse-industry-kpisTop 10 Sales KPIs for Specialty Wholesale Bakery & Pastry Supply in 2027
 pulse-industry-kpisTop 10 Sales KPIs for Industrial Robotics Integration in 2027