
What are the key sales KPIs for the Cruise Line Operations industry in 2027?
 Curated byKory White · Fractional CRO · Maryland
 PULSEKNOWLEDGE LIBRARY
Cruise line sales performance in 2027 runs on nine metrics: occupancy percentage, net yield per passenger cruise day, net cruise cost excluding fuel per ALBD, ticket-versus-onboard revenue mix, booked load factor, advanced ticket sales, fuel cost as a share of revenue, EBITDA per ALBD, and repeat-guest rate. Berths full, spend per day rising, per-berth profit outpacing capacity growth.
What these metrics are and why cruise economics forces them
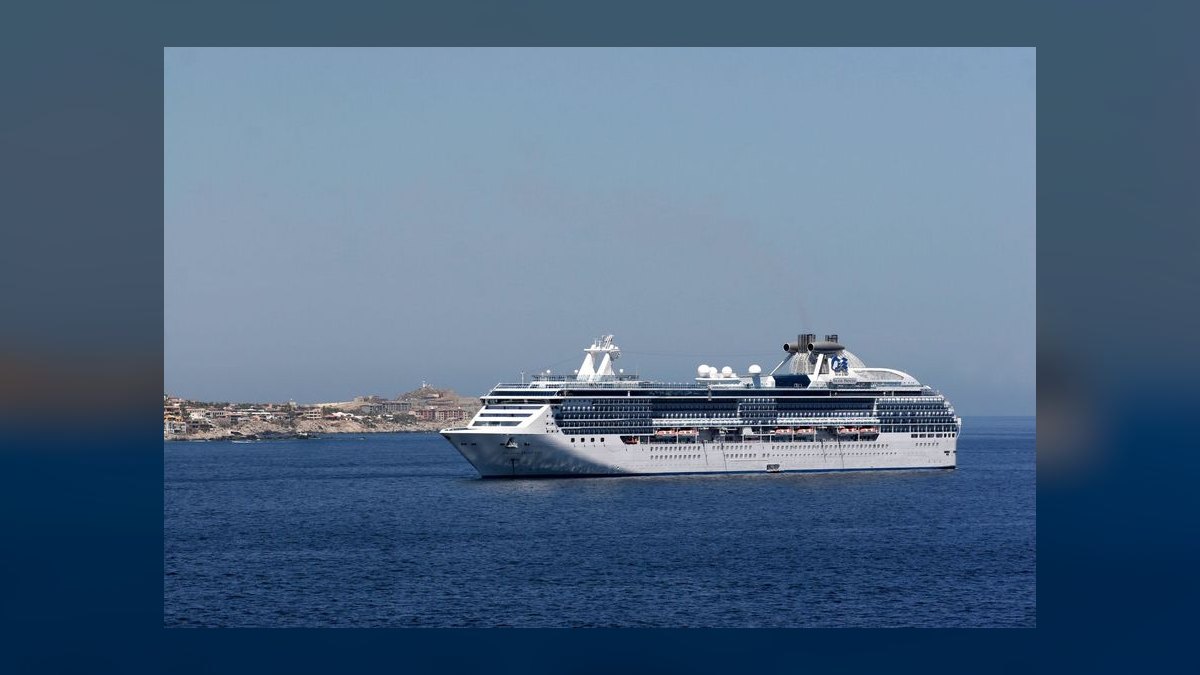
A cruise ship is a fixed asset that costs somewhere between $1.0 and $1.7 billion to build and sails for thirty-plus years. Every berth-night either sails or it evaporates. You cannot warehouse an empty cabin from last Tuesday and sell it next month. That single structural fact — perishable inventory sitting on top of a colossal fixed-cost base — is what separates the Cruise Line Operations industry from almost every other consumer business and explains why its KPI stack looks nothing like a normal SaaS or retail scorecard.
The denominator that makes the whole system legible is the ALBD: Available Lower Berth Day. One lower berth, available for one day. Multiply the ship's lower-berth capacity by days in service and you get the capacity denominator that every serious cruise metric divides by. Revenue per ALBD, cost per ALBD, EBITDA per ALBD — the entire P&L gets normalized against berth-days so a 6,000-passenger Icon-class ship and a 600-passenger Regent vessel can be compared on the same axis. When a cruise CFO says "yields were up 3%," they mean net revenue per capacity day, not gross bookings.
Occupancy above 100% is normal and expected here, which trips up analysts coming from hotels. Because ALBD counts only lower berths — two per cabin — every third and fourth passenger in a quad cabin pushes reported occupancy past 100. Norwegian reported 103.8% occupancy in Q1 2026. Royal Caribbean and Carnival routinely run in the 105–110% band. A number below 100% in a healthy demand environment is not "almost full," it is a pricing failure or an itinerary mismatch, and it should trigger a revenue-management review the same week it appears.

The second structural quirk is the revenue split. Ticket revenue broadly covers the cost of operating the ship — crew, fuel, food, port fees, the whole floating-hotel apparatus. Onboard revenue is where the margin actually prints: beverage packages, specialty dining, shore excursions, casino, spa, internet, photography, retail. Onboard typically runs 30–35% of total revenue at the major operators and carries dramatically better incremental margin, because the marginal cost of selling a second drink package to a passenger already on the ship is near zero. That asymmetry is why the pre-cruise purchase rate has become one of the most-watched leading indicators in the sales stack. Roughly half of Royal Caribbean's onboard revenue is now booked before the guest ever boards, and about 90% of those pre-cruise purchases move through digital channels.
The third force is supply. Royal Caribbean has been taking Icon-class deliveries — Star of the Seas in 2025, Legend of the Seas in 2026. Carnival's Excel class continues. Norwegian's Prima class is mid-rollout. MSC operates the World class, the largest ships in service. Disney is roughly doubling fleet capacity across the Wish, Treasure, and Destiny series. Industry capacity has been compounding in the mid-single digits annually and that pressure runs through 2028. Defending net yield against your own new steel is the central commercial problem of the era, and it is acutely regional: Norwegian alone expanded Caribbean capacity roughly 40% year over year, which is the kind of local supply shock that turns a healthy yield curve into a discount spiral if demand does not show up.
Adjacent industries face echoes of this. Airlines run the same perishable-inventory yield game with RASM and load factor. Hotels run RevPAR against ADR and occupancy. Ski resorts, golf courses, and stadiums all fight the same fixed-cost-versus-variable-demand battle. What makes cruise distinct is the combination: the asset is enormous, the inventory window is 12–24 months long, the guest is captive for 3–14 days once aboard, and the onboard wallet is a second, higher-margin revenue engine that no airline or hotel captures at anything close to the same intensity.

The step-by-step process: from booking curve to EBITDA per ALBD
The operating loop starts eighteen to twenty-four months out. Inventory opens, the revenue-management system loads a price ladder by cabin category and sailing date, and the booking curve begins to fill. Every week thereafter, the yield team compares today's booked position against the same relative day for the prior-year equivalent sailing — same season, same itinerary length, same region. That prior-year-same-day comparison, not the absolute percentage, is the signal. Being 62% booked means nothing on its own; being 62% booked when last year's comparable sailing was 55% at this point, and doing it at a higher average ticket price, is what earnings calls describe as a "record book position."
From the booked load factor the system derives its pricing decision. Ahead of curve at higher price means hold the ladder and push yield. Behind curve means a graduated response — first shift marketing spend and open a targeted loyalty offer, then release upgrade inventory, and only as a last resort cut the public price, because a public discount on a sailing 90 days out teaches the market to wait and damages the ladder for every subsequent sailing on that itinerary.
Once the guest books, the pre-cruise attach engine takes over. Beverage packages, dining, excursions, Wi-Fi, and spa credits get merchandised across email, app, and the manage-my-booking portal. Every dollar captured here is a dollar of onboard revenue de-risked before embarkation, and it is measurably higher-attach than selling the same thing on day two of the sailing. Teams track attach rate per category, revenue per booked guest, and the cumulative pre-cruise onboard revenue per ALBD for the sailing.
Then the ship sails. Passenger cruise days accrue. Ticket revenue recognizes off the deferred balance, onboard revenue accrues in real time, and net cruise cost — crew payroll, food, port charges, fuel, maintenance — runs against it. The output of that arithmetic, divided by ALBD, is the unit-economics scoreboard: EBITDA per ALBD. Everything upstream exists to move that number.

The final leg is reinvestment. EBITDA funds newbuilds, private-destination development, and fleet refurbishment, which in turn creates the capacity and the itinerary refresh that feeds the next booking curve. Loyalty programs close the loop — Crown & Anchor, VIFP, Latitudes, Voyagers — recycling satisfied guests back into the top of the funnel at a materially lower acquisition cost.
Costs, timelines, and the ranges that count as healthy
Occupancy. Passenger cruise days divided by ALBD. Healthy sits in the 103–108% range at contemporary and premium brands; Norwegian posted 103.8% in Q1 2026, and Royal Caribbean and Carnival routinely clear 105%. Luxury and expedition tonnage runs lower by design — smaller ships, fewer third berths, higher ticket price per head. Below 100% in a normal market is a red flag, not a rounding error.
Net yield per passenger cruise day. Net revenue — ticket plus onboard, less travel-agent commissions, air, and other direct variable costs — divided by passenger cruise days. Norwegian reported roughly $278.70 net yield per capacity day in Q1 2026. Royal Caribbean guided full-year 2026 net yields up 2.3–3.3% as reported. The luxury tier operates in an entirely different band, with per-diem all-inclusive pricing that can run several multiples of contemporary. When comparing operators, always check constant-currency versus as-reported; a 100-basis-point FX swing can flatter or bury a yield print.

Net cruise cost excluding fuel per ALBD. The pricing-independent efficiency metric — everything except fuel, normalized per berth-day. Royal Caribbean expected NCC ex-fuel per APCD up roughly 0.5% as reported and approximately flat in constant currency for 2026. Sub-1% growth is excellent discipline. Three percent or more usually means crew payroll inflation, food commodity pressure, or a heavy dry-dock schedule, and it needs a named owner and a recovery plan.
Revenue mix. Onboard at 30–35% of total is the standard band. The direction matters more than the level: onboard mix rising while ticket yield holds flat is a clean margin-health signal, because you are adding high-incremental-margin revenue without buying it with price. Onboard mix rising while ticket yield falls is the opposite — you are discounting the fare to fill berths and backfilling with drink packages, which is a much weaker position.
Booked load factor. Measured as percentage of berths sold for forward sailings, always benchmarked against the prior-year curve. Cadence is weekly, by sailing quarter and by region. The regional cut is not optional in 2027 — a strong consolidated book can hide a soft Caribbean quarter when Alaska and Northern Europe are carrying the average.

Advanced ticket sales. Cash collected for future sailings, carried as a customer-deposit liability until the sailing operates. Carnival, Royal Caribbean, and Norwegian have collectively carried deposit balances in the $15–20 billion range. This is one of the cleanest cash-flow tells in the industry: a rising deposit balance is forward revenue already in the bank, and it typically precedes reported net-yield growth by two to four quarters.
Fuel cost as a percentage of revenue. Bunker fuel typically runs 8–11% of revenue in a normal pricing environment and is the largest exogenous swing factor in the model. The Q2 2026 fuel spike forced Royal Caribbean to lower full-year EPS guidance despite a strong first quarter, and Norwegian and Carnival shares fell in sympathy. Hedging programs commonly cover something like 30–60% of next-year consumption; the exact coverage and the strike levels are disclosed in filings and are worth reading before drawing conclusions from a single quarter's fuel line.
EBITDA per ALBD. Adjusted EBITDA divided by ALBD. Royal Caribbean delivered $7.0 billion adjusted EBITDA in 2025 and guided to double-digit revenue and EPS growth in 2026 on 6.7% capacity growth — arithmetic that implies EBITDA-per-ALBD expansion, which is the actual proof of pricing power. Growth in this metric that exceeds capacity growth means the new steel is accretive. Growth below capacity growth means you are buying revenue with hulls.

Repeat-guest rate. Share of passengers on a sailing who have previously cruised the brand. Best-in-class loyalty programs run north of 50%. Repeat guests spend meaningfully more onboard, cost far less to acquire, and anchor the base load on shoulder-season sailings. The parallel metric — new-to-cruise percentage — is the growth indicator, and the two should be read together. A brand at 70% repeat is loyal but demographically aging; a brand at 20% repeat is growing but has not proven it can retain.
Timelines. Instrumenting this stack properly takes about a quarter. First thirty days: wire the nine metrics across the revenue-management system, the finance ledger, and the operations manifest, then reconcile booked load factor across all three — they almost never tie on day one, and the variance is usually the single most useful finding of the engagement. Days 31–60: build the yield decomposition into ticket versus onboard with pre-cruise attach as a sub-component, identify bottom-quartile itineraries by EBITDA per ALBD, and pressure-test the hedge book against the current bunker forward curve. Days 61–90: rebuild the rolling eighteen-month booking-curve forecast with regional supply overlays for Caribbean, Mediterranean, Alaska, and Asia, then re-model unit economics across the delivery schedule net of planned retirements.
Where teams get it wrong
Reading absolute load factor instead of curve position. The most common analytical error. Eighty percent booked is meaningless without the prior-year comparable, the price at which those berths sold, and the regional mix underneath. Teams that report a single consolidated booked percentage to the board are hiding the only information that matters. Fix: every load-factor report carries three columns — this year, prior year same relative day, and average ticket price delta.

Discounting too early. The revenue-management reflex when a sailing lags is to cut price. It works once. Do it repeatedly on the same itinerary and the market learns the pattern, direct bookings shift later in the curve, and the whole ladder compresses permanently. The disciplined sequence is marketing spend, then loyalty-targeted offers, then upgrade inventory release, then onboard-credit sweeteners that preserve the headline fare, and only then a public price cut.
Leaving pre-cruise attach on the table. Digital pre-cruise penetration below roughly 40% is a structural revenue leak. The passenger will buy some of it onboard anyway, but attach rates are demonstrably lower and basket sizes smaller once the guest is aboard and time-constrained. Every point of pre-cruise attach is high-margin revenue captured early with a cash-flow benefit attached.
Running fuel exposure naked. An unhedged bunker move can swing operating margin by hundreds of basis points inside a single quarter. The failure mode is not the absence of a hedge program — every major has one — it is a hedge book that has quietly rolled off, or coverage concentrated in the wrong fuel grade after a specification change. Review coverage against the forward curve monthly, not annually.
Treating capacity growth as automatically accretive. A $1.5 billion ship joining the fleet grows revenue by construction. Whether it grows EBITDA per ALBD depends entirely on whether it deploys into a region that can absorb the berths at price. The Caribbean supply build is the live case study: multiple operators adding meaningful capacity into the same basin simultaneously, which mathematically requires either demand growth or yield concession. Model new deliveries against regional supply, not just fleet-wide averages.
Debt-service overhang shaping commercial decisions. After the 2020–2022 balance-sheet rebuild, all three majors carried leverage that constrained flexibility. When the orderbook obligates billions in progress payments, the temptation is to chase near-term cash by discounting into softness — precisely the wrong move for the yield ladder. The governance fix is separating capital-structure pressure from revenue-management authority so the deleveraging clock does not drive the pricing decision.
Onboard revenue reported gross instead of net of cost. Casino, spa, and retail are frequently concessioned or revenue-shared. Reporting gross onboard revenue without the concession split flatters the mix and misleads anyone benchmarking against operators who report net. Always confirm the basis before comparing across companies.
Ignoring the manifest-to-ledger gap. Operations counts heads. Finance counts recognized revenue. Revenue management counts sold berths. Three systems, three numbers, and the reconciliation gap is where no-shows, upgrades, comps, crew berths, and group blocks all hide. Nail this down before building any dashboard on top of it.

Decision framework: which metric drives which decision
Not every metric earns a seat at every meeting. The discipline is matching cadence to decision latency — watch daily what you can act on daily, and reserve quarterly reviews for the things that genuinely move on a quarterly clock.
Daily is telemetry: booking volume, web and app traffic, advanced ticket sales inflow, pre-cruise attach by category, and bunker spot. These exist so that a demand break or a pricing error surfaces within twenty-four hours rather than at month-end. Nobody makes a strategic decision off a daily number, but somebody should be looking at it every morning.
Weekly is the operating review: booked load factor by sailing quarter and region against prior year, net yield run rate, repeat-guest mix, and NCC ex-fuel actuals versus plan. This is where pricing actions get authorized. The weekly meeting owns the ladder.

Monthly is the business review: net yield decomposed by brand and itinerary, onboard revenue per passenger cruise day, fuel as a percentage of revenue against the hedge book, customer-deposit balance trend, and newbuild construction milestones. This is where deployment questions get raised — should this ship reposition next season, is this itinerary worth keeping.
Quarterly is the board and street cadence: full P&L by brand, EBITDA per ALBD, forward capacity guidance, and the booking-curve commentary that goes into the earnings call. Quarterly is also when the two-year deployment plan gets revisited against the orderbook.
The choice of *which* metric to optimize depends on where the constraint actually sits. If occupancy is below 100%, nothing else matters — fill the ship, because an empty berth earns neither ticket nor onboard revenue and the cost base is already committed. If occupancy is healthy but net yield is flat, the lever is mix: push pre-cruise attach, upgrade penetration, and premium itinerary weighting. If yield is growing but EBITDA per ALBD is not, the problem is cost — go straight to NCC ex-fuel per ALBD and find whether it is crew, food, port, or dry-dock. And if every unit metric looks fine but consolidated growth is disappointing, the constraint is capacity deployment, which is a two-year decision, not a two-week one.
Related questions
How does cruise yield management differ from airline revenue management?
Both sell perishable inventory on a booking curve, but cruise sells 12–24 months out versus an airline's weeks-to-months, and cruise captures a large second wallet onboard. That means cruise optimizes total revenue per passenger cruise day, not just fare, and can accept a softer ticket price when onboard attach compensates.
What is the difference between ALBD and APCD?
ALBD is Available Lower Berth Days — capacity supplied. APCD, Available Passenger Cruise Days, is used similarly by some operators as the capacity denominator. Passenger Cruise Days measures actual passengers carried times days sailed. Occupancy is PCD divided by the capacity denominator, which is why it exceeds 100% when third and fourth berths fill.
Why do customer deposits matter more in cruise than in hotels?
Cruise collects substantial cash 6–18 months before service, creating multibillion-dollar deferred-revenue balances that fund operations and newbuild progress payments interest-free. Hotels typically collect at or near stay. The deposit balance is therefore both a working-capital engine and a forward-demand indicator unique to the sector's booking window.
Should smaller or luxury operators use the same KPI set?
Yes, with recalibrated bands. Luxury and expedition brands run lower occupancy by design, far higher net yield per day, higher NCC ex-fuel per ALBD, and a much smaller onboard mix because fares are largely all-inclusive. The metrics still apply; the healthy ranges are entirely different.
How do private destinations change the metric picture?
Operator-owned destinations shift shore-excursion and food-and-beverage spend from third parties onto the operator's own P&L, raising onboard revenue per passenger cruise day and improving margin. They also reduce port-fee exposure and give itinerary planners a reliable high-satisfaction call, which supports both repeat-guest rate and yield.
FAQ
What does occupancy percentage really mean in cruise reporting?
It is passenger cruise days divided by available lower berth days. Because the denominator counts only two berths per cabin, third and fourth passengers push the figure above 100%. Contemporary brands commonly run 103–110%. A figure under 100% in normal demand conditions signals mispricing or a weak itinerary rather than merely a lightly loaded ship.
How is net yield per passenger cruise day calculated?
Take total cruise revenue, subtract commissions, transportation, and other direct variable costs to get net revenue, then divide by passenger cruise days. Norwegian reported roughly $278.70 net yield per capacity day in Q1 2026. Always check whether a figure is as-reported or constant-currency before comparing operators or periods.
Why is booked load factor tracked weekly rather than monthly?
Because the booking curve moves continuously and pricing decisions have to be made against it. A weekly read against prior-year same-day lets the yield team act on a demand break within days. Monthly cadence means discovering a soft sailing quarter when there is no longer enough runway to fix it without discounting.
What does net cruise cost ex-fuel per ALBD actually capture?
Everything the operator controls: crew payroll, food and beverage cost, port charges, maintenance, insurance, and shoreside overhead, normalized per berth-day and stripped of fuel volatility. Royal Caribbean expected roughly 0.5% as-reported growth for 2026. It is the cleanest available measure of operating discipline across fleets and vintages.
How much of onboard revenue should be sold before the guest boards?
Roughly half of Royal Caribbean's onboard revenue is now booked pre-cruise, with about 90% of those purchases moving through digital channels. That is the benchmark to aim toward. Penetration meaningfully below 40% usually indicates weak merchandising in the manage-my-booking flow rather than weak guest demand.
What repeat-guest rate should a brand target?
Mature contemporary brands with strong loyalty programs run above 50%. Newer or niche brands sit far lower and should be judged on trajectory instead. Read repeat rate alongside new-to-cruise percentage — a very high repeat rate with low new-to-cruise means the guest base is not being replenished.
Sources
- https://cruising.org/ — Cruise Lines International Association, State of the Cruise Industry
- https://www.sec.gov/edgar/searchedgar/companysearch — SEC EDGAR full-text filings for RCL, CCL, and NCLH
- https://www.rclinvestor.com/ — Royal Caribbean Group Investor Relations
- https://www.carnivalcorp.com/investor-relations — Carnival Corporation & plc Investor Relations
- https://www.nclhltdinvestor.com/ — Norwegian Cruise Line Holdings Investor Relations
- https://www.seatrade-cruise.com/ — Seatrade Cruise News industry coverage
- https://www.cruiseindustrynews.com/ — Cruise Industry News annual report and order book
- https://www.travelweekly.com/Cruise-Travel — Travel Weekly cruise pricing and capacity coverage
- https://www.imo.org/ — International Maritime Organization, fuel and emissions regulation
- https://www.f-cca.com/ — Florida-Caribbean Cruise Association regional impact studies
Related on PULSE
- [Top 10 Cruise Line Revenue KPIs](/knowledge/ik0717)
- [What are the key sales KPIs for the Hotel Brand Operations industry in 2027?](/knowledge/ik0322)
- [What are the key sales KPIs for the Ski Resort Operations industry in 2027?](/knowledge/ik0330)
- [What are the key sales KPIs for the Golf Course Operations industry in 2027?](/knowledge/ik0329)
- [What are the key sales KPIs for the Professional Sports Team Operations (NFL/NBA/MLB/NHL) industry in 2027?](/knowledge/ik0328)
- [What are the key sales KPIs for the Craft Beer Brewery Operations industry in 2027?](/knowledge/ik0332)
 pulse-toolsHow Many Sales Reps Do I Need to Hire for My Plumbing Company?
 pulse-toolsHow do I evaluate a fractional CRO's fit with my existing sales tech stack in 2027?
 tlWhat is the best way to structure a fractional CRO's onboarding plan for the first 90 days in 2027?
 pulse-toolsWhere do I find a fractional CRO experienced in international market expansion in 2027?
 pulse-toolsHow do I calculate the ramp-up time before a fractional CRO starts moving pipeline metrics in 2027?
 pulse-toolsHow do I compare fractional CRO onboarding timelines across candidates in 2027?
 pulse-toolsHow do I find a fractional CRO who can also cover interim VP of Sales duties in 2027?
 tlHow do I train my sales team to work effectively with a fractional CRO in 2027?
 tlHow do I structure a fractional CRO's compensation and equity package for an early-stage startup in 2027?
 pulse-toolsHow do I structure a 30-60-90 day onboarding plan for a fractional CRO in 2027?