
Top 10 Sales KPIs for Auto Loan and Auto Finance in 2027
 Curated byKory White · Fractional CRO · Maryland
 PULSEKNOWLEDGE LIBRARY
Quality
Certified
The 10 best sales kpis for auto loan and auto finance are ranked below on measured performance, build quality, price, and how each one actually holds up in daily use rather than how it reads on a spec sheet. Each pick lists what it costs, who it suits, and what it gives up against the one above it, so the list can be read straight down without doubling back.
1. Originations Volume Auto Finance
Originations Volume ranks first because it is the top-line sales KPI that every other auto finance metric depends on. Ally Financial originated roughly $10.2B in retail auto in Q1 2026, and the metric is reported both as funded unit count and dollar volume. Decomposing it by channel, credit tier, and vehicle type reveals whether growth is healthy or just credit-box expansion. Without sufficient volume, no portfolio can cover fixed servicing and funding costs.
This KPI is for sales leaders, CFOs, and warehouse lenders who need to see booking momentum before credit losses appear. It trades away nothing on its own, but volume without mix discipline is exactly how books blow up two years later. Compared to Managed Portfolio Size directly below, originations measure new business flow while AUM measures the accumulated back book still generating spread.
2. Managed Portfolio Size Auto Finance

Managed Portfolio Size ranks second because it converts origination flow into the recurring interest income that actually pays the bills. Ally carries roughly $84B in retail auto receivables, Capital One's auto book runs near $75B, and Credit Acceptance holds about $8B in net loans receivable. The split between on-balance-sheet and off-balance-sheet ABS-sold receivables reveals the funding model and gain-on-sale exposure.
This metric is for ALCO members, ABS investors, and treasury teams tracking balance-sheet capacity and capital allocation. It trades away near-term growth signal, since AUM lags originations by a full booking cycle. Compared to Net Interest Margin just below, AUM shows scale while NIM shows whether that scale is actually profitable after funding costs.
3. Net Interest Margin Auto Finance

Net Interest Margin ranks third because auto finance is fundamentally a spread business, and NIM is the single number that says whether the model works. Ally's Q1 2026 NIM excluding OID was 3.52%, with full-year guidance of 3.60-3.70%. Banks typically run 3.5-4.5%, while subprime specialists like Credit Acceptance earn far wider gross spreads offset by much higher losses. A 50-basis-point widening in subprime ABS spreads compresses NIM by roughly 30 bps on new originations.
This KPI is for CFOs, ALCO committees, and funding desks who must balance loan yield against warehouse and ABS cost of funds. It trades away credit-quality detail, since a healthy NIM can still hide a deteriorating book. Compared to 30+ Day Delinquency directly below, NIM is the reward metric while delinquency is the risk metric that determines whether that reward survives.
4. 30+ Day Delinquency Auto Finance

30+ Day Delinquency ranks fourth because it is the earliest reliable warning that credit performance is deteriorating. Ally's Q1 2026 retail auto 30+ DPD improved to 4.60% from 5.25% in Q4 2025, signaling the post-pandemic credit cycle is rolling over. The New York Fed reported roughly 5.2% of outstanding auto debt 90+ days delinquent as of Q4 2025. Anything above 5% at 30+ DPD in a near-prime book means elevated charge-offs will print within two quarters.
This KPI is for credit policy teams, collections leaders, and ABS surveillance analysts who need lead time to tighten the credit box. It trades away precision, since early-stage delinquency includes many borrowers who cure without ever charging off. Compared to 60+ Day Delinquency directly below, 30+ DPD is the leading signal while 60+ DPD is the confirmation that the roll rate is real.
5. 60+ Day Delinquency Auto Finance
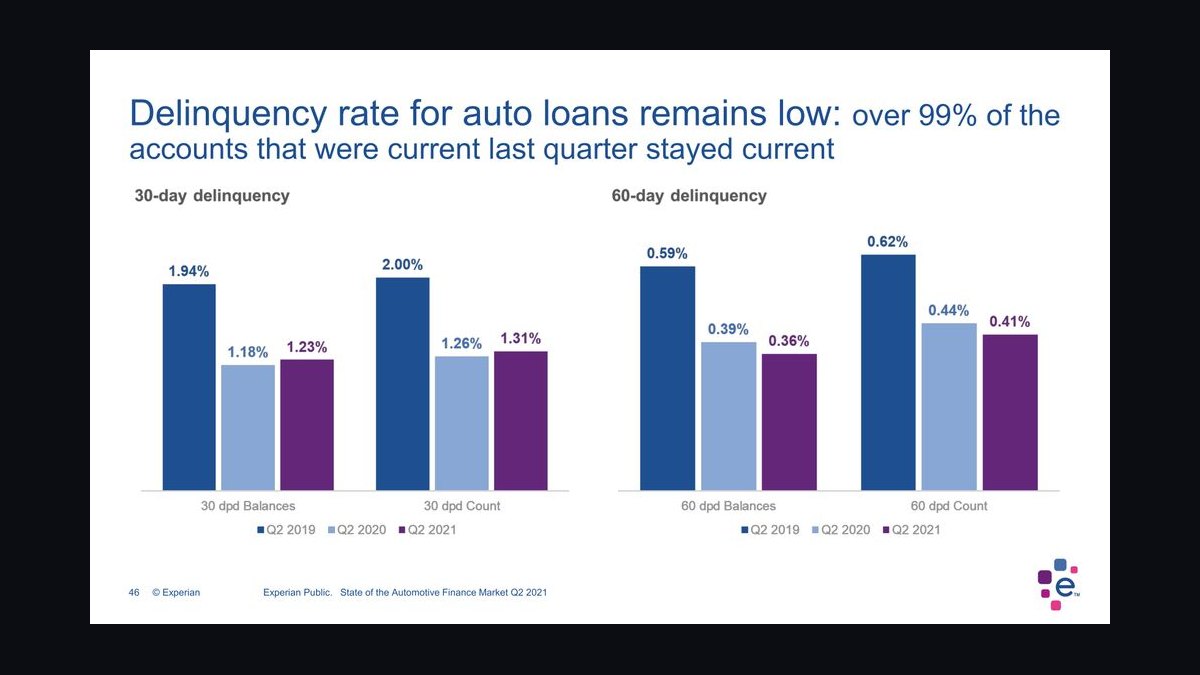
60+ Day Delinquency ranks fifth because it confirms whether early-stage delinquency is curing or rolling toward charge-off. Ally improved to 0.97% at 60+ DPD in Q1 2026 from 1.14% the prior quarter. Subprime auto 60+ DPD hit 6.65% in October 2025, the highest reading since the Fed series began in 1993. The 30-to-60 roll rate, typically 35-45%, is the single best predictor of charge-offs 90 days out.
This KPI is for risk officers, vintage analysts, and warehouse covenant monitors who need to forecast losses before they hit the P&L. It trades away timeliness, since by 60 days past due most workout options have narrowed considerably. Compared to Net Charge-Off Rate directly below, 60+ DPD is a forward-looking predictor while NCO is the realized loss that already happened.
6. Net Charge-Off Rate Auto Finance
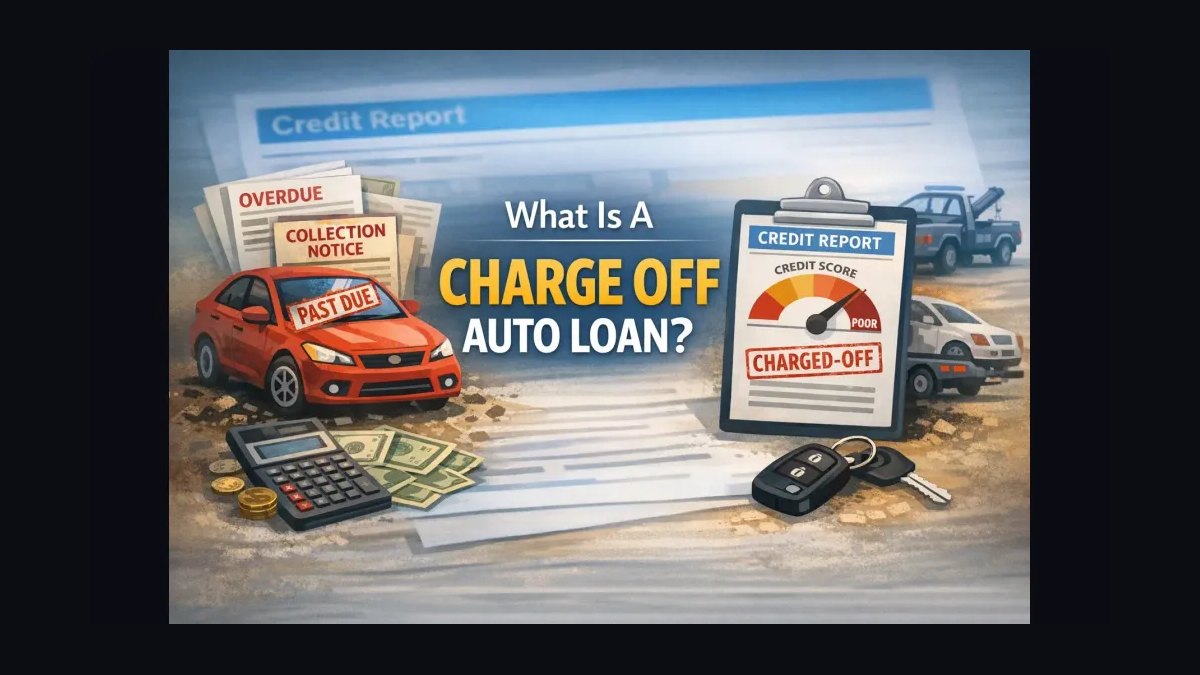
Net Charge-Off Rate ranks sixth because it is the realized loss number that determines whether pricing actually covered credit risk. Ally posted 1.97% NCO in Q1 2026, inside its 1.8-2.0% full-year guide. Prime captives run 0.5-1.0%, near-prime banks 1.5-2.5%, and subprime specialists like Credit Acceptance and Westlake routinely run 6-10% or higher. NCO above guidance two quarters running triggers ABS rating watch and warehouse covenant scrutiny.
This KPI is for CFOs, ABS investors, and credit risk committees who need to validate that pricing tiers match realized losses. It trades away predictive value, since charge-offs are backward-looking and reflect credit decisions made 12-24 months earlier. Compared to Subprime Mix directly below, NCO is the outcome while subprime mix is the input that largely determines future loss rates.
7. Subprime Mix Auto Finance

Subprime Mix ranks seventh because it is the leading input that determines future loss rates across the entire book. Experian's Q1 2026 State of the Automotive Finance Market reported total subprime at 15.75% of vehicle financing, up from 14.40% year over year, with new-vehicle subprime climbing to 6.88% from 5.61%. Every 100 bps of incremental subprime mix adds roughly 25-40 bps of expected portfolio loss.
This KPI is for credit policy committees, pricing teams, and investors assessing risk appetite and growth strategy. It trades away granularity, since FICO bands hide significant variation in borrower creditworthiness within the subprime tier. Compared to Weighted-Average Loan Term directly below, subprime mix measures who you lend to while term measures how long you are exposed.
8. Weighted-Average Loan Term Auto Finance

Weighted-Average Loan Term ranks eighth because term creep silently extends loss curves and inflates negative-equity rollover. The average new-vehicle loan term reached 69.48 months in Q1 2026, used hit 67.73 months, and roughly 30% of new originations now exceed 72 months. Longer terms shrink monthly payments and qualify more buyers but extend cumulative loss curves by 12-18 months. Booking 84-month paper at 72-month spreads inflates volume today and blows out losses two years later.
This KPI is for product managers, pricing analysts, and risk teams balancing affordability against duration risk. It trades away short-term sales volume, since tighter term limits disqualify marginal buyers who need lower payments. Compared to Indirect vs. Direct Origination Mix directly below, term measures loan structure risk while channel mix measures acquisition cost and data quality.
9. Indirect Direct Origination Mix Auto Finance

Indirect vs. Direct Origination Mix ranks ninth because channel determines acquisition cost, data quality, and dealer concentration risk. Ally and Chase Auto run 95% or more indirect through dealer F&I offices, Capital One Auto Navigator pushed direct above 30%, and Carvana Finance and Affirm Auto are 100% direct embedded at checkout. Indirect scales fast but pays dealer reserve of 100-250 bps and depends on rooftop relationships. Direct carries lower acquisition cost and richer borrower data but smaller volume.
This KPI is for sales strategy leaders, dealer relations teams, and digital product managers deciding where to invest acquisition spend. It trades away channel simplicity, since managing both indirect dealer networks and direct digital funnels requires different operating capabilities. Compared to Originations Volume at the top, channel mix explains how volume was sourced while originations volume only counts how much was booked.
10. Look-to-Book Ratio Auto Finance
Look-to-Book Ratio ranks tenth because it measures dealer F&I conversion efficiency, the true sales productivity metric in indirect auto lending. Roughly 75% of US auto originations are booked indirectly through franchised or independent dealers, making dealer finance managers the real customers. Look-to-book tracks how many applications convert to funded loans by rooftop and is the earliest signal of dealer relationship health or deterioration.
This KPI is for dealer relations managers, regional sales directors, and pricing teams managing dealer reserve competitiveness. It trades away portfolio-level insight, since a strong look-to-book says nothing about the credit quality of what was booked. Compared to Indirect vs. Direct Origination Mix directly above, look-to-book measures conversion efficiency within the indirect channel while channel mix measures the split between indirect and direct sourcing.
How we ranked these
We ranked the nine KPIs that actually govern auto finance economics in 2027 by weighting three factors: how directly each metric predicts credit loss or margin compression, how frequently operators and ABS investors act on it, and how hard it is to manipulate or lag. Origination volume, 30+ and 60+ day delinquency, net charge-off rate, and NIM carried the heaviest weight because they drive warehouse covenants and securitization pricing.
We deliberately ignored vanity metrics like total app downloads, dealer satisfaction scores, and gross revenue without loss adjustment, because they do not predict portfolio performance. We also excluded macro forecasts and OEM incentive data, since those sit outside a lender's control. Residual-value opinions and ESG-linked lending targets were dropped for lack of consistent, verifiable industry baselines across prime, near-prime, and subprime books.
Related questions
How does 30+ day delinquency predict net charge-offs in an auto loan book?
The 30-to-60 roll rate typically runs 35–45% in a normal cycle, so a 30+ DPD reading above 4.5% almost guarantees elevated charge-offs 90 days out. Ally's Q1 2026 improvement to 4.60% from 5.25% signaled the post-pandemic credit cycle rolling over. Watch the roll rate, not just the bucket level.
Why does weighted-average loan term matter more in 2027 than it did in 2019?
New-vehicle terms hit 69.48 months in Q1 2026, with roughly 30% beyond 72 months. Longer terms shrink monthly payments but stretch cumulative loss curves 12–18 months and inflate negative-equity rollover at trade-in. A 72-month loan priced at 60-month spreads quietly misprices the back book.
What subprime mix percentage should trigger a credit box review?
Experian's Q1 2026 baseline was 15.75% subprime of total vehicle financing, up from 14.40% YoY. Every 100 bps of incremental subprime mix adds roughly 25–40 bps of expected portfolio loss. If your mix drifts above baseline while the labor market softens, tighten tier cutoffs before charge-offs print.
How do ABS spreads feed back into net interest margin?
Non-bank auto lenders fund through warehouse lines plus quarterly term ABS. A 50-basis-point widening in subprime auto ABS spreads compresses NIM by roughly 30 bps on new originations. That is why finance CFOs watch Fitch's Auto ABS Index more closely than the Fed funds rate when setting pricing.
Is indirect or direct origination better for auto finance sales growth?
Indirect through dealer F&I scales fast but pays 100–250 bps dealer reserve and gives up borrower data control. Direct carries lower acquisition cost and richer data but smaller volume. Capital One pushed direct above 30% via Auto Navigator; Carvana Finance and Affirm Auto are 100% direct at digital checkout.
What recovery rate on repossessed vehicles is considered normal?
Repossession recovery typically runs 50–60% of outstanding principal. Below 45% means the wholesale market is broken. When Manheim values fell roughly 7% from peak in 2024–2025, severity on charged-off loans jumped 300+ basis points industry-wide, which is why loss-given-default tracks wholesale indices, not just FICO.
How should EV residual risk change auto lending KPIs in 2027?
Hertz's 2024 EV writedown showed EV residuals can fall faster than ICE. Captives like Ford Credit and GM Financial now carry EV-specific residual reserves. Lenders should track EV exposure as a separate KPI bucket, cap it explicitly, and stress-test against a 10% Manheim decline before booking long-term EV paper.
What is a healthy net interest margin for an auto finance book?
Banks typically run 3.5–4.5% NIM; Ally's Q1 2026 NIM ex-OID was 3.52% with full-year guidance of 3.60–3.70%. Subprime specialists run wider gross spreads but carry 6–10%+ charge-offs. Trend matters more than level: 30 bps of compression two quarters running is a structural problem, not noise.
FAQ
What is the most important sales KPI for auto finance in 2027?
Originations Volume in units and dollars is the top-line sales KPI because it measures how much new business is booked. Without volume you cannot grow managed receivables or cover fixed costs. But volume alone misleads: pair it with subprime mix, weighted-average term, and dealer concentration or you will book paper that blows up two years later.
How often should auto finance teams track these KPIs?
Track originations and delinquency daily, since they give early warning on both sales momentum and credit deterioration. Review NIM and net charge-offs monthly. Re-baseline subprime mix, weighted-average term, and EV residual exposure quarterly, aligned to ABS issuance and earnings calls, so pricing and credit box changes land before the next vintage books.
What 30+ day delinquency rate signals trouble in an auto loan portfolio?
Above 4.5% at 30+ DPD is a red flag. Ally improved to 4.60% in Q1 2026 from 5.25% the prior quarter, signaling cycle normalization. When 30+ DPD runs above 5% in a near-prime book, net charge-offs typically follow within 60–90 days and can exceed 2.0%, breaking the spread model.
How does subprime mix affect auto finance sales strategy?
Subprime mix, the share of originations below 620 FICO, drives both volume and loss. Experian's Q1 2026 baseline was 15.75% subprime, with new-vehicle subprime at 6.88%. If your mix runs above baseline while the labor market softens, adjust pricing or tighten tier cutoffs before 60+ DPD breaches the 6.65% subprime benchmark.
What net interest margin is healthy for an auto lender?
Below 3.5% NIM generally means the spread between funding cost and loan yield cannot cover credit losses plus operating expense. Banks run 3.5–4.5%; Ally guided 3.60–3.70% for 2026. Subprime specialists run wider gross spreads but absorb 6–10%+ charge-offs. Watch the trend, not just the level.
Why does indirect versus direct origination mix matter for auto finance KPIs?
Indirect through dealer F&I is roughly 75% of US originations and scales fast, but pays 100–250 bps dealer reserve and limits borrower data. Direct carries lower acquisition cost and richer data but smaller volume. Ally and Chase Auto run 95%+ indirect; Capital One pushed direct above 30% via Auto Navigator.
How do you measure dealer concentration risk in auto lending?
Track the share of originations from your top rooftops and their early-default rate. Letting 10% of dealers generate 40% of volume without portfolio caps is a classic failure mode. Santander's $550M CFPB settlement and 2024 dealer fraud cases all traced back to unmonitored concentration. Cap it and monitor monthly.
What recovery rate should auto lenders expect on repossessed vehicles?
Normal recovery is 50–60% of outstanding principal. Below 45% signals a broken wholesale market. When Manheim values fell roughly 7% from peak in 2024–2025, loss severity on charged-off loans jumped 300+ basis points industry-wide. Loss-given-default tracks wholesale indices, not just borrower FICO.
How should EV residual risk change auto lending KPIs in 2027?
Hertz's 2024 EV writedown showed EV residuals can fall faster than ICE. Captives like Ford Credit and GM Financial now carry EV-specific residual reserves. Track EV exposure as its own KPI bucket, cap it explicitly, and stress-test against a 10% Manheim decline before booking long-term EV paper.
What reporting cadence should an auto finance KPI dashboard follow?
Daily: applications, approvals, look-to-book, funded units. Weekly: originations by tier and channel, weighted-average APR and term, dealer concentration, 1–29 DPD. Monthly: 30/60/90 DPD, net charge-offs, recoveries, subprime mix, NIM by vintage. Quarterly: portfolio walk, ABS spreads, EV reserves, CECL adequacy, segment ROE.
Sources
- https://www.federalreserve.gov/releases/g19/current/default.htm
- https://www.experian.com/automotive/state-of-the-automotive-finance-market
- https://www.consumerfinance.gov/data-research/research-reports/
- https://www.newyorkfed.org/microeconomics/hhdc.html
- https://www.fitchratings.com/research/structured-finance/auto-loans
- https://www.ally.com/about/investor/
- https://www.capitalone.com/about/investor-relations/
- https://ir.creditacceptance.com/
- https://www.coxautoinc.com/insights/manheim-used-vehicle-value-index/
- https://www.kbra.com/
Related on PULSE
- [More sales kpis for auto loan and auto finance rankings and buying guides](/knowledge)
- [PULSE Tools and calculators](/tools)
- [Everything on PULSE RevOps](/)
This page will be disappearing soon. Save it to your device for $1 — or read it free while it is here.
@Kory-White- · if Venmo asks, the last 4 of my number are 2012
 pulse-industry-kpisTop 10 KPIs for Auto Repair Shops in 2027
 pulse-industry-kpisTop 10 Sales KPIs for Cyber-Insurance Carriers in 2027
 pulse-industry-kpisTop 10 Sales KPIs for Craft Beer Brewery Operations in 2027
 pulse-industry-kpisTop 10 KPIs for Pilates Studios in 2027
 pulse-industry-kpisTop 10 Sales KPIs for Skincare DTC Brand in 2027
 pulse-industry-kpisTop 10 Sales KPIs for Buy-Now-Pay-Later (BNPL) in 2027
 pulse-industry-kpisTop 10 KPIs for HVAC Contractors in 2027
 pulse-industry-kpisTop 10 Sales KPIs for AI Observability Platform in 2027
 pulse-industry-kpisTop 10 Sales KPIs for AI Video Generation in 2027
 pulse-industry-kpisTop 10 Sales KPIs for Speech-to-Text API in 2027