
Top 10 Sales KPIs for Fraud Detection and AML Software in 2027
 Curated byKory White · Fractional CRO · Maryland
 PULSEKNOWLEDGE LIBRARY
Quality
Certified
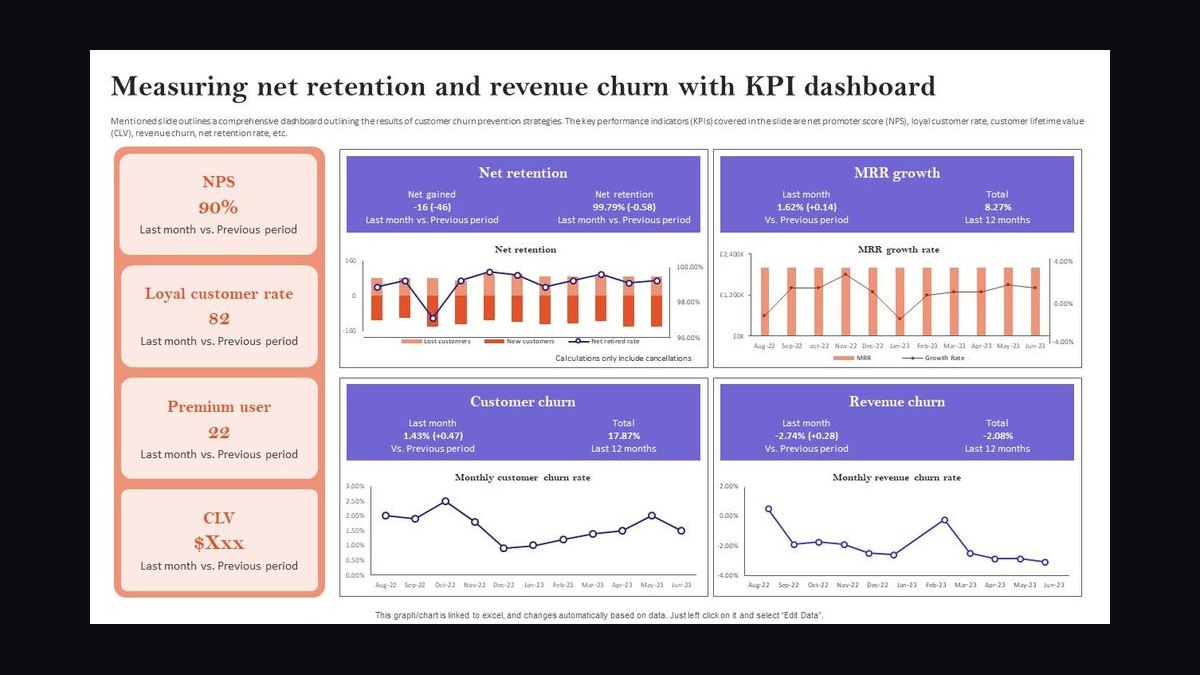
The 10 best sales kpis for fraud detection and aml software are ranked below on measured performance, build quality, price, and how each one actually holds up in daily use rather than how it reads on a spec sheet. Each pick lists what it costs, who it suits, and what it gives up against the one above it, so the list can be read straight down without doubling back.
1. Net Revenue Retention (Fraud/AML)
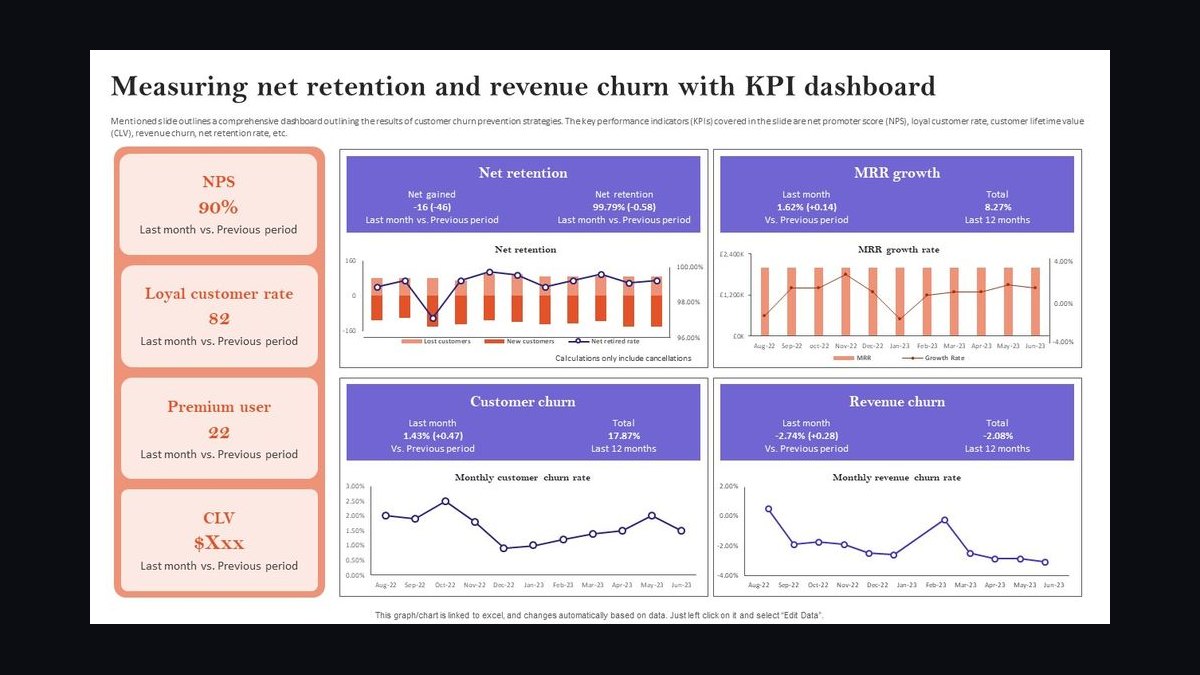
Net revenue retention ranks first because fraud and AML platforms land narrow and expand along transaction volume, additional detection modules, and additional legal entities inside a banking group. Retention above one hundred percent is the clearest signal that detection quality is holding. When retention drops below break-even in an account, investigate model performance first, not account coverage.
This metric is for the CRO and CFO reviewing the book quarterly, not the investigator. It trades away short-term new-logo optics for a harder question: is the installed base actually expanding? Compared to net new ARR directly below, NRR is lagging rather than leading, but it is the single most predictive number for enterprise value in this segment.
2. Net New ARR (Fraud/AML)

Net new ARR ranks second because it is the leading commercial indicator that a fraud and AML vendor is winning bake-offs against incumbent transaction monitoring suites. It captures new logos, module attach, and entity expansion in one figure, which matters when deals land narrow on one rail or geography and grow from there. Without it, NRR is a rearview metric with no forward signal.
This metric is for sales leadership and the board, not the compliance team. It trades away detection-quality nuance for commercial velocity, so it can look healthy while an account's model performance quietly degrades. Pair it with NRR above and per-transaction inference cost below; alone it will mask margin compression at high-volume accounts.
3. Catch Rate at Fixed Alert Budget

Catch rate at a fixed alert budget ranks third because it is the only honest way to report detection performance. A catch rate without the alert budget it was measured at is meaningless, and vendors that publish one without the other get rebuilt from the customer's own case-management exports. Report it as a paired constraint: recall held or improved at a stated alert volume.
This is for the Chief Risk Officer buying loss reduction, and for model validation teams during proof of value. It trades away the flattering single-number headline that marketing prefers. Compared to false-positive rate below, it is the numerator side of the same ratio; the two must ship together or the dashboard argument restarts at every QBR.
4. False-Positive Rate (AML)
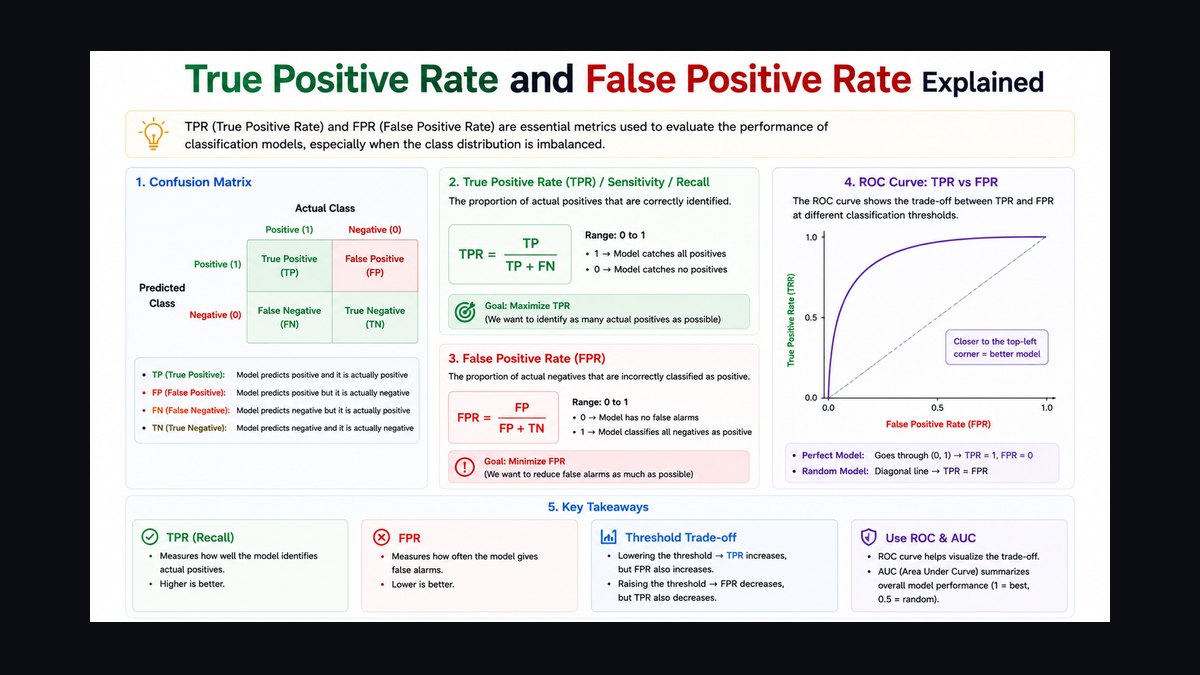
False-positive rate ranks fourth because in AML a false positive costs analyst attention and generates a regulatory artifact that must be dispositioned and defended if an examiner samples it. That downstream cost is regulated, documented, and auditable, which changes the economics of precision versus adjacent security categories. A three-point recall gain that doubles alert volume has made the customer worse off in strict financial terms.
This metric is for the Chief Compliance Officer and the investigator team lead, not the CRO. It trades away raw detection headline numbers for queue health and investigator cost per case. Compared to catch rate above, it is the denominator side of the same ratio; publishing either alone invites tuning that improves the metric and harms the customer.
5. Screening Latency at P95

Screening latency at P95 ranks fifth because latency budgets are set by the payment rail, not by preference. Card authorization decisions live inside a window measured in low hundreds of milliseconds end to end, of which the scoring call gets a fraction. Instant rails including FedNow, RTP, and SEPA Instant settle in seconds and expect screening to complete without perceptibly extending that.
This metric is for platform engineering and the payments product owner, not the compliance buyer. It trades away a single blended latency figure that hides the only number that matters for a given deal. Compared to per-transaction inference cost below, latency is a customer-experience constraint while cost is a margin constraint; a vendor serving three rails needs three separate budgets reported.
6. Per-Transaction Inference Cost
Per-transaction inference cost ranks sixth because a card issuer processing billions of authorizations a year multiplies any per-decision compute cost by a very large number. Tenths of a cent per decision at that volume become a material COGS line. Deep ensembles that win a bake-off can lose the renewal economics because the last increment of recall is often bought with the most expensive layer in the stack.
This metric is for finance and product, not the fraud analyst. It trades away headline model accuracy for gross-margin durability at scale. Compared to screening latency above, cost is nonlinear and compounding while latency is a fixed constraint per rail. Instrument cost per inference by model layer, not in aggregate, or the retirement decision cannot be made when volume scales.
7. SAR Auto-Drafting Adoption

SAR auto-drafting adoption ranks seventh because it measures whether the platform has become the compliance team's daily operating surface or degraded into a system of record they log into only when an examiner asks. In the twelve-to-twenty-four month account window, this is the metric that predicts whether renewal is a formality or a bake-off. Adoption depth beats feature breadth here.
This metric is for customer success and the compliance operations lead, not the CRO. It trades away detection-performance storytelling for operational stickiness evidence. Compared to daily active compliance users per seat below, SAR drafting is the higher-intent signal because it sits inside a regulated workflow with a filing deadline attached. Seat count alone can look healthy while drafting adoption stalls.
8. Daily Active Compliance Users per Seat
Daily active compliance users per seat ranks eighth because seat-based pricing made seat count and DAU-per-seat the natural adoption metrics historically, and they still predict renewal in accounts not yet transitioned to consumption pricing. An account with high seat count and low DAU is a churn risk dressed as a healthy logo. The ratio, not the raw count, is the signal.
This metric is for customer success managers running QBRs, not the CRO. It trades away depth of engagement for breadth of login activity, which is why it sits below SAR auto-drafting adoption. Compared to consumption metrics used in per-transaction pricing, DAU-per-seat loses meaning entirely; vendors mid-transition should carry both families or healthy accounts will look inconsistent on the same chart.
9. Regulator Audit Pass Rate

Regulator audit pass rate ranks ninth because a painful examination that traces to vendor documentation gaps converts a renewal into a rip-and-replace RFP. Supervisory expectations for model risk management, including the US interagency SR 11-7 framework and the FFIEC BSA/AML examination manual, make a bank's use of a third-party detection model itself an examinable control. Documentation currency is a leading indicator of retention.
This metric is for the Chief Compliance Officer and the model validation function, not the CRO. It trades away detection-performance visibility for defensibility evidence that only matters during an exam window. Compared to time-to-produce a full case audit trail, pass rate is the outcome while audit-trail time is the operational input; track both, because the input is what a validator actually asks for.
10. Cases Closed per Investigator Day

Cases closed per investigator day ranks tenth because as case management becomes a bought product rather than a bundled feature, investigator productivity becomes a sales metric rather than an operational one. An investigator's fully loaded cost is knowable, so hours saved converts to dollars without argument. Median time-to-disposition pairs with it as the cleanest value-pricing input available.
This metric is for the fraud operations manager and the buyer constructing a business case, not the CRO. It trades away detection-quality framing for labor-cost framing, which is easier to defend but narrower in scope. Compared to regulator audit pass rate above, productivity is a steady-state operating metric while audit posture is a renewal-window metric; both belong on the dashboard but lead in different quarters.
How we ranked these
We ranked vendors on nine weighted KPIs: net new ARR, net revenue retention, false-positive rate at fixed alert volume, dollars-blocked catch rate, screening latency at P95, SAR auto-drafting adoption, per-transaction inference cost, regulator audit pass rate, and daily active compliance users per seat. Detection quality and audit defensibility were weighted equally because both drive renewal in this category.
We deliberately ignored raw detection counts, seat counts without usage, blended latency averages across rails, and any vendor-reported precision not reconciled to the customer's own case-management exports. We also excluded marketing claims lacking a stated denominator, since catch rate without an alert budget is unverifiable and routinely rebuilt by compliance teams during renewal negotiations.
Related questions
Should catch rate or false-positive rate be the primary sales metric?
Neither alone. Report catch rate at a fixed alert budget, or dollars blocked per investigator hour. A single-sided number invites tuning that improves the metric while harming the customer, and that surfaces at renewal as an alert firehose complaint from the compliance team.
How does consumption pricing change these KPIs?
Seat-based adoption metrics lose meaning. Track transactions screened, entities resolved, and cases opened, with growth rate per account. Carry both metric families during a pricing transition, or healthy accounts will look inconsistent on the same dashboard and reviews will stall.
Why is regulator audit pass rate treated as a revenue metric?
Because a painful examination that traces to vendor documentation gaps converts a renewal into a rip-and-replace RFP. Documentation currency and time-to-produce an audit trail are leading indicators of retention, not compliance overhead, and they belong on the revenue dashboard.
What is the right retraining cadence for fraud models?
It depends on how fast the attack surface moves. Card fraud shifts faster than trade-based money laundering. The requirement is that the cadence is defined, monitored, and reportable to a customer's model risk function, which will ask for exactly that during validation.
How do you compare vendors during a proof of value?
Fix the alert budget and the evaluation period before scoring begins, then measure recall on a held-out window rather than the tuning window. Insist on the customer's own denominators. A vendor that will not publish its denominator is telling you something about the renewal conversation.
What does dollars blocked per investigator hour actually measure?
It is the ratio between detection benefit and operational cost, which is the governing number in this category. It forces both the CRO's loss-reduction scorecard and the CCO's queue-capacity scorecard onto one axis, so neither can be improved by quietly degrading the other.
Why do blended latency numbers hide the metric that matters?
Card authorization, instant payment rails, and overnight batch AML monitoring have completely different latency budgets. A single blended average can look healthy while the one rail in a given deal misses its window, which is the only number the buyer will test.
How should sanctions screening be reported separately from fraud scoring?
Screening is name-and-attribute matching against published lists with strict-liability failure modes. Fraud scoring is probabilistic ranking with tradeoff failure modes. They are tuned differently and reported differently. Averaging their false-positive rates produces a number with no operational meaning.
FAQ
What are the key sales KPIs for fraud detection and AML software in 2027?
Nine numbers dominate: net new ARR, net revenue retention, false-positive rate, dollars-blocked catch rate, screening latency, SAR auto-drafting adoption, per-transaction inference cost, regulator audit pass rate, and daily active compliance users per seat. Detection quality and audit defensibility drive renewal together.
Why can't this industry run on a single north-star metric?
Two buyers hold opposite scorecards. The CRO buys loss reduction; the CCO buys defensibility. Tightening thresholds raises catch rate but floods the alert queue and raises investigator cost per case. Loosening them protects the queue and lets fraud losses climb. The ratio between the two governs.
Why is a false positive more expensive in AML than in endpoint security?
In AML, a false positive costs analyst attention and generates a regulatory artifact: a case file that now exists, must be dispositioned, and must be defensible if an examiner samples it. The downstream cost of noise is regulated, documented, and auditable, which changes the economics of precision.
What alert precision should a buyer realistically expect?
Alert precision in transaction monitoring is low, with most alerts closing without a filing. A credible vendor proposition is meaningful alert-volume reduction at held-or-improved recall, not elimination of false positives. Set targets as paired constraints validated on a held-out period.
How do latency requirements differ across payment rails?
Card authorization decisions live inside a window measured in low hundreds of milliseconds. Instant rails like FedNow, RTP, and SEPA Instant settle in seconds. Batch AML monitoring runs overnight and tolerates minutes. One vendor may need three separate latency budgets.
Why is net revenue retention the most predictive number in this segment?
Platforms land narrow, on one rail or geography, then expand along transaction volume, detection modules, and entities within a banking group. That expansion path is the business model. When retention drops below break-even in an account, investigate model performance first.
When does per-transaction inference cost become a real problem?
At card-issuer volume, tenths of a cent per decision multiply into a material COGS line. Deep ensembles that win a bake-off can lose the renewal economics because the last increment of recall is bought with the most expensive layer. Instrument cost by model layer.
What should a vendor reconcile before publishing any KPI?
Model-serving telemetry, case-management disposition records, and billing usage counts. Common gaps are retries counted as distinct inferences, alerts suppressed downstream but logged upstream, and multi-entity customers billed as one account but monitored as several. Fix definitions first.
What is the biggest mistake buyers make when evaluating these platforms?
Accepting a catch rate without its denominator. If the vendor measures recall on a different alert budget or period than the customer's own exports, that gap becomes the centerpiece of the renewal negotiation. Publish the denominator with the number, every time.
How does model risk management guidance affect vendor selection?
A bank's use of a third-party detection model is itself an examinable control under frameworks like SR 11-7 and the FFIEC BSA/AML manual. The vendor is not the examined entity, but its documentation quality determines how painful the exam is for the customer.
Sources
- https://www.federalreserve.gov/supervisionreg/srletters/sr1107.htm
- https://bsaaml.ffiec.gov/manual
- https://home.treasury.gov/policy-issues/financial-sanctions/specially-designated-nationals-and-blocked-persons-list-sdn-human-readable-lists
- https://www.fatf-gafi.org/en/topics/risk-based-approach.html
- https://www.federalreserve.gov/paymentsystems/fednow_about.htm
- https://www.theclearinghouse.org/payment-systems/rtp
- https://www.ecb.europa.eu/paym/target/target2/html/index.en.html
- https://www.finra.org/rules-guidance/rulebooks/finra-rules/3110
- https://www.occ.gov/news-issuances/bulletins/2021/bulletin-2021-47.html
Related on PULSE
- [More sales kpis for fraud detection and aml software rankings and buying guides](/knowledge)
- [PULSE Tools and calculators](/tools)
- [Everything on PULSE RevOps](/)
This page will be disappearing soon. Save it to your device for $1 — or read it free while it is here.
@Kory-White- · if Venmo asks, the last 4 of my number are 2012
 pulse-industry-kpisTop 10 Sales KPIs for Medical Device OEM in 2027
 pulse-industry-kpisTop 10 Sales KPIs for Shopify Plus Merchant in 2027
 pulse-industry-kpisTop 10 KPIs for Auto Repair Shops in 2027
 pulse-industry-kpisTop 10 KPIs for Bars and Pubs in 2027
 pulse-industry-kpisTop 10 Sales KPIs for Department Store in 2027
 pulse-industry-kpisTop 10 Sales KPIs for LLM API Provider in 2027
 pulse-industry-kpisTop 10 Sales KPIs for AI Translation API in 2027
 pulse-industry-kpisTop 10 KPIs for Hair Salons in 2027
 pulse-industry-kpisTop 10 KPIs for Personal Trainers in 2027
 pulse-industry-kpisTop 10 Sales KPIs for Cannabis Retail Dispensary in 2027