
Top 10 Sales KPIs for GPU Cloud Provider in 2027
 Curated byKory White · Fractional CRO · Maryland
 PULSEKNOWLEDGE LIBRARY
Quality
Certified

The 10 best sales kpis for gpu cloud provider are ranked below on measured performance, build quality, price, and how each one actually holds up in daily use rather than how it reads on a spec sheet. Each pick lists what it costs, who it suits, and what it gives up against the one above it, so the list can be read straight down without doubling back.
1. Committed Capacity Sell-Through

Sell-through ranks first because it determines whether the capital already racked is contractually durable or exposed to spot pricing. A healthy structure puts the majority of available GPU-hours under twelve-month-or-longer commitments, with a deliberate uncommitted remainder for spikes and price discovery. Selling through too completely is its own risk: one large non-renewal leaves idle capacity the on-demand market cannot absorb in 30 days.
This KPI is for CROs and capacity planners at providers running thousands of Hopper- and Blackwell-class accelerators. It trades away short-term headline bookings for forecastable revenue, and it pairs directly with renewal rate below it — sell-through without renewal is just deferred churn. Providers that push sell-through past roughly 90% with no buffer sized to their largest account are running uninsured.
2. Net Revenue Retention GPU Cloud
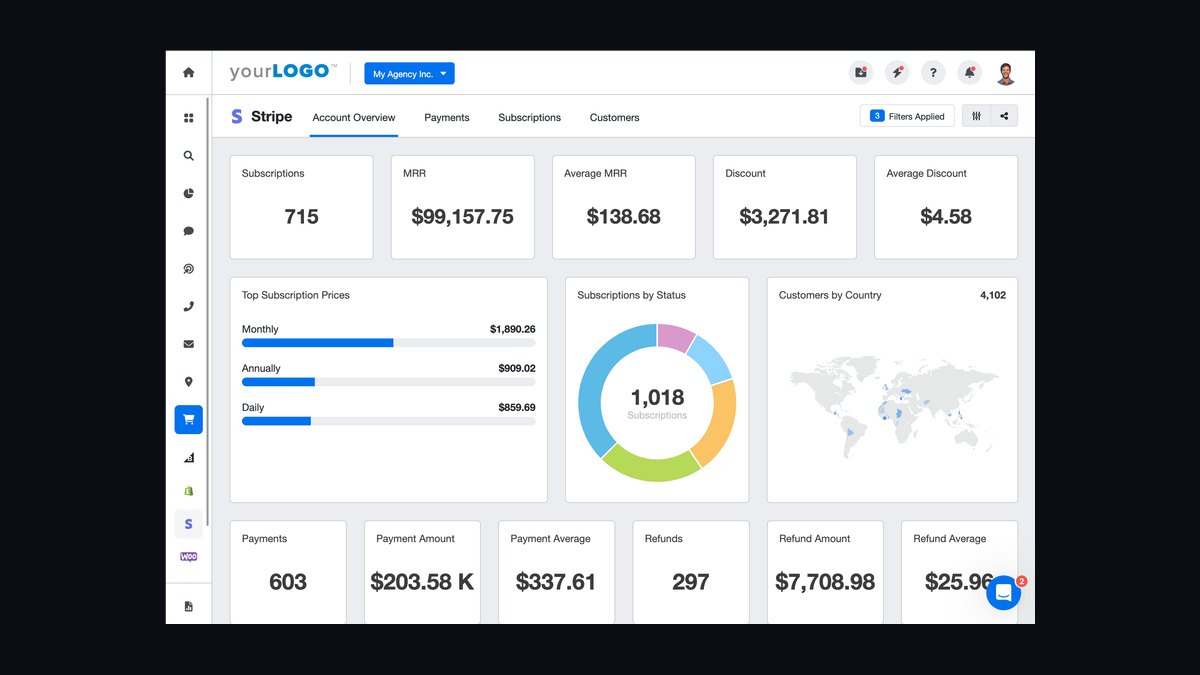
NRR ranks second because it is the compounding metric: a customer training successfully on your cluster trains a bigger model next quarter, and bigger models mean more GPU-hours. Best-in-class AI infrastructure operators cite 140% to 180%, far above SaaS norms. Anything under about 110% signals existing customers are not scaling on your infrastructure, which almost always traces to a capacity or performance constraint rather than a relationship problem.
This metric is for finance and customer-success leaders reporting to the board. It trades away the comfort of gross logo retention — losing one large account while keeping ten small ones produces excellent count-based renewal and a catastrophic revenue outcome. It sits directly below sell-through because expansion cannot happen on capacity that is already committed to someone else.
3. Realized GPU-Hour Price

Realized price ranks third because list price is fiction: discounting, credits, and spot mix erode it invisibly. Published on-demand rates for prior-generation flagship accelerators have sat in the low-to-mid single-dollar range per GPU-hour, with one-year reserved commitments discounting meaningfully and multi-year commitments discounting further. Newest-generation parts command a substantial premium. Track blended realized price monthly by generation and contract type, and watch the trend line, not the absolute number.
This KPI is for pricing and revenue-operations teams. It trades away the simplicity of a published rate card for a segmented view of what each pool actually earns. It ranks below NRR because price only compounds if customers stay — a provider that holds realized price while churn rises is harvesting a shrinking base. Compare it against sell-through to see whether discounting is buying durable commitments or just spot volume.
4. Cluster GPU Utilization

Utilization ranks fourth because it is the most-cited and most-misread number in the segment. Best-in-class is 85% or better on cluster average, but the useful framing is a band: below roughly 70% fixed costs spread over too few billable hours and gross margin compresses fast; above roughly 90% sustained, queue times appear for new job launches. A practical target is high-70s to high-80s, measured hourly and reported as a distribution.
This KPI is for infrastructure and finance leaders jointly. It trades away a single clean headline number for a segmented view by pool and accelerator generation. It ranks below realized price because utilization at a bad price is not revenue — packing inference pools hot is nearly free money, while packing premium training pools hot destroys the renewal base that NRR measures two quarters later.
5. Booked GPU-Hours Per Customer

Booked GPU-hours per customer ranks fifth because its second derivative matters more than its level. Active enterprise accounts commonly run in the thousands to tens of thousands of GPU-hours monthly. A customer whose monthly hours have been flat for two consecutive quarters is not stable — they are a customer whose growth has stopped for a reason nobody has diagnosed. Consumption plateau is the leading indicator; churn is the lagging one.
This KPI is for account teams and sales engineers, not relationship managers. It trades away the reassurance of pipeline reviews for an automated alert routed as a technical investigation. It ranks below utilization because hours consumed only matter if the cluster can serve them — a plateau usually traces to a capacity constraint, a performance ceiling, or a workload that quietly migrated to a competitor.
6. InfiniBand P95 Latency
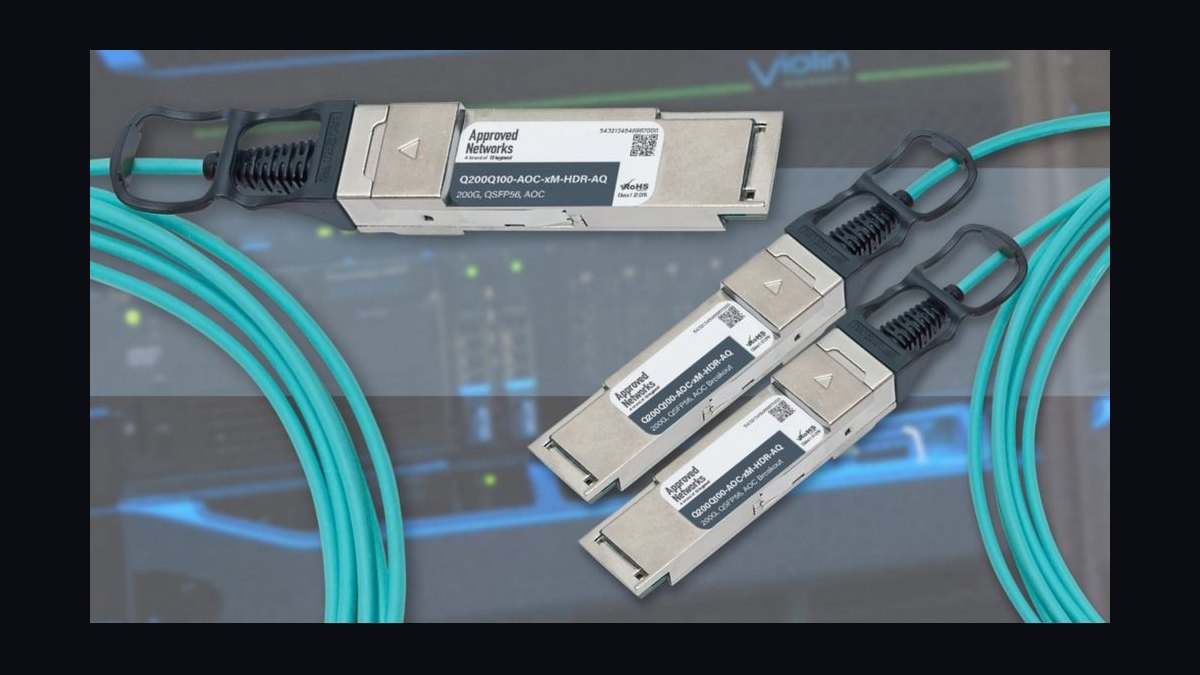
Interconnect latency ranks sixth because it defines the addressable market for each cluster rather than merely describing its health. P95 latency in the low single-digit microseconds is the competitive standard for training-grade clusters on current-generation fabric. A cluster with oversubscribed Ethernet cannot host large distributed training jobs profitably — the job runs measurably slower and the customer notices within one training cycle.
This KPI is for sales engineering and product marketing, and it belongs in the CRM, not only in an infrastructure monitoring stack. It trades away fabric-wide averages for per-job, per-account attribution. It ranks below booked hours because latency degradation typically shows up as a consumption plateau first — customers notice degradation well before they mention it, and by the time they mention it they have usually already benchmarked an alternative.
7. Outage-Free Days Per Quarter

Outage-free days ranks seventh because raw uptime undersells the real risk. A reasonable bar is 88 of 91 days, but a checkpoint-losing failure eighteen hours into a multi-day training run costs the customer far more than the SLA credit is worth. Track incidents weighted by the customer-compute-hours they destroyed, not just by duration, and report that figure alongside uptime so reliability investments get funded against the right target.
This KPI is for SRE and customer-success leadership. It trades away the flattering simplicity of a four-nines headline for a loss-weighted view that changes which engineering work gets prioritized. It ranks below latency because a provider can hit excellent uptime while regularly destroying long-running training jobs through node-level failures that never register as a full outage — the customer experiences both as the same thing.
8. Twelve-Month Renewal Rate

Renewal rate at twelve months ranks eighth because it is the lagging confirmation of everything above it. Above 90% is the target; below 85% and the acquisition cost of replacing lost committed capacity will consume the margin that utilization gains were supposed to produce. Measure it by committed revenue, with contract count as a secondary view — losing one large account and keeping ten small ones produces an excellent count-based rate and a catastrophic revenue outcome.
This KPI is for the CRO and the board. It trades away the illusion of control that a renewal campaign provides: renewal rate is not improved by a renewal campaign, it is improved by fixing queue times and latency two quarters earlier. It ranks below outage-free days because reliability failures are the most common mechanical cause of a non-renewal that the sales organization then misreads as a relationship problem.
9. Net New ARR GPU Cloud

Net new ARR ranks ninth because it is the outcome the other eight KPIs produce, not a lever to manage directly. It cannot be improved by hiring more reps if the accelerator allocation ceiling is already binding — a provider cannot sell its way past its allocation. The practical approach is to forecast from the capacity side first: model billable GPU-hours coming online by month, apply expected realized price by contract type, then compare against pipeline.
This KPI is for the CFO and sales leadership in joint planning. It trades away the quarter-end bookings celebration for a supply-constrained forecast that names the real constraint. It ranks below renewal rate because net new ARR that arrives without renewing the existing base is a treadmill — the acquisition cost of replacing churned committed capacity eats the growth before it reaches gross margin.
10. Capacity Expansion Lead Time
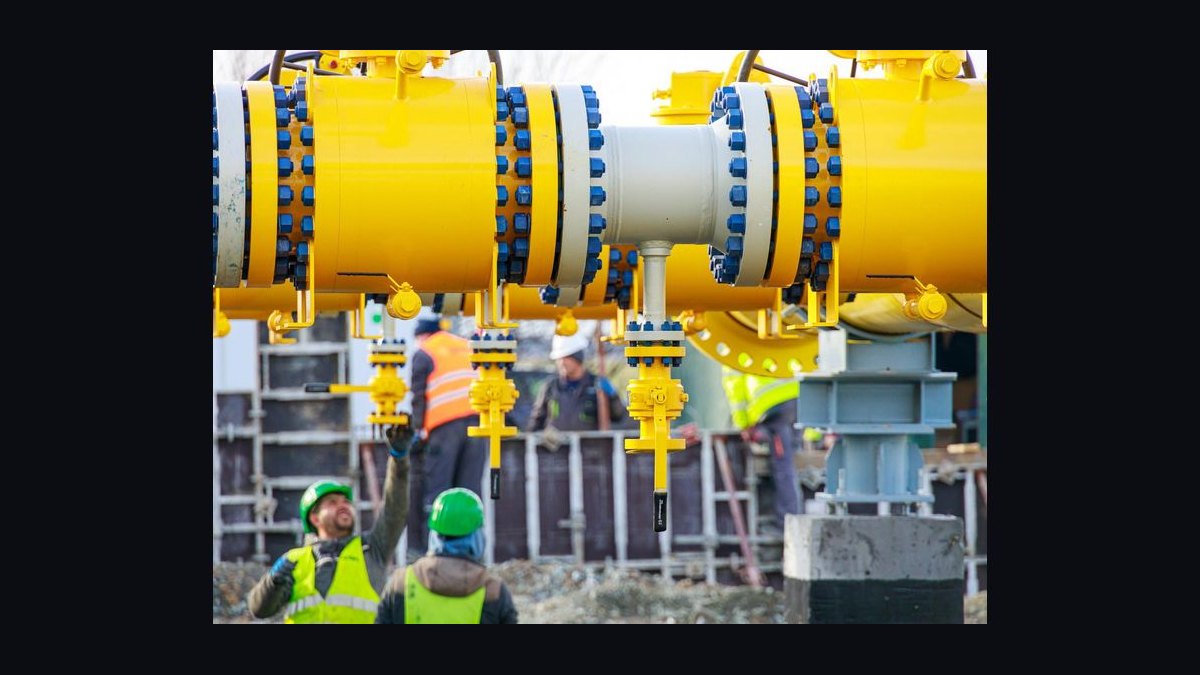
Capacity expansion lead time ranks tenth because it governs how quickly any sell-through or allocation problem can actually be corrected. Measured as weeks from decision to billable GPU, it is the throttle on every other KPI on this list. Building data centers gives control over power, cooling, and expansion timing but consumes capital that could buy accelerators; leasing colocation is faster and lighter but exposes the provider to a landlord's power constraints exactly when expansion is needed.
This KPI is for capacity planning and supply-chain leadership working jointly with sales. It trades away the apparent efficiency of just-in-time expansion for a tracked, forecastable number that tells the commercial team how far ahead to sell. It ranks last because it is an enabler rather than a result — but a provider that ignores it will discover that every other metric on this dashboard is capped by a decision made two quarters ago.
How we ranked these
We ranked nine sales KPIs for GPU cloud providers by weighting commercial impact on committed revenue, renewal durability, and capital efficiency. Net new ARR, net revenue retention, and 12-month renewal rate carried the heaviest weight because they determine whether fixed accelerator and power costs convert into predictable income. Capacity sell-through, realized price per GPU-hour, and cluster utilization followed, since they govern margin and allocation leverage.
We deliberately ignored vanity pipeline metrics, raw bookings, logo counts, and social engagement because they reward short-term spot deals that erode committed revenue. We also excluded generic SaaS benchmarks and vendor-published uptime claims that cannot be verified per account. Interconnect latency and outage-free days stayed in because they directly predict training-customer churn, but we did not weight engineering-only telemetry that never reaches the commercial ledger.
Related questions
Why is net revenue retention more important than new logo count for GPU cloud providers?
NRR captures whether existing customers expand GPU consumption as their models grow. A provider adding logos while NRR sits near 100% is replacing churned committed capacity at high acquisition cost. Expansion-heavy AI infrastructure accounts can push NRR above 140%, making retention the compounding engine. Logo count hides whether the installed base is actually scaling workloads on your fabric.
How should a GPU cloud provider measure capacity sell-through correctly?
Measure the share of available GPU-hours under committed contract of twelve months or longer, reported separately from short-term and on-demand bookings. A healthy structure keeps most capacity committed, a slice flexible, and a deliberate buffer uncommitted. Selling through too completely leaves no room to absorb a large non-renewal, and on-demand demand cannot replace thousands of freed hours quickly.
What utilization band should a GPU cloud provider target?
Target high-70s to high-80s on cluster average, reported hourly as a distribution rather than a single figure. Below roughly 70%, fixed costs spread over too few billable hours and margin compresses. Above roughly 90% sustained, queue times appear for new training jobs, which reliably precedes a customer benchmarking competitors. Segment targets by workload type instead of chasing one number.
Why does interconnect latency belong in a sales KPI framework?
InfiniBand P95 latency determines which market segment a cluster can serve and what it can charge. Training buyers pay premium rates for non-blocking fabric; inference buyers tolerate oversubscribed Ethernet. If latency telemetry never joins account records, sales cannot see that a specific customer's jobs have degraded for weeks. Per-account latency belongs in the CRM, not only in infrastructure monitoring.
How do you detect a training customer preparing to churn before they say anything?
Watch for consumption plateau: booked GPU-hours flat across two consecutive quarters. Churn is lagging; flat consumption is leading. The cause is usually a capacity constraint, a performance ceiling, or a workload that migrated elsewhere. Route the alert to the account team as a technical investigation, not a relationship check-in, and diagnose before the renewal conversation begins.
Should sales compensation reward total bookings or committed revenue?
Weight variable compensation toward committed multi-period contracts. If a rep can hit quota with a short on-demand deal, they will, especially in the final week of a quarter. That systematically erodes capacity sell-through and makes next year's revenue unforecastable. Add a retroactive component for converting on-demand accounts to committed terms within a defined window.
What is a realistic 12-month renewal rate target for GPU cloud contracts?
Above 90% is the target; below 85% means the acquisition cost of replacing lost committed capacity will consume the margin that utilization gains produced. Renewal rate is not improved by a renewal campaign. It is improved by fixing queue times, interconnect latency, and checkpoint-losing failures two quarters earlier, because those are what actually drive a training customer to evaluate alternatives.
How should reliability be measured beyond uptime percentage?
Measure incidents in customer-compute-hours destroyed, not just duration. A provider can hit excellent uptime while regularly killing long training jobs through node-level failures that never register as a full outage. A checkpoint-losing failure eighteen hours into a multi-day run costs the customer far more than the SLA credit is worth. Report both metrics together to change which reliability investments get funded.
FAQ
What are the top sales KPIs for a GPU cloud provider in 2027?
Nine metrics matter most: net new ARR, net revenue retention, cluster GPU utilization, average booked GPU-hours per customer, realized GPU-hour price, capacity sell-through, InfiniBand P95 latency, outage-free days per quarter, and 12-month renewal rate. Capacity, interconnect quality, and reserved-contract discipline drive every one of them, and they should be governed as a portfolio rather than maximized individually.
Why did a quarter with green dashboards still miss revenue plan?
The 87% cluster utilization average concealed a bimodal distribution: a third of the fleet pinned near capacity while another large slice sat under 15%. Pinned nodes created queue times that pushed a large training customer toward a competitor, while idle inference capacity sold on demand at falling realized prices. No single KPI surfaced the mix shift from reserved to on-demand.
How does accelerator allocation affect sales KPIs?
Allocation from the silicon vendor sets the hard ceiling on racked capacity, which caps capacity sell-through, which caps net new ARR. A provider cannot sell past its allocation, which is why allocation negotiation is a commercial function rather than procurement. Demonstrated committed offtake, high renewal rates, and fast deployment strengthen the case for larger allocation in the next cycle.
What is the difference between training and inference markets for GPU cloud?
Training buyers need non-blocking InfiniBand fabric, tolerate premium pricing, and commit to longer reserved contracts. Inference buyers tolerate oversubscribed Ethernet, pay lower rates, and churn more easily. Interconnect topology therefore defines the addressable segment for each cluster. Placing a training workload on inference-grade fabric reliably produces a non-renewal at the next contract cycle.
How do you avoid over-committing GPU capacity?
Keep a deliberate uncommitted buffer sized to your largest single account and treat it as insurance rather than unsold inventory. Pushing sell-through toward the ceiling feels like excellent execution until one large account does not renew. Because on-demand demand cannot absorb thousands of freed GPU-hours on short notice, the resulting idle capacity persists for months and compresses margin.
What does realized price per GPU-hour reveal that list price does not?
Blended realized price captures discounting, credits, spot mix, and contract-type shifts that list pricing hides. A provider can hold list prices flat while realized price falls because the mix moved from reserved to on-demand. Track realized price monthly by accelerator generation and contract type, and watch the trend line rather than the absolute number, because mix erosion is invisible in headline rates.
How should node-level utilization distribution be reported?
Report the percentage of nodes sustaining above 70% utilization for six or more consecutive hours, alongside P50 and P95. If fewer than half of nodes clear that bar while the cluster average looks healthy, you have structural overcapacity in one pool masked by saturation in another. This single distribution view catches the green-average, red-reality failure pattern.
Why is consumption plateau a better churn signal than pipeline review?
A customer whose monthly GPU-hours have been flat for two consecutive quarters is not stable; their growth has stopped for a reason you have not diagnosed. Churn is lagging, consumption plateau is leading. The cause is usually a capacity constraint, a performance ceiling, or a workload that migrated elsewhere. Automated alerts route these accounts to technical investigation rather than relationship check-ins.
What role does capacity expansion lead time play in sales KPIs?
Weeks from expansion decision to billable GPU governs how quickly a sell-through problem can be corrected. Long lead times mean a capacity shortfall cannot be fixed inside a quarter, so forecast accuracy depends on it. Track it explicitly and align it with committed offtake planning, because a provider that cannot add capacity fast cannot capture demand spikes from existing accounts.
How should sales and engineering ledgers be reconciled?
Join engineering telemetry with commercial records at the customer and node level. Utilization, latency, job failures, and queue depth must sit alongside bookings, contract terms, realized price, and renewal dates. When those ledgers stay separate, meeting only at quarterly business reviews, the revenue miss becomes visible in week thirteen instead of week three. Reconciliation is the operating discipline.
Sources
- https://www.nvidia.com/en-us/data-center/
- https://www.gartner.com/en/newsroom/press-releases
- https://www.mckinsey.com/industries/technology-media-and-telecommunications/our-insights
- https://www.bain.com/insights/
- https://www.deloitte.com/global/en/Industries/technology.html
- https://www.idc.com/getdoc.jsp?containerId=prUS
- https://www.ieee.org/publications.html
- https://www.acm.org/publications
- https://www.top500.org/statistics/
- https://www.uptimeinstitute.com/resources/
Related on PULSE
- [More sales kpis for gpu cloud provider rankings and buying guides](/knowledge)
- [PULSE Tools and calculators](/tools)
- [Everything on PULSE RevOps](/)
This page will be disappearing soon. Save it to your device for $1 — or read it free while it is here.
@Kory-White- · if Venmo asks, the last 4 of my number are 2012
 pulse-industry-kpisTop 10 Sales KPIs for Branded Drug Manufacturer in 2027
 pulse-industry-kpisTop 10 KPIs for Physical Therapy Clinics in 2027
 pulse-industry-kpisTop 10 KPIs for Dance Studios in 2027
 pulse-industry-kpisTop 10 Sales KPIs for Computer Vision API in 2027
 pulse-industry-kpisTop 10 KPIs for Plumbing Contractors in 2027
 pulse-industry-kpisTop 10 Sales KPIs for GenAI / RAG Platform in 2027
 pulse-industry-kpisTop 10 KPIs for Private Daycares in 2027
 pulse-industry-kpisTop 10 Sales KPIs for AI Agent Framework in 2027
 pulse-industry-kpisTop 10 Sales KPIs for Penetration Testing and Offensive Security Services in 2027
 pulse-industry-kpisTop 10 KPIs for Pilates Studios in 2027