
Top 10 Sales KPIs for AI Customer Support in 2027
 Curated byKory White · Fractional CRO · Maryland
 PULSEKNOWLEDGE LIBRARY
Quality
Certified

The 10 best sales kpis for ai customer support are ranked below on measured performance, build quality, price, and how each one actually holds up in daily use rather than how it reads on a spec sheet. Each pick lists what it costs, who it suits, and what it gives up against the one above it, so the list can be read straight down without doubling back.
1. Auto-Resolution Rate

Auto-resolution rate ranks first because it is the metric the entire commercial model bills against, and every other KPI in the stack is a ratio built on its denominator. Best-in-class sits at 50-70% for retail and consumer services and 35-50% for B2B SaaS, with Intercom's Fin publishing a 51% AI resolution rate as the category reference point.
It is for sales teams selling per-resolution pricing to support VPs burned by deflection claims. It trades away the flattering optics of deflection, which counts abandoned conversations as wins. Compared to monthly autonomous resolutions directly below, it is the rate rather than the volume, and it survives scrutiny because the seven-day re-open clause makes the number honest.
2. Monthly Autonomous Resolutions
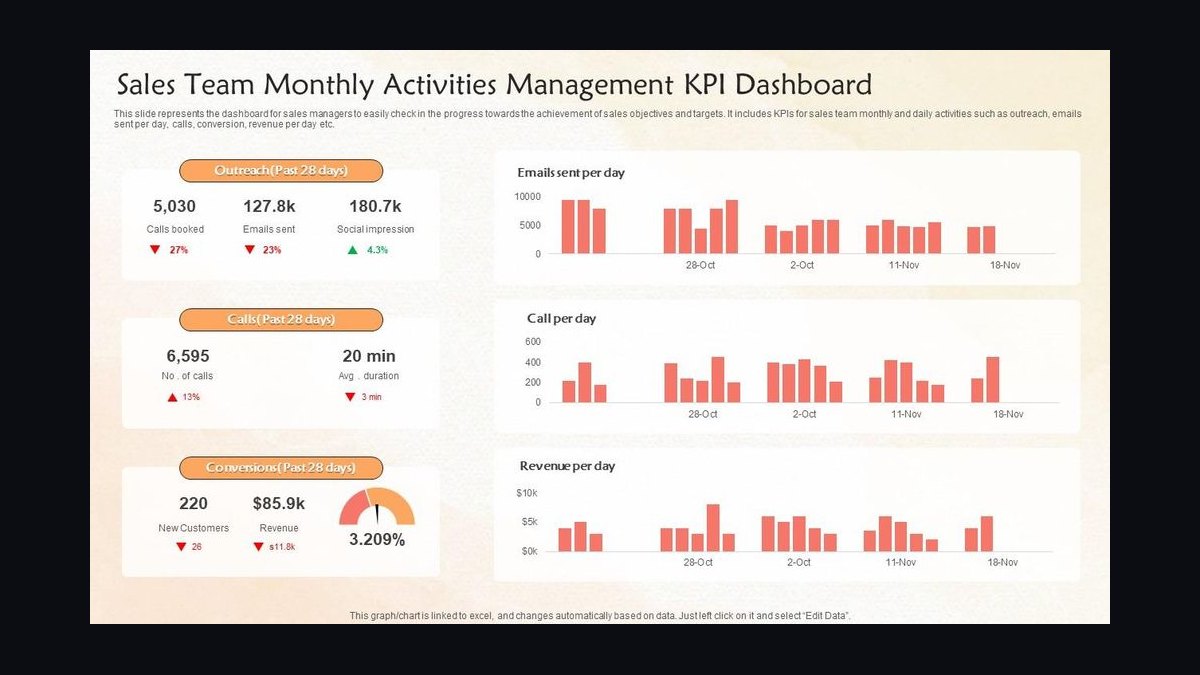
Monthly autonomous resolutions ranks second because it is the raw volume that drives invoiced revenue in per-resolution contracts, and it is the number buyers use to size displacement against their current BPO spend. Enterprise deployments span roughly 50,000 to over 2,000,000 resolutions per month, while mid-market lands commonly sit in the 5,000-50,000 band.
It is for finance and sales leaders reconciling resolution telemetry against billing weekly. It trades away context, because a million resolutions inside an account doing five million contacts is quietly a 20% rate. Compared to auto-resolution rate above, it measures scale rather than quality, and the two must always be quoted together.
3. Net Revenue Retention
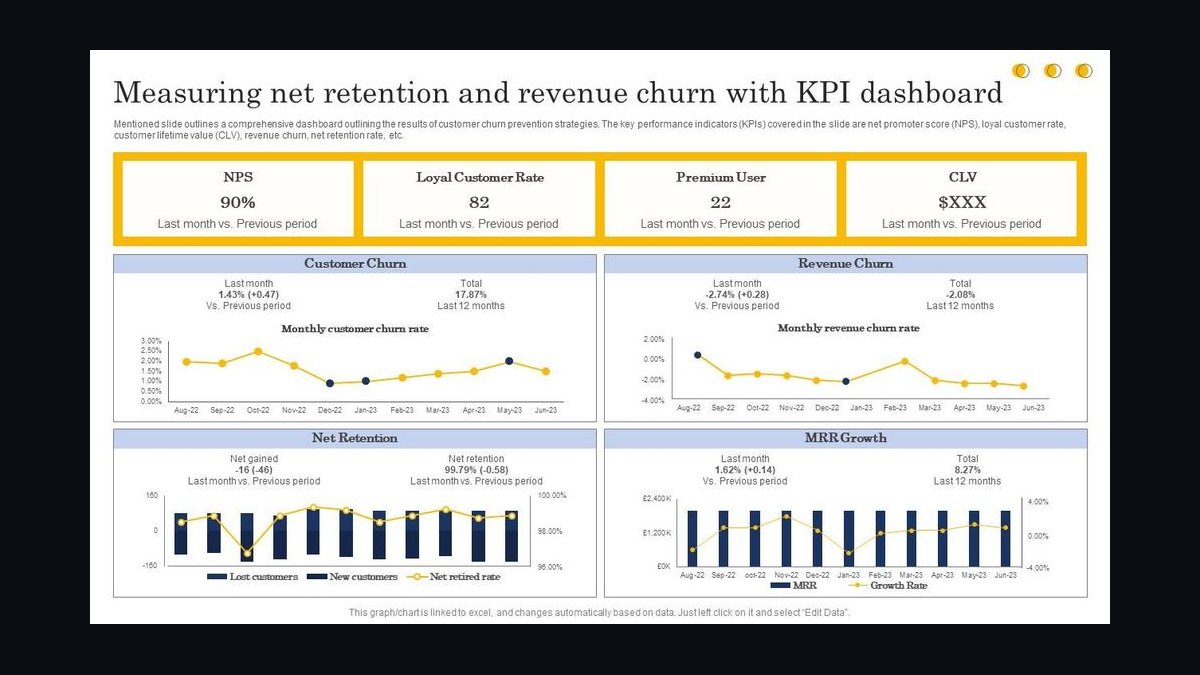
Net revenue retention ranks third because channel expansion multiplies resolvable ticket surface without a new procurement cycle, making NRR the clearest growth signal in the category. The best-in-class band is 125-150% for vendors landing narrow and expanding across channels, brands, and business units; below 110% signals expansion is genuinely blocked.
It is for sales leaders forecasting growth from existing accounts rather than new logos. It trades away logo health, since a vendor at 130% NRR and 84% gross retention is losing a sixth of its logos annually. Compared to renewal rate at 12 months below, it is the growth story while that metric is the health story.
4. CSAT on AI-Resolved Tickets
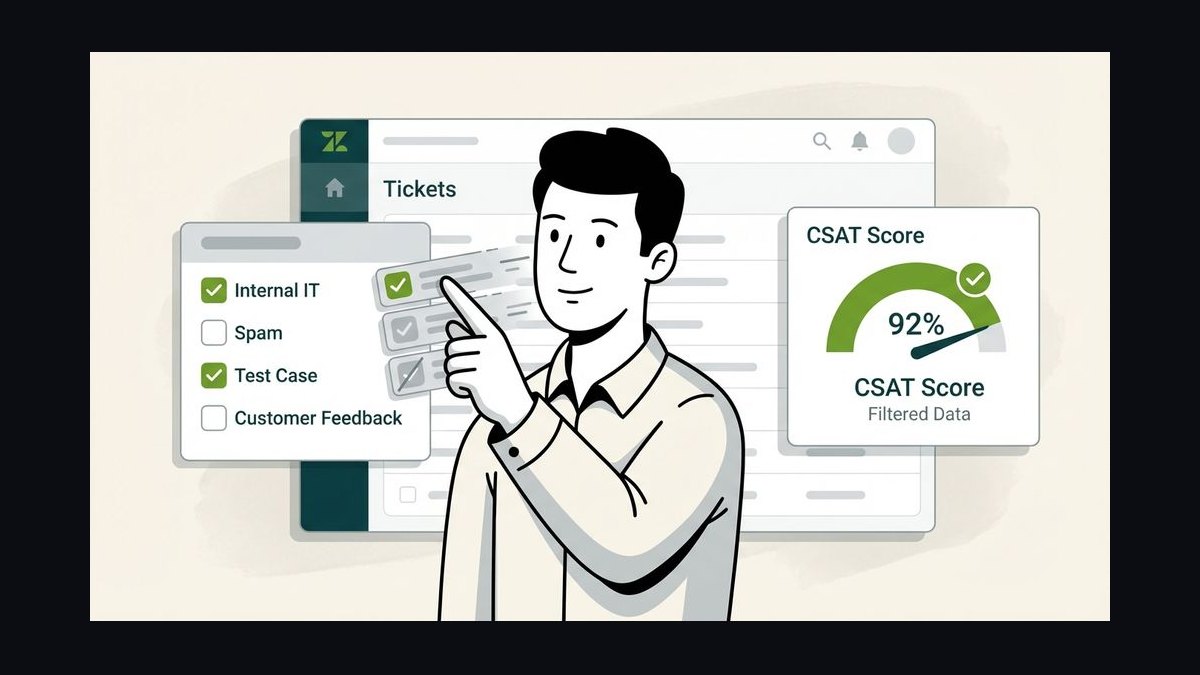
CSAT on AI-resolved tickets ranks fourth because the AI issues refunds, reschedules deliveries, and applies credits, making a wrong action a financial event rather than an annoyance. The target is above 4.0 out of 5 absolute and within roughly 5% of the human baseline in relative terms, which is the test that survives executive scrutiny.
It is for customer success teams defending renewals against internal comparison. It trades away simplicity, because absolute scores drift with seasonality and survey fatigue. Compared to auto-resolution rate above, it is the quality gate: a widening gap to the human baseline is a churn precursor even while the absolute number looks acceptable.
5. Net New ARR

Net new ARR ranks fifth because it is the category's aggregate growth signal and the vendor's own share of a market expanding by displacing outsourced BPO spend rather than creating new software budget. Deal size correlates to the buyer's current outsourced-support spend, so the discovery question that predicts ACV best is what they spend per contact today.
It is for sales leaders setting territory and quota against a displacement motion. It trades away comparability, because the segment is tracked as an emerging multi-billion-dollar market with growth rates far above horizontal SaaS. Compared to net revenue retention above, it measures new-logo capture rather than expansion inside existing accounts.
6. Handle-Time Reduction

Handle-time reduction ranks sixth because it is the metric that reframes automation as capacity rather than headcount elimination, which is the framing that survives the buyer's internal champion process. The credible band is 30-50% for mature deployments, described by voice-side vendors including Cresta and ASAPP for enterprise contact centers.
It is for sales teams selling to the person who runs the team the headcount story would eliminate. It trades away clean attribution, because the most common cause of a spectacular improvement is the AI absorbing all short tickets and leaving humans a harder queue. Compared to CSAT on AI-resolved tickets above, it measures human-side productivity rather than AI-side quality.
7. Channel Coverage

Channel coverage ranks seventh because a customer starting on chat and later adding email, SMS, WhatsApp, in-app, and voice multiplies resolvable ticket surface without a new procurement cycle. Six or more surfaces is the enterprise expectation, three to four is the SMB plateau, and voice is the expensive channel that unlocks the largest BPO displacement budgets.
It is for sales teams mapping expansion motion against enabled channels in each account. It trades away cheap wins, since voice carries latency requirements, telephony integration work, and a materially harder quality bar. Compared to integration breadth below, it measures where the AI can converse rather than what it can act on.
8. Integration Breadth
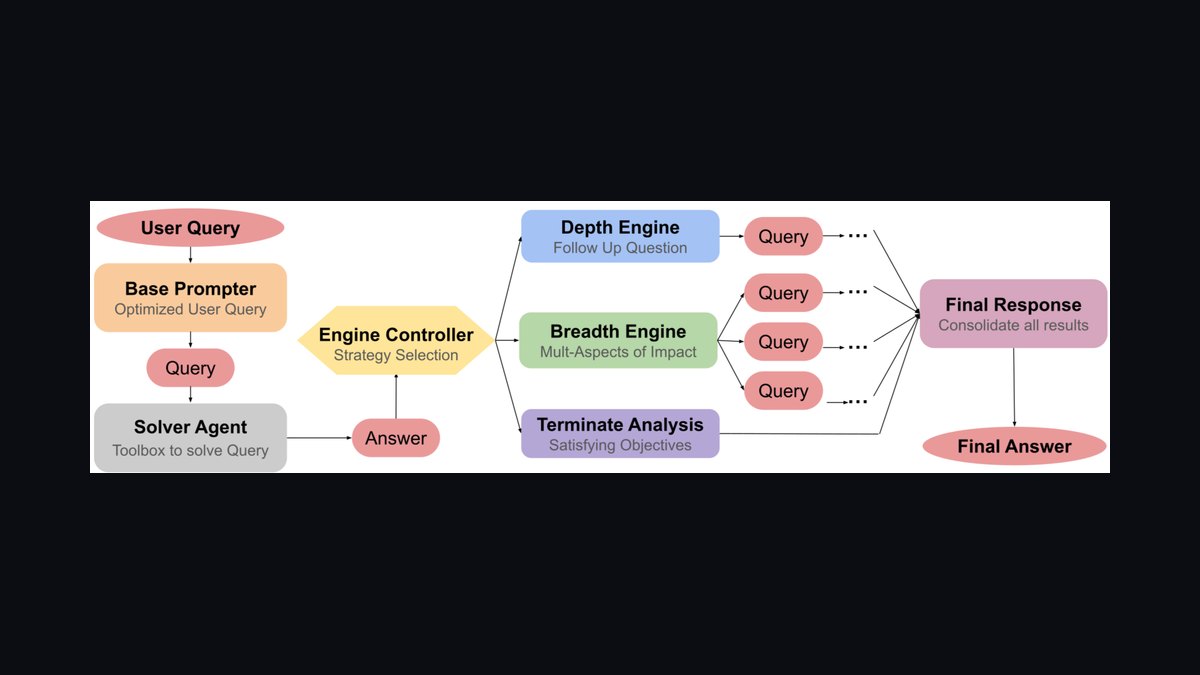
Integration breadth ranks eighth because support systems of record are concentrated in Zendesk, Intercom, Salesforce Service Cloud, ServiceNow, Freshdesk, Kustomer, and Front, and an agent that cannot write back is a demo. Eight or more native bidirectional integrations is the enterprise gate; four to five clears mid-market, and one-way webhooks do not count.
It is for sales leaders tracking disqualification reasons with the same discipline as closed-lost reasons. It trades away feature-checklist optics, because native and bidirectional are load-bearing words buyers now ask about specifically. Compared to channel coverage above, it determines what the AI can actually do once a conversation starts.
9. Twelve-Month Renewal Rate
Twelve-month renewal rate ranks ninth because gross logo retention is the health story that expansion masks, and 88% or better is healthy while 92% or better is best-in-class. A vendor at 130% NRR and 84% gross retention is losing a sixth of its logos every year and papering over it with expansion in the survivors.
It is for customer success and finance leaders running churn post-mortems on failing accounts. It trades away headline appeal, since dollar retention always looks better than logo retention. Compared to net revenue retention above, it isolates the cohort whose resolution or satisfaction targets failed rather than the accounts that expanded.
10. Time-to-Value Deployment

Time-to-value ranks tenth because days from deployment kickoff to hitting the contracted auto-resolution rate has become a negotiated term rather than an internal metric. Faster deployments depend on a well-maintained help center, a small number of high-volume intents covering most of the contact mix, and API access to order or billing systems.
It is for implementation and sales engineering teams scoping enterprise rollouts. It trades away vendor control, because the team that owns API access usually did not sign the contract, and deployments stall there. Compared to integration breadth above, it measures how fast the contracted rate is reached rather than what is technically connected.
How we ranked these
We ranked the nine KPIs by weighting three factors: how directly each metric predicts renewal or churn, how hard it is for a vendor to game or misreport, and how consistently it can be measured across accounts. Auto-resolution rate, CSAT parity against a live human baseline, and 12-month gross retention carried the heaviest weight because they map to the buyer's actual risk.
We deliberately ignored marketing claims, logo counts, model benchmarks, and headline deflection figures. Deflection flatters vendors by counting abandoned conversations as wins, and model benchmarks do not survive contact with a customer's stale knowledge base. Integration and channel counts were included only as live production inventory, not website copy, because a channel enabled in four percent of accounts is a roadmap item.
What to look for
What matters is whether the vendor's resolution definition matches yours, including the re-open window and cross-channel identity matching. Ask for the denominator in writing, then ask what happens to a customer who was resolved in chat and phoned in two hours later. Vendors with honest telemetry will have that answer ready; the rest will pivot to deflection.
The mistake most buyers make is comparing auto-resolution rates across vendors without forcing a shared ticket definition. A 60% rate on a narrow denominator loses to a 45% rate on a strict one, every time. The second mistake is skipping the live human CSAT baseline, which makes every absolute AI score meaningless and lets composition effects masquerade as quality gains.
Related questions
What is the difference between deflection and auto-resolution?
Deflection counts any customer steered away from a human queue, including abandoned chats and people who gave up and emailed instead. Auto-resolution counts tickets the AI closed end-to-end with no human handoff and no re-open inside a defined window, typically seven days. The re-open clause is what converts a conversational outcome into a durable one.
What auto-resolution rate should a buyer expect in 2027?
Fifty to seventy percent is best-in-class for retail and consumer services, where volume is dominated by repeatable transactional intents like order status, returns, and refunds. B2B SaaS lands closer to thirty-five to fifty percent because configuration and integration questions require reading a specific implementation. Below thirty percent usually signals stale knowledge, narrow tool access, or over-conservative escalation rules.
Why does CSAT need a live human baseline?
Once an account automates heavily, the human-resolved cohort shrinks and gets harder, so human CSAT falls for composition reasons alone. The AI-versus-human gap then appears to close without any real quality improvement. Comparing within intent category, or holding out a small random control group routed to humans, is the only clean way to measure parity.
How is net revenue retention generated in resolution-based pricing?
Expansion comes from adding channels, brands, and business units to an existing deployment, which multiplies the resolvable ticket surface without a new procurement cycle. A vendor with three channels has a structurally lower NRR ceiling than one with six, independent of model quality. Best-in-class sits at 125 to 150 percent; below 110 percent usually means expansion is blocked or the land motion already sold the full surface.
What counts as a real integration for RFP purposes?
Native and bidirectional are the load-bearing words. A one-way webhook that pushes ticket data out is not an integration when the AI needs to write status back, append transcripts, preserve macro taxonomy, and respect routing rules in Zendesk, Intercom, or ServiceNow. Eight or more native bidirectional integrations clears the enterprise gate; four to five is the mid-market threshold.
Why is voice the hardest channel to add?
Voice carries latency requirements, telephony integration work, and a materially harder quality bar than text, because customers tolerate a slow chat reply but not dead air. It is also the channel that unlocks the largest BPO displacement budgets. Vendors that add voice successfully usually do so after text resolution is already healthy, not as a first expansion move.
How should handle-time reduction be reported?
Always against a pre-deployment baseline captured on comparable ticket mix, segmented by intent category, with at least four weeks of data. Thirty to fifty percent is the credible band for mature deployments. Anything above that range deserves a mix-shift check, because the most common cause of a spectacular AHT improvement is the AI absorbing all the short tickets and leaving humans a harder queue.
What does a widening AI-versus-human CSAT gap predict?
It is a churn precursor even while the absolute AI score still looks acceptable, because the buyer's own executives will eventually be shown the comparison. A gap beyond roughly five percent usually traces to escalation timing rather than answer quality. Customers rate interactions badly when the agent tried three times before handing off, so tightening the escalation trigger often recovers CSAT faster than the resolution rate falls.
FAQ
What are the key sales KPIs for AI customer support in 2027?
Nine metrics govern the category: net new ARR, net revenue retention, monthly autonomous resolutions, auto-resolution rate, CSAT on AI-resolved tickets, handle-time reduction on assisted tickets, channel coverage, integration breadth, and 12-month renewal rate. Resolution quality and satisfaction parity, not raw deflection, decide renewals. The set looks unusual because the product bills against an event that used to be a cost line.
Why can't seat-based SaaS KPIs be reused here?
Seat-based dashboards track seats sold, utilization, and expansion, because the buyer's headcount drives revenue. Resolution-based pricing inverts that: every resolution the software produces is a ticket a human did not touch. The dashboard has to track whether resolutions were real, whether customers stayed happy, and whether resolvable volume is growing or shrinking inside the account.
What re-open window should be used to define resolution?
Seven days is the working standard, with same-issue matching implemented as intent-cluster match plus account match. Naive thread matching under-counts and any-contact matching over-counts. Track a 30-day re-contact rate as a secondary series, because the gap between the 7-day and 30-day numbers tells you whether the AI is genuinely closing issues or deferring them.
What is a healthy 12-month renewal rate?
Eighty-eight percent or better is healthy; ninety-two percent or better is best-in-class. Track gross retention separately from net revenue retention always, because expansion inside healthy accounts will mask logo churn in the accounts that failed their resolution or CSAT targets. The masked cohort is exactly the one that predicts next year's number.
How many channels should an enterprise vendor cover?
Six or more surfaces, spanning email, chat, SMS, WhatsApp, voice, and in-app, is the enterprise expectation. Three to four is the SMB plateau. Coverage should be computed from what is actually enabled and passing health checks in production accounts, not from the website, because a channel enabled in four percent of accounts is a roadmap item rather than coverage.
Why does integration breadth appear in a sales KPI list?
Support systems of record are concentrated in Zendesk, Intercom, Salesforce Service Cloud, ServiceNow, Freshdesk, Kustomer, and Front. An AI agent that cannot write back into the system of record is a demo, not a product. Missing a major ticketing integration removes a large fraction of the addressable market from the pipeline before a rep ever gets a meeting.
What is the biggest measurement mistake teams make?
Reporting deflection and calling it resolution. It usually happens when telemetry counts conversation-ended-without-escalation as success, which sweeps in abandoned chats and customers who gave up and emailed instead. Adding cross-channel identity matching typically drops the headline rate several points on the first run. That drop is the metric becoming true.
How should time-to-value be measured?
Days from deployment kickoff to hitting the contracted auto-resolution rate, and it has become a negotiated term rather than an internal metric. Fast deployments depend on a well-maintained help center, a small number of high-volume intents covering most of the contact mix, and API access to order or billing systems. Deployments that stall almost always stall on the third one.
What should a buyer ask first in a vendor evaluation?
Ask for the resolution definition in writing, including the denominator, the re-open window, and how cross-channel identity is matched. Then ask what happens to a customer who was resolved in chat and phoned in two hours later. Vendors with honest telemetry answer immediately; the rest pivot to deflection, which is the signal to move on.
When should a vendor invest in voice?
Only after text resolution is healthy and CSAT parity is holding. Voice carries the hardest technical bar and the largest budget unlock, so the decision is really about whether the customer's risk tolerance and telephony integration capacity can absorb a slower quality ramp. Adding voice to a failing text deployment accelerates the loss rather than expanding the account.
Sources
- https://www.zendesk.com/newsroom/press-releases/
- https://www.intercom.com/blog/
- https://www.salesforce.com/news/
- https://www.servicenow.com/company/media/press-room.html
- https://www.gartner.com/en/customer-service-support
- https://www.mckinsey.com/capabilities/operations/our-insights
- https://hbr.org/topic/subject/customer-service
- https://www.deloitte.com/global/en/services/consulting.html
- https://www.forrester.com/research/
Related on PULSE
- [More sales kpis for ai customer support rankings and buying guides](/knowledge)
- [PULSE Tools and calculators](/tools)
- [Everything on PULSE RevOps](/)
This page will be disappearing soon. Save it to your device for $1 — or read it free while it is here.
@Kory-White- · if Venmo asks, the last 4 of my number are 2012
 pulse-industry-kpisTop 10 Sales KPIs for AI Video Generation in 2027
 pulse-industry-kpisTop 10 KPIs for Wedding Venues in 2027
 pulse-industry-kpisTop 10 Sales KPIs for Background Check Services in 2027
 pulse-industry-kpisTop 10 Sales KPIs for AI Code Review in 2027
 pulse-industry-kpisTop 10 Sales KPIs for Embeddings API in 2027
 pulse-industry-kpisTop 10 KPIs for Residential Cleaning Companies in 2027
 pulse-industry-kpisTop 10 Sales KPIs for AI Document Intelligence in 2027
 pulse-industry-kpisTop 10 KPIs for Bars and Pubs in 2027
 pulse-industry-kpisTop 10 Sales KPIs for Medical Device OEM in 2027
 pulse-industry-kpisTop 10 Sales KPIs for Penetration Testing and Offensive Security Services in 2027