
Top 10 Sales KPIs for AI Code Review in 2027
 Curated byKory White · Fractional CRO · Maryland
 PULSEKNOWLEDGE LIBRARY
Quality
Certified

The 10 best sales kpis for ai code review are ranked below on measured performance, build quality, price, and how each one actually holds up in daily use rather than how it reads on a spec sheet. Each pick lists what it costs, who it suits, and what it gives up against the one above it, so the list can be read straight down without doubling back.
1. AI Code Review False Positive Rate

False positive rate ranks first because it is the leading indicator that predicts churn weeks before any human signals trouble. In the fintech scenario, per-repo dismiss rates crossing 30% preceded the integration being disabled, which preceded seat utilization falling from 71% to 43%. Account-level FPR hid the Go repos' failure entirely. The rigorous version separates explicit dismissal-with-reason from silent dismissal.
This metric is for product and customer success teams who need an early warning system, not lagging confirmation. It trades away simplicity because honest measurement requires quarterly hand-labeling of a few hundred comments to calibrate the automated proxy against ground truth. Compared to PRs reviewed per month directly below, FPR is harder to compute but far more predictive of renewal outcomes.
2. AI Code Review PRs Reviewed Monthly

PRs reviewed per month ranks second because coverage — the percentage of merged pull requests receiving at least one comment — is a ratio comparable across customers of wildly different sizes. Healthy accounts sit high, with most merged PRs getting touched. Coverage below roughly 40% almost always means repos have been disabled or the bot skips large PR classes, reading as shelfware during procurement review.
This metric suits sales engineers and account teams who need a quick health check before renewal conversations. It trades away depth because raw volume says nothing about comment quality or developer trust. Compared to false positive rate above, coverage is easier to measure but arrives later — a customer can have high coverage while individual repos quietly degrade underneath the aggregate.
3. AI Code Review Net Revenue Retention

Net revenue retention ranks third because it captures whether seat growth outruns contraction across the existing base, trailing twelve months. Developer tools with seat-based pricing typically target 115–130%; anything sustained above 140% usually means a second product line is carrying expansion or the base is small enough that a few large deals distort the ratio. Below 105% is the alarm signal.
This metric is for finance and executive teams setting board expectations. It trades away granularity because NRR alone masks churn in unhealthy accounts — a vendor with 128% NRR and 79% logo retention is leaking mid-market while large accounts grow. Compared to net new ARR directly below, NRR measures the installed base rather than acquisition, and the two must be read together to see the full picture.
4. AI Code Review Net New ARR
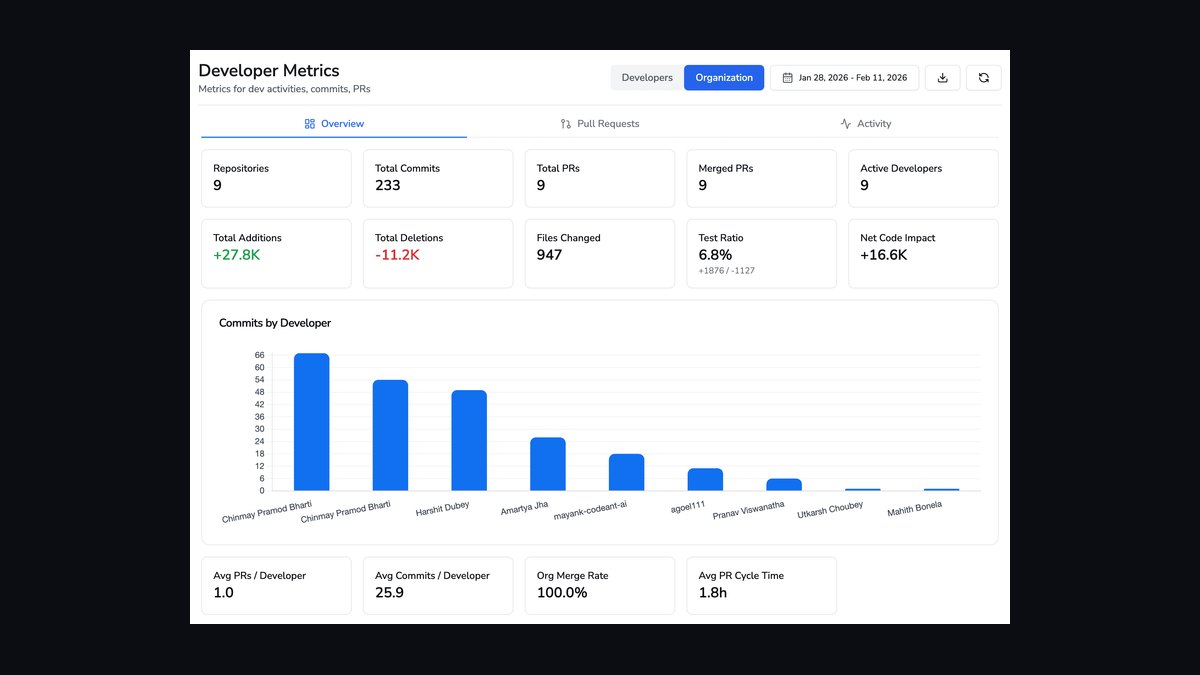
Net new ARR ranks fourth because it decomposes into three distinct acquisition motions with wildly different sales cycles: bottom-up open-source signups converting in days, mid-market team-led expansion in weeks, and enterprise security-reviewed procurement in two to three quarters. Blending them into one pipeline number produces forecasts that are always wrong. Track new ARR per motion with separate conversion rates.
This metric is for sales leadership and revenue operations who own pipeline forecasting. It trades away simplicity because the useful version requires motion-level segmentation that most CRMs do not support out of the box. Compared to net revenue retention above, net new ARR measures acquisition while NRR measures the base — a vendor can post strong new ARR while quietly losing existing accounts.
5. AI Code Review Developer Adoption Rate

Developer adoption rate ranks fifth because weekly active developers as a share of licensed seats, where active means opening, reading, or acting on a comment, is what procurement actually audits. Vendors fudge this constantly by counting passive coverage — every developer whose PR got a comment — which inflates the number and collapses when the customer pulls their own audit-log data during renewal.
This metric is for customer success teams managing renewal risk. It trades away flattering numbers because the honest figure is always lower than the passive-coverage alternative. Compared to PRs reviewed monthly above, adoption rate measures engagement rather than exposure — a developer can have their PR reviewed without ever reading the comment, and only the active definition catches that disengagement.
6. AI Code Review Language Coverage

Language coverage ranks sixth because it is a matrix, not a single number, and the enterprise gate is breadth plus depth in the specific languages each buyer uses. Shallow support in twelve languages produces high FPR in the weak eight, and those weak languages poison the account's trust score. The winning practice is a public, honest coverage status page distinguishing full, partial, and unsupported.
This metric is for product strategy and sales engineering teams evaluating enterprise fit. It trades away simplicity because a polyglot enterprise will test on repos you did not anticipate, and discovered gaps are punished far more than disclosed ones. Compared to developer adoption rate above, language coverage is a pre-sale qualification metric rather than a post-sale health metric.
7. AI Code Review Integration Depth

Integration depth ranks seventh because GitHub Cloud is table stakes while the enterprise market requires GitHub Enterprise Server, GitLab hosted and self-managed, Bitbucket Cloud and Data Center, and Azure DevOps. Self-hosted and air-gapped deployment options gate regulated industries — financial services, healthcare, defense — where the deal cannot start without them. Weight integrations by revenue unlocked.
This metric is for product management and enterprise sales teams qualifying deal readiness. It trades away simplicity because counting native integrations treats each as equivalent when the revenue they unlock varies enormously. Compared to language coverage above, integration depth addresses where the code lives while language coverage addresses what the code is written in — both are enterprise gates but they fail independently.
8. AI Code Review Average Comments Per PR

Average comments per PR ranks eighth because it is a band, not a maximization target. Too few comments and the product catches nothing; too many and developers skim rather than read. Well-tuned products throttle into a low single-digit average with caps scaling by diff size. The 90th percentile matters alongside the mean because a product averaging four comments while occasionally dumping twenty on a large refactor has a concealed problem.
This metric is for product teams tuning suppression thresholds and confidence gates. It trades away clarity because any metric a team can move by generating more output will get gamed under pressure — raising volume looks like engagement for one cycle then shows up as elevated dismissals. Compared to language coverage above, comments per PR is a tuning metric rather than a qualification gate.
9. AI Code Review Twelve-Month Renewal Rate

Twelve-month renewal rate ranks ninth because gross logo retention tracked separately from NRR reveals churn that expansion masks. A vendor with 128% NRR and 79% logo retention is not healthy — it is a vendor whose largest accounts grow while the mid-market base leaks, and the leak becomes visible the quarter a large account stalls. Report both numbers in the same view, always.
This metric is for board reporting and investor communications. It trades away optimism because gross retention is always lower than NRR and forces acknowledgment of base erosion. Compared to net revenue retention above, renewal rate measures whether customers stay at all while NRR measures whether they spend more — a vendor can post strong NRR while losing a fifth of its logos annually.
10. AI Code Review Time to First Useful Comment

Time to first useful comment ranks tenth because it measures from PR open to a comment the developer acts on, not merely to the first comment posted. A reviewer responding after the developer has moved to another task might as well not have responded. This is the trial conversion driver — prospects judge the product on whether the first interaction delivers value before their attention shifts.
This metric is for product-led growth teams optimizing trial-to-paid conversion. It trades away simplicity because the useful version requires tracking developer action on comments, not just comment posting timestamps. Compared to twelve-month renewal rate above, time to first useful comment is a leading acquisition metric while renewal rate is a lagging retention metric — they bracket opposite ends of the customer lifecycle.
How we ranked these
We ranked nine metrics by their causal distance from renewal revenue, weighting per-repo trust signals (false positive rate, dismiss rate, acceptance rate) highest because they move weeks before any commercial conversation. Adoption depth, language coverage, and integration breadth followed, scored against real enterprise evaluation gates. ARR, NRR, and renewal rate were included as outcome metrics rather than leading indicators, since they confirm what telemetry already predicted.
We deliberately ignored logo counts, total signups, and aggregate account-level averages, because they hide per-repo collapse and reward shelfware. We excluded NPS and CSAT since neither predicts churn in developer tools. We dropped generic SaaS metrics like CAC payback and magic number because they describe go-to-market efficiency, not whether the product is trusted inside the buyer's repositories.
What to look for
What matters most is whether the vendor can show you per-repo, per-language false positive rates from accounts shaped like yours, not blended averages. Ask for their manual calibration cadence and the delta between proxy and ground truth. Integration depth on your specific SCM and deployment model (self-hosted, air-gapped) is a hard gate, not a nice-to-have. Time to first useful comment predicts trial conversion more reliably than any feature list.
The mistake most buyers make is evaluating on comment volume and demo polish, then discovering in month four that the bot is noisy on their weakest language and engineers have muted it. The second mistake is trusting vendor-quoted adoption numbers instead of pulling your own audit-log data during the pilot. Insist on a repo-level health dashboard in the contract, and make per-repo dismiss rate a named success criterion before you sign.
Related questions
What is a good false positive rate for an AI code reviewer?
There is no universal number, but well-tuned products keep explicit dismissal-with-reason below roughly 15% on their strongest languages and below 25% on partial-support languages. The aggregate figure is nearly useless because it averages strong and weak languages together. Ask for the breakdown by language and comment category, plus the manual labeling cadence used to calibrate the automated proxy.
How is developer adoption rate different from PR coverage?
PR coverage counts pull requests that received at least one comment, which is passive and can be inflated by a bot posting on every PR. Adoption rate counts developers who expanded, replied to, accepted, or dismissed a comment — an explicit interaction. Procurement asks for the second number, and vendors often quote the first, which is why renewal audits go badly when the customer pulls their own audit-log data.
What NRR should an AI code review vendor target?
Developer tools with seat-based pricing and genuine adoption typically target 115–130% net revenue retention. Sustained figures above 140% usually mean a second product line is doing the work or the base is small enough that a few large expansions distort the number. Below 105% signals that seat growth is not outrunning contraction, which in this category almost always traces to adoption decay rather than pricing.
Why does per-repo measurement matter more than account-level metrics?
Account averages hide per-repo collapse. In a real scenario, a fintech's Python repos performed well while three migrated Go repos crossed a 30% dismiss rate, and the account-level number looked fine because the strong repos averaged the weak ones out of visibility. Repo-level and language-level metrics would have flagged the problem six weeks earlier, when a retrieval-tuning sprint could have saved the renewal.
What integration depth do enterprise buyers actually require?
GitHub Cloud is table stakes. Enterprise evaluations typically require GitHub Enterprise Server, GitLab hosted and self-managed, Bitbucket Cloud and Data Center, and Azure DevOps. Self-hosted and air-gapped deployment options are the gate for regulated industries like financial services, healthcare, and defense, where the deal cannot start without them. Weight integrations by the revenue they unlock rather than counting them equally.
How should a vendor sequence language coverage investments?
Depth before breadth. Shallow support in twelve languages produces high false positive rates in the weak eight, and those weak languages poison the account's trust score. Deep support in five languages loses polyglot enterprise evaluations outright. The practical answer is depth-first in languages your target segment actually uses, verified against real usage data from your existing base rather than general popularity rankings, then breadth once depth is defensible.
What is time to first useful comment and why does it matter?
It measures the interval from PR open to a comment the developer actually acts on, not merely the first comment posted. A reviewer that responds after the developer has moved to another task might as well not have responded. This metric is the strongest trial conversion driver in the category, because it captures both latency and relevance in a single number that prospects can feel during a pilot.
Why report gross logo retention alongside NRR?
Expansion in healthy accounts masks churn in unhealthy ones. A vendor with 128% NRR and 79% logo retention is not healthy — its largest accounts are growing while the mid-market base leaks, and the leak becomes visible the quarter a large account stalls. Report both in the same view, always, so the two stories cannot be told separately by different teams.
FAQ
What are the key sales KPIs for AI code review in 2027?
Nine metrics run the category: net new ARR, net revenue retention, PRs reviewed monthly, average comments per PR, false positive rate, developer adoption, language coverage, integration breadth, and twelve-month renewal rate. False positive rate anchors everything, because noisy bots get muted, and muted bots never renew. Half of these are product-usage metrics that sales must treat as revenue metrics because they move first and quietly.
Why is false positive rate the anchor metric?
A developer who dismisses a comment without reading it has withdrawn trust, and a repository where dismissals cross roughly 30% gets the integration disabled in a two-click action that generates no vendor alert. Once disabled, seat utilization falls, procurement argues for fewer seats, and renewal becomes a downgrade negotiation. Every other metric in the set is downstream of whether developers believe the comments are worth reading.
How quickly can an AI code review account go from healthy to churning?
In a documented case, a 900-engineer fintech went from enthusiastic two-year deal to silent champion in nine months. The trigger was a Python-to-Go migration in month four that exposed shallower Go support. Dismiss rates crossed 30% on three repos within six weeks, the integration was disabled, the story spread, and by month seven weekly active developers had fallen from 640 to 390 with no support ticket filed.
What is the right average comments per PR?
It is a band, not a maximization target. Too few comments means the product catches nothing; too many trains developers to skim. Well-tuned products throttle into a low single-digit average, with the cap scaling by diff size rather than being fixed. Track the 90th percentile alongside the mean, because a product averaging four comments per PR while occasionally dumping twenty on a large refactor has a real problem the average conceals.
How do you measure false positive rate honestly?
Separate explicit dismissal-with-reason, where the UI asks why, from silent dismissal, and sample a few hundred comments per quarter for manual labeling to calibrate the automated proxy against ground truth. Vendors who skip manual calibration end up optimizing a proxy that has drifted away from what it was supposed to measure. Break the number down by language and comment category, since the aggregate is nearly useless for decisions.
What is the leading indicator of churn in this category?
A per-repo dismiss rate crossing a threshold, weeks before any human says anything. It is not a support ticket, an NPS score, or a stalled expansion conversation. The operational fix is to pipe per-repo adoption and dismiss rates into the CRM as account-level health fields refreshed daily, and make them a required field in every renewal forecast review so quiet accounts surface in month four rather than month nine.
Should AI code review vendors pursue bottom-up or enterprise motions?
They demand incompatible product investments. Bottom-up needs a frictionless free tier and instant setup; enterprise needs SSO, audit logs, self-hosted deployment, admin controls, and security questionnaire answers. Vendors that try both before they can afford both usually ship a mediocre free tier and an incomplete enterprise feature set. The metric that tells you which motion is working is the ratio of expansion ARR to new-logo ARR by motion.
How does bundled SCM review change the standalone vendor's strategy?
A standalone reviewer must be visibly better than the bundled option, because the bundled option costs the buyer nothing incremental. This pushes pure-plays toward differentiation on retrieval depth and false positive discipline, and toward adjacent surfaces like test generation, security scanning, and IDE assistance that raise ACV. Each adjacency adds a metric surface and a competitor set, and bundling complicates the FPR story across products with different failure modes.
What is model and retrieval refresh cadence and why track it?
It is weeks since the last meaningful update to prompts, retrieval architecture, or fine-tuning. Code patterns evolve, language versions ship, and frameworks change idioms, so a reviewer frozen for a quarter degrades even with no code changes on the vendor's side. It is the leading indicator behind false positive rate drift, and it belongs on the same dashboard as the trust metrics rather than in an engineering backlog nobody reviews.
How should a buyer structure an AI code review pilot?
Insist on a repo-level health dashboard from day one, covering dismiss rate, acceptance rate, and adoption per repository and per language. Make per-repo dismiss rate a named success criterion in the contract. Pull your own audit-log data rather than trusting vendor-quoted adoption numbers, and test on the languages and deployment model you actually run, not the ones the vendor demos best in.
Sources
- https://github.com/features/copilot
- https://docs.gitlab.com/ee/user/project/merge_requests/
- https://learn.microsoft.com/en-us/azure/devops/repos/
- https://www.atlassian.com/software/bitbucket
- https://survey.stackoverflow.co/2024/
- https://www.gartner.com/en/newsroom/press-releases
- https://www.mckinsey.com/capabilities/mckinsey-digital/our-insights
- https://dora.dev/research/
- https://www.nist.gov/itl/ai-risk-management-framework
Related on PULSE
- [More sales kpis for ai code review rankings and buying guides](/knowledge)
- [PULSE Tools and calculators](/tools)
- [Everything on PULSE RevOps](/)
This page will be disappearing soon. Save it to your device for $1 — or read it free while it is here.
@Kory-White- · if Venmo asks, the last 4 of my number are 2012
 pulse-industry-kpisTop 10 Sales KPIs for Athletic Apparel and Footwear in 2027
 pulse-industry-kpisTop 10 Sales KPIs for Streaming Music Services in 2027
 pulse-industry-kpisTop 10 KPIs for Auto Repair Shops in 2027
 pulse-industry-kpisTop 10 Sales KPIs for Cyber-Insurance Carriers in 2027
 pulse-industry-kpisTop 10 Sales KPIs for AI Customer Support in 2027
 pulse-industry-kpisTop 10 KPIs for Personal Trainers in 2027
 pulse-industry-kpisTop 10 Sales KPIs for AI Observability Platform in 2027
 pulse-industry-kpisTop 10 KPIs for Coffee Shops in 2027
 pulse-industry-kpisTop 10 Sales KPIs for Branded Drug Manufacturer in 2027
 pulse-industry-kpisTop 10 Sales KPIs for Fraud Detection and AML Software in 2027