
Top 10 KPIs for Tire Shops in 2027
 Curated byKory White · Fractional CRO · Maryland
 PULSEKNOWLEDGE LIBRARY
Quality
Certified
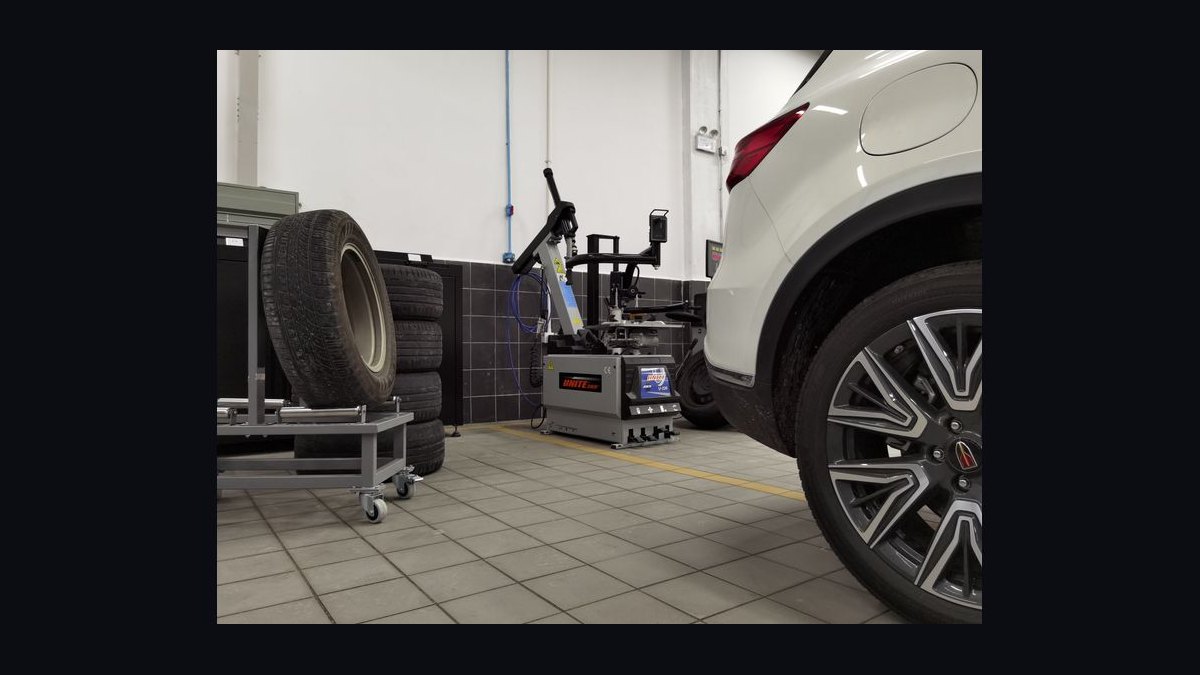
The 10 best kpis for tire shops are ranked below on measured performance, build quality, price, and how each one actually holds up in daily use rather than how it reads on a spec sheet. Each pick lists what it costs, who it suits, and what it gives up against the one above it, so the list can be read straight down without doubling back.
1. Tires Installed Per Bay

Tires installed per bay per day ranks first because bay count is the hard ceiling on tire-shop revenue, and this metric exposes utilization faster than any other number. A healthy independent runs 8-12 tires per bay on a 10-hour shift, while Discount Tire flagships hit 14-18 because they route alignments out. Below 6 per bay signals broken demand or scheduling.
This is built for multi-bay owners and service managers who control bay loading, not counter staff. It trades away nothing operationally but ignores ticket value, so a store can post strong throughput while losing money on every visit. It sits above alignment attach because without bay throughput there is no ticket to attach to.
2. Alignment Attach Percentage

Alignment attach ranks second because alignments carry 55-65% gross margin and turn a 28% tire sale into a profitable visit. Best-in-class operators hit 38-45%, the industry median sits at 18-22%, and weak counter staffs run 8-12%. Each point of attach on a 2,000-ticket store is worth roughly $2,400 monthly gross profit.
This is for service managers and counter staff who own the pre-installation inspection step. It trades away short-term customer goodwill when alignment is pushed too hard. It ranks just below bay throughput because attach only matters once the vehicle is in the bay, and just above brake attach because alignment is the easier, higher-frequency add.
3. Brake Attach Percentage

Brake attach ranks third because it converts wheels-off tire visits into 55% margin service revenue that most independents miss. Strong operators run 15-22%, Monro's mix implies roughly 18%, and independents without a digital vehicle inspection workflow commonly hit only 6-9%. The gap is the entire profit story on maintenance visits.
This is for shops that already have a DVI tool and trained technicians willing to measure pad thickness. It trades away bay speed, since wheels-off brake measurement adds minutes per ticket. It ranks below alignment attach because brake work is a harder sell and depends on vehicle condition, and above average ticket because it directly drives that number.
4. Average Repair Order Ticket

Average ticket ranks fourth because it is the simplest single number that captures pricing power, attach success, and tire mix in one figure. A tire-focused independent runs $420-510, a tire-plus-service shop pushes $520-640, and DVI-equipped operators report tickets $80-150 higher than baseline. Big O Tires sits in the $485-525 band.
This is for owners and general managers reviewing weekly P&L performance. It trades away diagnostic detail, since a rising average ticket can hide falling tire volume or shrinking service mix. It ranks below brake attach because attach is the lever that moves ticket, and above fleet mix because retail walk-in volume still dominates most stores.
5. Fleet Account Revenue Mix
Fleet mix ranks fifth because commercial, municipal, and rideshare accounts deliver predictable volume that smooths retail seasonality. Retail-first operators run 5-12%, commercial-tilted stores run 25-40%, and pure commercial dealers hit 60%+. Pomp's Tire Service runs an estimated 45% fleet mix across 230+ locations.
This is for owners with outside sales capacity and back-office collections discipline. It trades away gross margin, since fleets negotiate harder and net-60 terms can stretch to net-90. It ranks below average ticket because fleet revenue without DSO control eats margin twice, and above wholesale cost because mix decisions precede buying decisions.
6. Wholesale Cost Percent Of Retail

Wholesale cost as percent of retail ranks sixth because retail tire prices are publicly comparison-shopped, leaving buying better as the only real margin lever. Healthy independents on ATD and Myers land tires at 68-72% of retail, strong multi-store buyers hit 62-66%, and Monro printed 33.4% blended gross margin in fiscal 2023.
This is for owners and purchasing managers negotiating manufacturer programs quarterly. It trades away simplicity, since SKU-level tracking is required to catch 30-cent-per-tire drift as Michelin and Goodyear reset pricing. It ranks below fleet mix because mix sets the buying volume, and above labor productivity because margin discipline precedes labor efficiency.
7. Labor Productivity Ratio
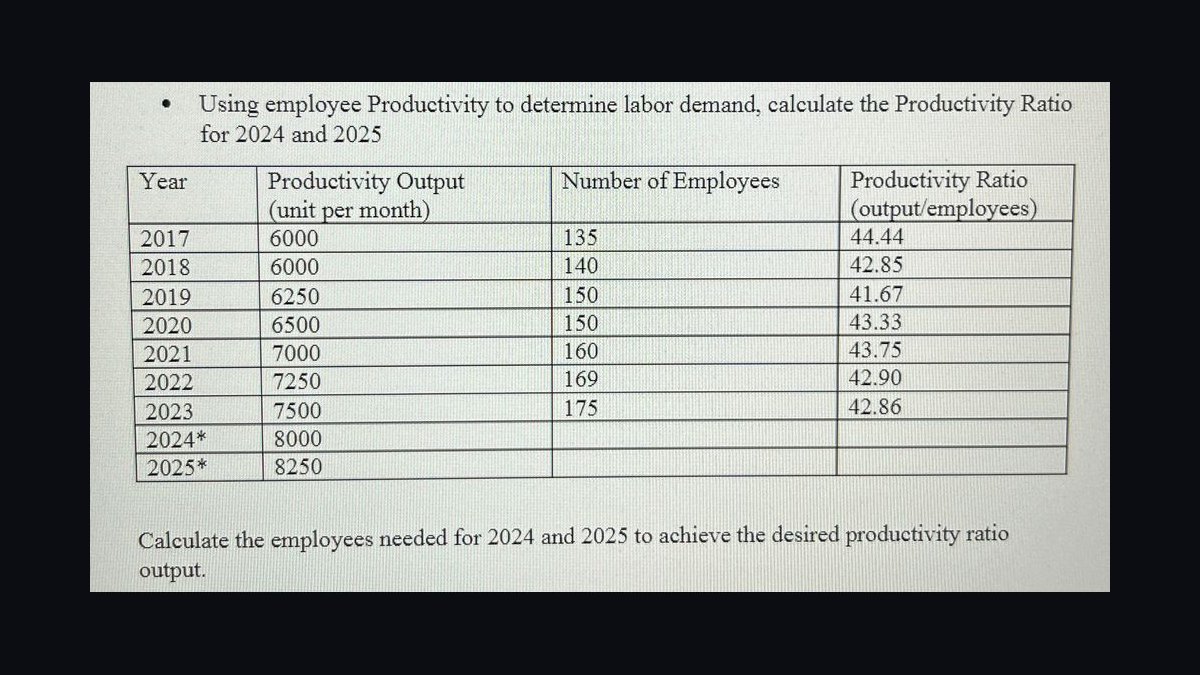
Labor productivity ranks seventh because it measures how much of each technician's clock is actually billed to a customer. Strong operators hit 115-135% with flat-rate pay, the median independent sits at 78-88%, and anything under 70% signals soft demand or chronic comeback rework. Bridgestone Retail Operations reports 110-120% system-wide.
This is for service managers and shop foremen scheduling technician hours. It trades away fairness in mixed-pay shops, since flat-rate techs can post high productivity while hourly techs absorb lot time. It ranks below wholesale cost because margin per job matters more than hours sold, and above gross margin split because productivity feeds both lines.
8. Tire Versus Service Gross Margin
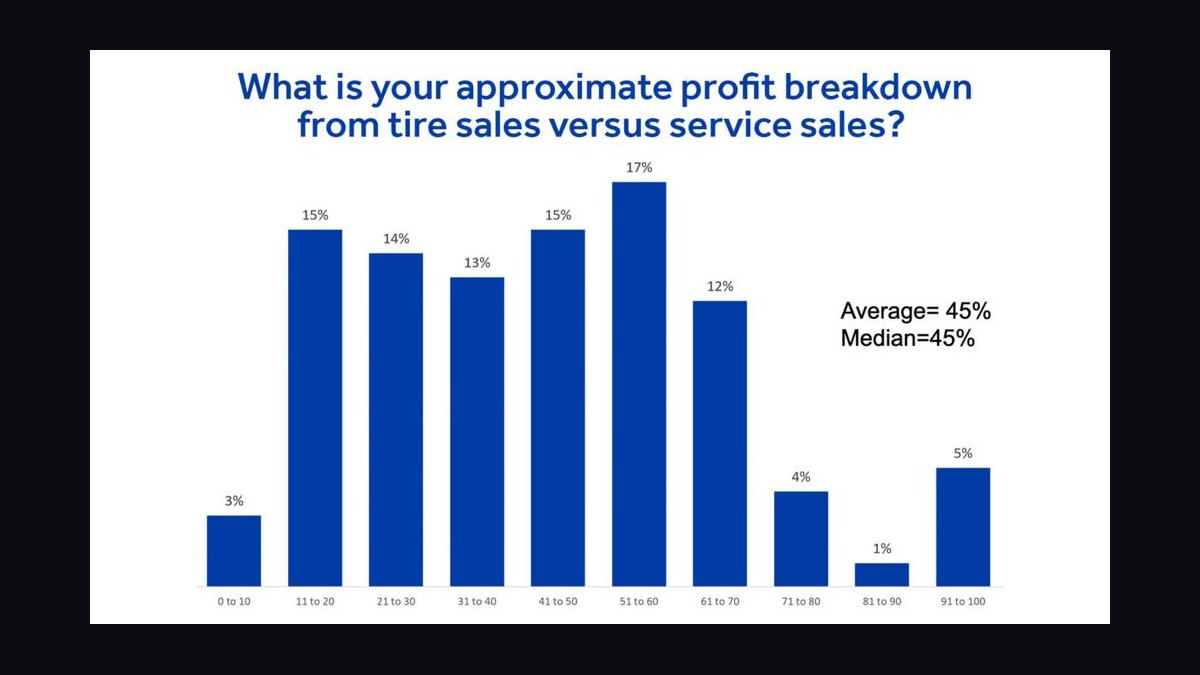
Splitting tire and service gross margin ranks eighth because a single blended number hides whether tires alone are losing money. Tire margin runs 25-32%, service margin runs 55-65%, and any store with blended margin under 38% almost certainly has under-attached service. Monro's 33.4% blended print implies roughly 30% tires and 55% service.
This is for owners and controllers closing monthly books. It trades away simplicity, since two parallel calculations are required at SKU and category level. It ranks below labor productivity because productivity drives both margins, and above same-store sales because margin quality matters more than top-line growth for store health.
9. Same-Store Sales Growth

Same-store sales growth ranks ninth because it isolates performance of mature stores from new openings and acquisitions. Healthy mature stores grow 3-6% in a steady market, turnaround stores grow 8-12%, and two consecutive quarters of negative comps is a leading intervention signal. Monro has publicly reported negative comps in recent quarters.
This is for multi-store operators and investors evaluating real organic performance. It trades away single-store usefulness, since a one-location owner has no comparable base to measure against. It ranks below gross margin split because comps can grow on unprofitable revenue, and above nothing because it closes the top ten as the strategic check on the operational metrics above.
10. Fleet Account DSO

Fleet DSO ranks tenth because fleet revenue without collections discipline can eat gross margin twice through cost of capital. Net-60 terms creeping to net-90 is common in commercial tire, and fleet accounts that take 75+ days to pay turn a 30% margin job into a 20% margin job after financing cost. It is the quiet killer of commercial-tilted stores.
This is for owners and controllers managing fleet AR aging. It trades away sales-team autonomy, since credit holds on slow-paying fleets can strain relationships. It ranks below same-store sales because DSO is a defensive metric, but it belongs on the list because fleet mix above 25% without DSO tracking is a known failure pattern.
How we ranked these
We ranked tire-shop KPIs by weighting operational throughput (tires installed per bay per day, labor productivity), margin quality (tire vs. service gross margin, wholesale cost as percent of retail), and revenue durability (fleet mix, same-store comps) against 2027 benchmarks from Monro, Mavis, Discount Tire, Les Schwab, and Pomp's. Attach-rate metrics (alignment, brake) received the heaviest weight because service margin, not tire margin, decides store profitability.
We deliberately ignored generic SaaS metrics like MRR, NRR, and CAC payback, which have no operational meaning in a bay-constrained, physical-throughput business. We also excluded simple unit sales volume, raw ticket counts, and total revenue without comps, because each masks the real drivers: bay-minutes consumed, attach performance, and whether growth came from new stores rather than existing ones.
What to look for
What matters most is whether a KPI ties directly to a controllable lever: bay throughput, attach rate, wholesale cost, or fleet DSO. The best operators pick six numbers, post them daily, and tie counter-staff bonuses to alignment and brake attach. Cadence beats comprehensiveness; a weekly wholesale-cost review on your top 40 SKUs prevents silent margin drift from quarterly manufacturer program resets.
The mistake most buyers make is adopting a bloated dashboard that reports blended gross margin and total revenue, hiding that tires alone lose money and that growth came from new openings. A second common error is counting alignment checks or tickets instead of actual sold alignments and tires, which inflates perceived performance and delays intervention until comps turn negative for two quarters.
Related questions
How do I calculate tires installed per bay per day?
Divide total tires mounted and balanced in a day by active bays, adjusting for open hours. A healthy independent runs 8-12 tires per bay per day on a 10-hour shift; Discount Tire flagships hit 14-18. Below 6 signals broken demand or scheduling. Count tires, not tickets, because a 1-tire repair and a 4-tire sale consume very different bay-minutes.
What alignment attach rate should a tire shop target in 2027?
Best-in-class operators hit 38-45% alignment attach on 4-tire sales; the industry median sits at 18-22%, and undertrained counter staff run 8-12%. Every point of attach on a 2,000-ticket-per-month store is worth roughly $2,400 in incremental monthly gross profit. Les Schwab is benchmarked above 40% using a free alignment check at every tire purchase.
Why does wholesale cost as percent of retail matter more than gross margin dollars?
Retail tire prices are publicly comparison-shopped on TireRack and Discount Tire Direct, so pricing power is minimal; the only real lever is buying better. Healthy independents land tires at 68-72% of retail, strong multi-store operators at 62-66%. Tracking percent catches slow 30-cent-per-tire drift when Michelin and Goodyear programs reset quarterly.
What is a healthy labor productivity ratio for tire technicians?
Strong operators hit 115-135% billed hours versus clock hours, with technicians on flat-rate pay. The median independent sits at 78-88%, and anything under 70% signals soft demand or chronic comeback rework. Exclude non-billable lot time like moving cars and sweeping bays, or you will disguise a real productivity problem behind inflated denominators.
How should I split tire gross margin from service gross margin?
Track them separately: tire GM runs 25-32%, service GM runs 55-65%, and a blended GM under 38% almost certainly means under-attached service. Monro's fiscal 2023 blended print of 33.4% roughly reflects 30% tires plus 55% service on a 65/35 revenue split. Reporting one blended number to ownership hides that tires alone may be losing money.
What fleet account revenue mix is healthy for a tire shop?
Retail-first operators run 5-12% fleet mix; commercial-tilted stores run 25-40%; pure commercial truck-tire dealers exceed 60%. Pomp's Tire Service runs roughly 45% commercial. Chasing fleet accounts on net-60 terms without tracking DSO is dangerous, because fleet revenue taking 75+ days to collect can eat the margin twice through cost of capital.
What same-store sales growth should a mature tire shop expect?
A healthy mature store grows 3-6% same-store in a steady market; a turnaround store grows 8-12%. Negative comps for two consecutive quarters is a leading indicator that intervention is needed before the store bleeds further. Monro has publicly reported negative comps and framed strategy around reversing that trend, making comps the key durability signal.
What is the biggest mistake tire shops make when measuring KPIs?
Reporting blended gross margin and total revenue only. That combination hides two fatal facts: tires may be running 25% margin when they should run 30%, and revenue growth may come entirely from new store openings rather than existing locations. Track tire GM, service GM, and same-store comps separately, or the dashboard will look healthy while the core store deteriorates.
FAQ
What is the most important KPI for a tire shop in 2027?
Tires installed per bay per day is the single most critical operational metric. It directly measures how efficiently you use your most expensive asset, service bays, and typically ranges from 8-12 per bay per day in high-performing shops. Anything below 6 often signals underutilized labor, weak demand, or poor scheduling workflow.
How do I calculate alignment attach rate and why does it matter?
Alignment attach rate is the percentage of 4-tire jobs that also include an alignment service. Top shops aim for 38-45% attachment, since alignments carry 55-65% gross margins and boost average ticket by $80-$150. It matters because it turns a low-margin tire sale into a high-margin service event on the same visit.
What is a healthy average ticket for a tire shop in 2027?
A strong average ticket typically falls between $420 and $640, depending on your mix of tire brands and service add-ons. Tire-focused independents run $420-510; tire-plus-service shops with strong attach push $520-640. Shops hitting the upper end usually sell premium tires and attach alignments, brakes, or TPMS services on most jobs.
Should I focus on retail or fleet customers for better profitability?
Both matter, but fleet accounts provide steadier volume and predictable revenue. A healthy fleet account revenue mix is 20-35% of total sales; going much higher can compress margins since fleets negotiate harder. The best shops balance retail walk-ins with a few loyal fleet contracts and track DSO on every fleet account.
What is a reasonable gross margin target for tires alone versus services?
Tire-only gross margins typically run 25-32%, while attached services like alignments, brake work, and TPMS repairs run 55-65%. The overall blended gross margin for a successful shop should be 33-40%, with the service mix pulling the average up from the tire-only baseline. Monro printed 33.4% blended in fiscal 2023.
How many locations or sales volume should a typical independent tire shop aim for?
The Modern Tire Dealer average for a typical independent is around 26 stores with $3.6 million average sales per location. For a single-store operator, clearing $1.0-$1.2 million in annual revenue is a solid benchmark; anything materially below $800,000 suggests room for improvement in throughput, attach, or wholesale cost performance.
How often should a tire shop review its KPIs?
Daily for tires per bay, average ticket, and labor productivity, posted at the morning huddle. Weekly for alignment attach, brake attach, and fleet revenue mix. Monthly for wholesale cost percent of retail, tire versus service gross margin split, and store P&L. Quarterly for same-store comps, fleet churn, and DSO.
What brake attach rate should a tire shop target?
Strong operators hit 15-22% brake attach on tickets that touch wheels off; Monro's consolidated service mix implies roughly 18%. Independents commonly hit only 6-9% because they lack a standardized digital vehicle inspection workflow. Mavis drove brake attach into the high teens after mandating wheels-off brake measurement logged in Tekmetric.
How do I stop wholesale cost drift from eroding margin?
Reconcile wholesale cost as percent of retail on your top 40 SKUs monthly, not quarterly. Michelin and Goodyear dealer programs reset quarterly, and using stale cost overstates margin by 2-4 points. Audit pricing against ATD's live cost feed and reset retail on any SKU running under 30% gross margin before the drift compounds.
What is a good 90-day plan to fix underperforming tire shop KPIs?
Days 0-30: install Tekmetric or Mitchell1 with DVI, post a daily KPI board, reconcile wholesale-of-retail on top SKUs. Days 31-60: mandate printed alignment quotes and wheels-off brake measurement, tie counter bonuses to attach rates. Days 61-90: audit pricing, reset sub-30% margin SKUs, and track same-store comps monthly.
Sources
- https://www.tirebusiness.com/
- https://www.moderntiredealer.com/
- https://www.tirereview.com/
- https://www.monro.com/
- https://www.mavis.com/
- https://www.discounttire.com/
- https://www.lesschwab.com/
- https://www.pompstire.com/
- https://www.atd.com/
- https://www.hunter.com/
Related on PULSE
- [More kpis for tire shops rankings and buying guides](/knowledge)
- [PULSE Tools and calculators](/tools)
- [Everything on PULSE RevOps](/)
This page will be disappearing soon. Save it to your device for $1 — or read it free while it is here.
@Kory-White- · if Venmo asks, the last 4 of my number are 2012
 pulse-industry-kpisTop 10 KPIs for Dental Practices in 2027
 pulse-industry-kpisTop 10 Sales KPIs for Commercial Law Firm in 2027
 pulse-industry-kpisTop 10 Sales KPIs for Commercial Window and Glazing Contracting in 2027
 pulse-industry-kpisTop 10 KPIs for Pest Control Companies in 2027
 pulse-industry-kpisTop 10 Sales KPIs for Commercial Office Supplies Distribution in 2027
 pulse-industry-kpisTop 10 Sales KPIs for Cybersecurity Software in 2027
 pulse-industry-kpisTop 10 KPIs for Moving Companies in 2027
 pulse-industry-kpisTop 10 KPIs for Self-Storage Facilities in 2027
 pulse-industry-kpisTop 10 Sales KPIs for Commercial Optometry Practice in 2027
 pulse-industry-kpisTop 10 Sales KPIs for Managed Detection & Response (MDR) Security Services in 2027