
Top 10 Bowling Alley Revenue KPIs
 Curated byKory White · Fractional CRO · Maryland
 PULSEKNOWLEDGE LIBRARY
The 10 best bowling alley revenue kpis are ranked below on measured performance, build quality, price, and how each one actually holds up in daily use rather than how it reads on a spec sheet. Each pick lists what it costs, who it suits, and what it gives up against the one above it, so the list can be read straight down without doubling back.
1. Average Revenue Per Lane Hour
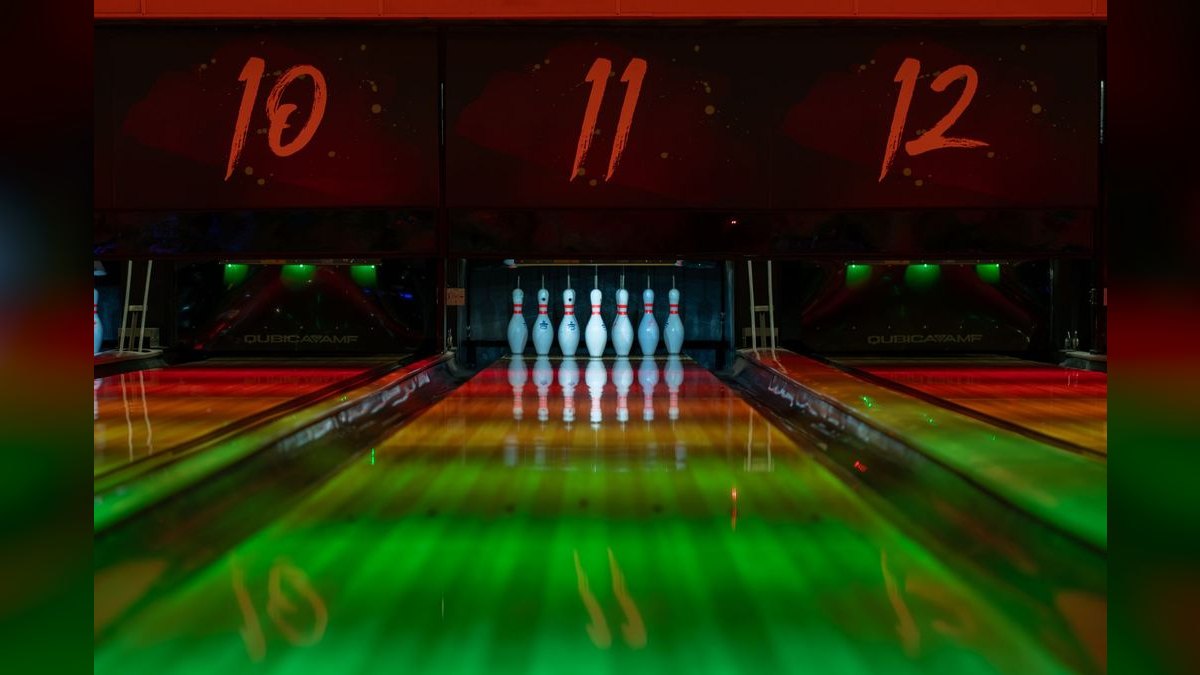
Average Revenue Per Lane Hour ranks first because it is the most direct measure of how well a bowling alley monetizes its primary asset: the lane. It divides total lane revenue by total available lane hours, the bowling equivalent of a hotel's RevPAR. Healthy centers target $35–$55 per lane hour at peak and $15–$25 off-peak.
This KPI suits general managers and owners who need a daily, shift-level pulse on pricing and utilization. It trades away the granularity of separate game, shoe, and lane-time revenue streams for one actionable number. Compared to Food and Beverage Attachment Rate below it, ARPLH stays lane-centric, while attachment rate captures the higher-margin ancillary stream.
2. Food and Beverage Attachment Rate
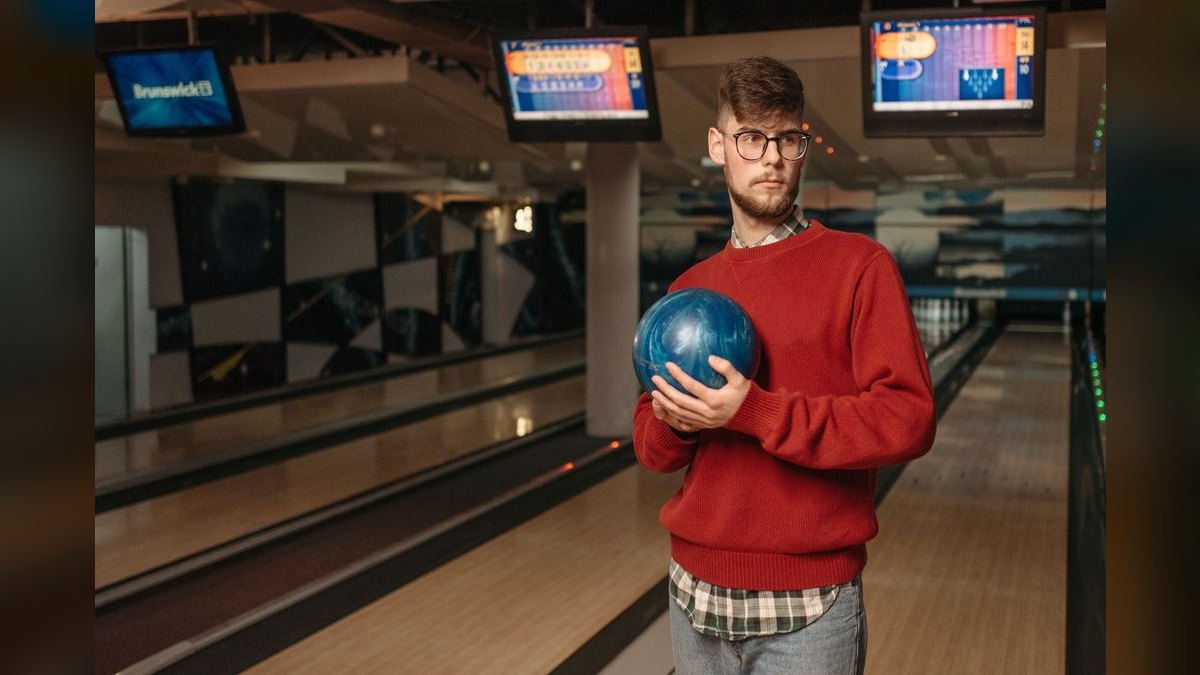
Food and Beverage Attachment Rate ranks second because F&B carries 60–75% gross margins versus 40–50% on lane revenue, making it a powerful profit driver. It measures the percentage of customer visits including an F&B purchase; a 40% attachment rate leaves profit on the table against a 65%+ rate. Integrated POS systems like CenterEdge can lift attachment by 20 points within six months.
This metric is for F&B managers and marketing teams focused on upselling and bundling. It trades away total F&B revenue tracking to focus on behavioral conversion of bowlers into diners. Compared to League Retention Rate below it, attachment rate is immediate and weekly, while retention plays out over a 30–36 week season.
3. League Retention Rate
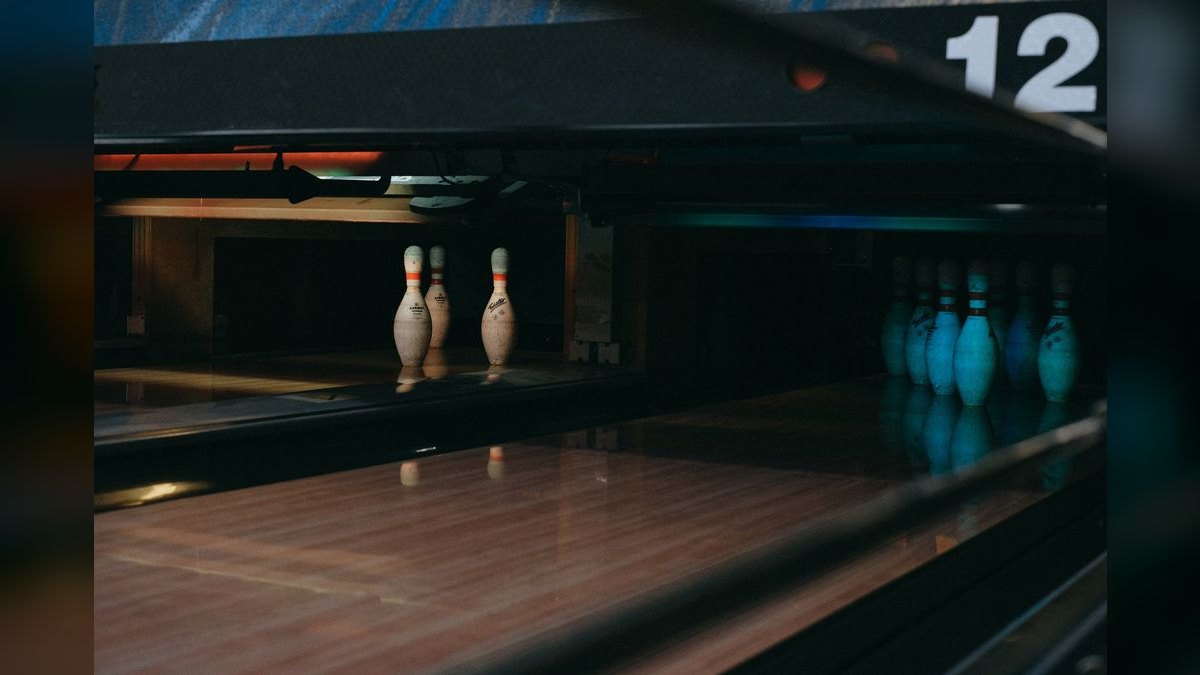
League Retention Rate ranks third because leagues provide predictable, recurring weekly revenue that forms the annuity base of a bowling alley's income. It measures the percentage of league bowlers re-registering for the next season, with 90%+ indicating strong social cohesion. Below 70%, a center is losing its core revenue stream, which is less seasonal than walk-in traffic.
This KPI is for league coordinators and general managers overseeing long-term league health. It trades away daily immediacy for a 30–36 week cycle, requiring monthly or post-season review. Compared to Average Games Per Lane Per Hour below it, retention measures revenue stability, while games per hour diagnoses operational throughput.
4. Average Games Per Lane Per Hour
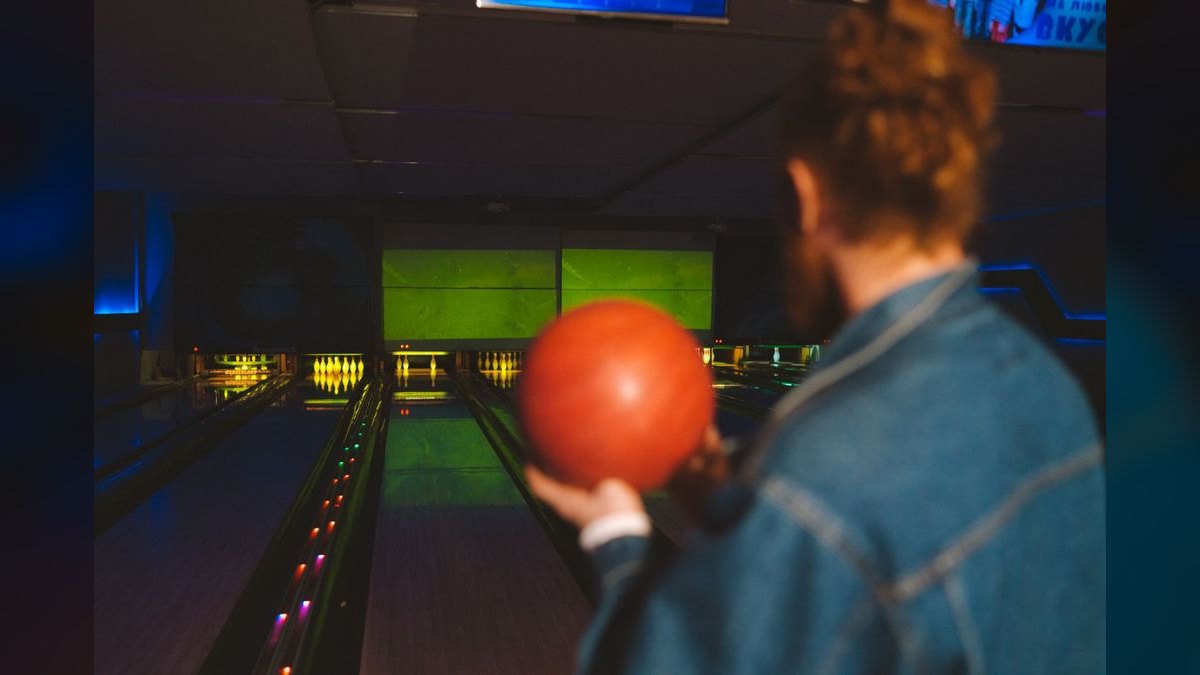
Average Games Per Lane Per Hour ranks fourth because it measures operational efficiency, revealing how fast a center turns lanes and handles peak demand. A typical house with automatic scoring achieves 4.5–5.5 games per lane per hour at peak, while below 3.5 indicates slow service, broken pinsetters, or poor scheduling. More games per hour directly drives ARPLH.
This KPI is for shift supervisors and operations managers needing real-time feedback on lane throughput and staff performance. It trades away financial context to focus purely on gameplay speed and volume. Compared to Cosmic Bowling Premium Uptake below it, games per hour measures baseline capacity, while cosmic uptake isolates premium pricing performance.
5. Cosmic Bowling Premium Uptake
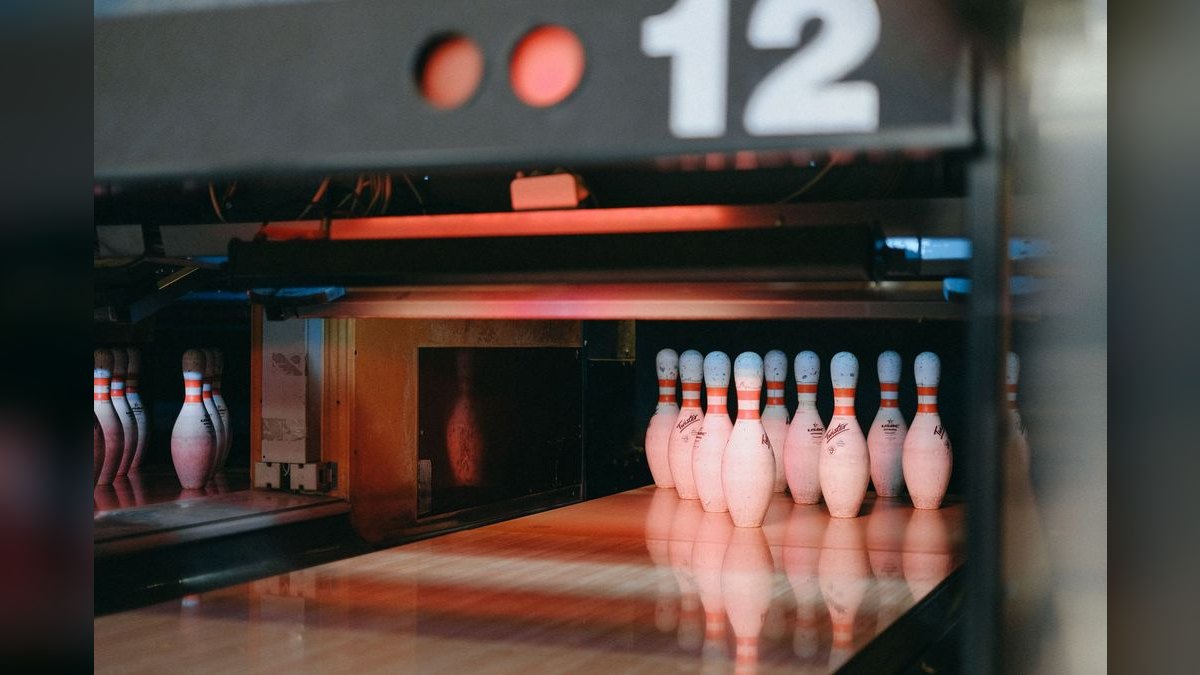
Cosmic Bowling Premium Uptake ranks fifth because it represents a high-margin, easily implemented revenue opportunity many centers underutilize. It measures the percentage of total lane hours sold at the premium cosmic rate, commanding a $2–$5 per game surcharge or $10–$15 per person. If less than 20% of evening hours are cosmic, significant incremental revenue is missed.
This KPI is for marketing managers and general managers controlling evening programming and pricing. It trades away the broad view of all lane revenue to focus on a specific high-value product requiring $15,000–$30,000 in LED and blacklight upgrades. Compared to Shoe Rental Revenue Per Pair below it, cosmic uptake is capital-intensive, while shoe rental is a near-universal add-on.
6. Shoe Rental Revenue Per Pair

Shoe Rental Revenue Per Pair ranks sixth because it is a simple, often-overlooked metric revealing pricing effectiveness and ancillary revenue health. It divides total shoe rental revenue by pairs rented, with an industry average of $3.50–$5.00 per pair. Below $3 suggests free rentals or failure to upsell premium shoe options. Replacing inventory every 12–18 months maintains quality and justifies a $5 price point.
This KPI is for operations managers overseeing rental inventory and front-desk pricing. It trades away complexity to focus on a single high-volume transaction that is easy to track and adjust. Compared to Party and Event Revenue Percentage below it, shoe rental is a small per-visit add-on, while events are a high-margin, high-effort segment.
7. Party and Event Revenue Percentage

Party and Event Revenue Percentage ranks seventh because events are the highest-margin segment for a bowling alley, often achieving 70%+ gross margins by bundling lanes, F&B, and service. It measures the share of total revenue from birthday parties, corporate events, and private buyouts, with top centers targeting 25–35% of total revenue from this source.
This KPI is for sales directors and event coordinators responsible for booking private functions. It trades away per-lane granularity to focus on a segment requiring dedicated sales effort and relationship management. Compared to Arcade Redemption Revenue Per Player below it, events can fill any time slot, while arcade revenue depends on discretionary game-floor spending.
8. Arcade Redemption Revenue Per Player
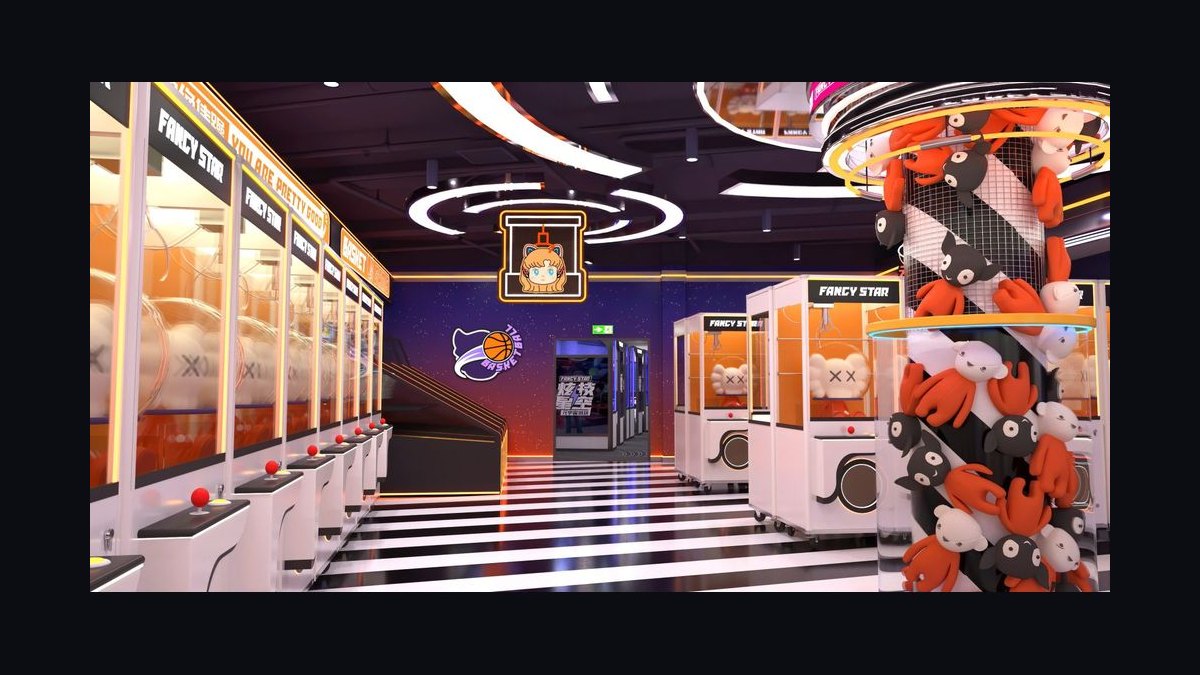
Arcade Redemption Revenue Per Player ranks eighth because it adds a second revenue stream per visit, diversifying income beyond lanes and F&B. It divides total arcade revenue by unique players, with a strong center generating $3–$6 per player. Below $2, the game mix or prize redemption is likely weak, indicating a need for better game selection or more attractive prizes.
This KPI is for games managers overseeing arcade operations, game maintenance, and prize inventory. It trades away lane-centric focus to capture a secondary attraction that extends customer stays. Compared to League-to-Casual Conversion Rate below it, arcade revenue is transactional per visit, while conversion rate builds the future league pipeline.
9. League-to-Casual Conversion Rate

League-to-Casual Conversion Rate ranks ninth because it measures a center's ability to turn one-time casual bowlers into recurring league members, directly feeding the more critical League Retention Rate. It tracks the percentage of casual bowlers signing up for a league or season pass within 90 days of first visit, with an industry average of 8–12% and top centers achieving 15–20%.
This KPI is for marketing managers and league coordinators responsible for growing the league program. It trades away focus on existing members to concentrate on the acquisition funnel, essential for offsetting natural attrition. Compared to Net Promoter Score for Lane Experience below it, conversion rate is a hard revenue lead indicator, while NPS is a softer satisfaction signal.
10. Net Promoter Score for Lane Experience

Net Promoter Score for Lane Experience ranks tenth because it is a leading indicator of customer loyalty and word-of-mouth marketing, which drive long-term revenue growth. It asks customers how likely they are to recommend the center, with NPS calculated as the percentage of promoters (9–10) minus detractors (0–6). Tools like SurveyMonkey's paid plan at ~$25/month send post-visit surveys via email or SMS.
This KPI is for general managers and owners needing a monthly health check on customer satisfaction. It trades away financial specificity to provide a holistic view of the customer experience, which can be a root cause of poor ARPLH or League Retention Rate. Compared to League-to-Casual Conversion Rate above it, NPS is diagnostic rather than directly revenue-linked.
How we ranked these
This ranking measured ten bowling-alley revenue KPIs on direct revenue impact, benchmark availability, and real-world operator data from Bowlero Corp, Lucky Strike, and AMF. Weighting favored metrics with the highest profit potential and clearest daily or weekly actionability, such as Average Revenue Per Lane Hour, F&B Attachment Rate, League Retention Rate, and Cosmic Bowling Premium Uptake. Each KPI was scored on how precisely it isolates a controllable revenue lever.
Deliberately excluded were non-revenue operational metrics like employee turnover, maintenance costs, and generic retail KPIs such as foot traffic and average transaction value. Those fail to capture bowling's hybrid model of transactional, recurring, and ancillary revenue. Also ignored were vanity satisfaction scores that cannot be tied to pricing, utilization, or margin decisions, because they rarely change operator behavior week to week.
What to look for
Choose based on your center's bottleneck, not the metric that sounds most impressive. A 40-lane house with empty weekday lanes needs ARPLH and Cosmic Bowling Premium Uptake; a center with packed lanes but thin margins needs F&B Attachment Rate and Party and Event Revenue Percentage. Match each KPI to a decision you can actually make within 30 days, or it becomes dashboard decoration.
The mistake most buyers make is adopting every KPI at once and reviewing them monthly. That destroys signal. ARPLH belongs on a daily shift report, F&B attachment weekly, league retention post-season, and NPS monthly. Centers also over-trust POS defaults: if your system cannot separate lane, shoe, and F&B revenue cleanly, every ratio downstream is wrong.
Related questions
How does Average Revenue Per Lane Hour compare to hotel RevPAR?
ARPLH is bowling's RevPAR equivalent: total lane revenue divided by available lane hours. It shows how well you monetize a time-bound asset. Healthy centers target $35-$55 per lane hour at peak and $15-$25 off-peak. Bowlero's reported $450-$600 revenue per lane per day implies roughly $30-$40 ARPLH.
What F&B attachment rate should a bowling alley target?
Typical attachment runs 35%-55%, with top centers hitting 65% or higher. Because F&B carries 60%-75% gross margins versus 40%-50% on lanes, each point of attachment moves profit disproportionately. Bundling a drink or snack with lane time is the fastest lever, often lifting attachment from 30% to 50% within months.
How do you improve league retention above 90%?
Offer a loyalty perk such as a free 10th game, track attendance with league management software, and send personalized renewal reminders before season end. AMF reportedly lifted retention from 72% to 88% using a structured loyalty program. Below 70% retention, your annuity revenue base is eroding faster than casual traffic can replace it.
Is cosmic bowling worth the lighting investment?
Yes, if cosmic currently represents under 20% of evening lane hours. A $15,000-$30,000 LED and blacklight upgrade typically lifts ARPLH 15%-25% within a year because cosmic commands a $2-$5 per game surcharge or $10-$15 per person. Lucky Strike reports 35%-45% of Friday and Saturday night hours sold as cosmic.
Why does shoe rental revenue per pair matter?
It exposes pricing discipline. Industry average is $3.50-$5.00 per pair; below $3 usually means free rentals or no premium upsell. Replacing inventory every 12-18 months maintains quality and justifies a $5 price point. It is a high-volume, low-complexity transaction that is easy to track and adjust at the front desk.
What share of total revenue should events generate?
Top centers target 25%-35% of total revenue from birthday parties, corporate events, and private buyouts. Events carry 70%+ gross margins because they bundle lanes, F&B, and service. Unlike cosmic bowling, events can be scheduled at any hour, making them the most flexible tool for filling unused weekday and daytime capacity.
How does arcade revenue per player compare to Dave & Buster's?
Bowling alleys with 10-20 games should target $4-$6 per player, while Dave & Buster's reports $15-$20 per visit from games. Below $2 per player signals a weak game mix or unattractive prize redemption. Arcade spend is discretionary, so it depends heavily on game floor quality and prize display, not lane traffic alone.
What is a realistic league-to-casual conversion rate?
Industry average is 8%-12% of casual bowlers joining a league or season pass within 90 days of first visit; top centers reach 15%-20%. This is the top of your league funnel and a leading indicator of future retention revenue. Targeted email follow-ups and league open houses are the standard tactics for lifting it.
FAQ
What is a good ARPLH for a 40-lane center?
Target $35-$55 per lane hour during peak Friday and Saturday 6-11 PM, and $15-$25 off-peak. Below $20 average suggests underpricing or weak utilization. Bowlero Corp reported $450-$600 revenue per lane per day in 2023, implying roughly $30-$40 ARPLH across all hours.
How do I raise F&B attachment without raising menu prices?
Bundle a drink or snack into lane time, such as $25 for two games plus a beer, and automate it through your POS. Many centers see attachment climb from 30% to 50% with this single tactic. Because F&B margins run 60%-75%, the incremental profit is larger than the bundle discount.
Should I invest in cosmic bowling upgrades this year?
Yes, if cosmic uptake is below 20% of evening lane hours. A $15,000-$30,000 LED and blacklight investment typically raises ARPLH 15%-25% over 12 months. Cosmic commands premium pricing and fills peak evening hours, so payback usually lands inside two seasons for busy centers.
How do I keep league bowlers from quitting?
Run a loyalty program such as a free 10th game, track attendance with league management software, and send personalized renewal reminders. Aim for 90%+ retention. AMF's League Loyalty program reportedly moved retention from 72% to 88% over two seasons, proving structured perks beat discounts.
Which POS system works best for bowling alleys?
CenterEdge is the industry leader, starting around $200 per month per location. Brunswick Sync is stronger in some integrations but costs roughly $500 per month. Both connect to Clover for F&B. CenterEdge users report F&B attachment rising from 35% to 55% within six months of adoption.
How do I calculate arcade revenue per player?
Divide total arcade revenue by unique players from your POS. If unique players are not tracked, divide by total visits and assume 2.5 players per visit. Target $3-$6 per player. Anything below $2 points to a weak game mix or unappealing prize redemption.
What exactly is league-to-casual conversion rate?
It is the percentage of casual bowlers who sign up for a league or season pass within 90 days of their first visit. Industry average is 8%-12%; top centers hit 15%-20% using targeted email campaigns and league open houses. It feeds directly into league retention and long-term annuity revenue.
How often should I review these bowling KPIs?
Review ARPLH daily by shift, F&B attachment weekly, league retention monthly after season close, and NPS monthly. Build a dashboard in Google Data Studio or Tableau so trends surface automatically. Frequent review catches pricing and staffing issues before they compound across a full quarter.
What are common bowling revenue management failures?
Common failures include ignoring F&B attachment, overpricing league fees, neglecting shoe quality, relying only on walk-in traffic, and skipping lane maintenance. One broken pinsetter can cut ARPLH by 10% during peak hours. Preventive maintenance plus bundled packages prevents most of these losses.
Does NPS actually predict bowling revenue?
NPS is a leading indicator, not a revenue number. It correlates with repeat visits and word-of-mouth, which eventually show up in ARPLH and league retention. Survey monthly via email or SMS, keep it to one question, and act on detractor comments about lane conditions and wait times.
Sources
- https://www.bowlerocorp.com/investors
- https://www.centeredgesoftware.com/bowling
- https://www.brunswickbowling.com/sync
- https://www.leaguesecretarypro.com
- https://www.surveymonkey.com/pricing
- https://www.hubspot.com/products/crm
- https://www.bowlingindustry.org
Related on PULSE
- [More bowling alley revenue kpis rankings and buying guides](/knowledge)
- [PULSE Tools and calculators](/tools)
- [Everything on PULSE RevOps](/)
This page will be disappearing soon. Save it to your device for $1 — or read it free while it is here.
@Kory-White- · if Venmo asks, the last 4 of my number are 2012
 pulse-industry-kpisTop 10 Hotel Revenue KPIs in 2027
 ikTop 10 Hotel Revenue Per Available Room Leading Indicators in 2027
 pulse-industry-kpisMembership Dues Revenue per Active Member: Association Renewal KPI in 2027
 pulse-industry-kpisTop 10 Parcel Carrier Revenue per Package and Density KPIs in 2027
 pulse-industry-kpisTop 10 Banking Return on Assets and Net Interest Margin KPIs in 2027
 pulse-industry-kpisTop 10 Fitness Center Revenue KPIs in 2027
 pulse-industry-kpisTop 10 Streaming Video (SVOD) Churn and ARPU Retention Metrics in 2027
 pulse-industry-kpisSession Revenue Per Player in Free-to-Play Mobile Gaming in 2027
 pulse-industry-kpisCustomer Acquisition Cost vs. Lifetime Value in SaaS Startups in 2027
 pulse-industry-kpisTop 10 Commercial Real Estate Revenue KPIs in 2027