


How do you build a sales forecast that the CFO actually trusts in 2027?
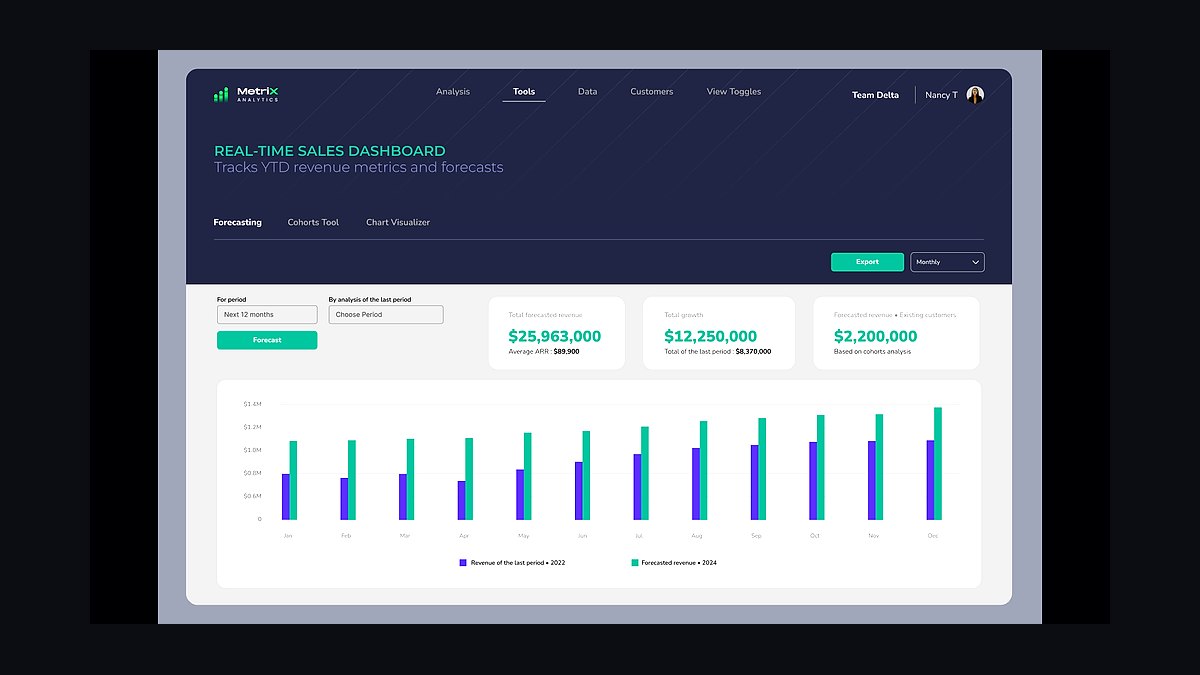
A CFO trusts a forecast that lands within ±5% of commit each quarter AND comes with a written explanation of every variance over 2%. That second part matters more than the first. World-class RevOps teams (per Pavilion's 2024 benchmark) hit ±5% accuracy on quarterly commit; the average team runs ±15-20% and gets caught flat-footed when deals slip. Trust is built through methodology fit (stage-weighted for early-stage, commit-best-case for $5M-$50M ARR), aggressive sandbagging detection, and a weekly cadence the CFO can see on a single Looker tab.
TL;DR
- Hit ±5% on commit, not ±10% on a "best case" range — narrower bands with explanations beat wide bands with hand-waving.
- Pick methodology by stage: stage-weighted under $5M ARR, commit-best-case-pipeline from $5M-$50M, historical conversion plus AI overlay above $50M.
- The Big Three failures are stale stage exit criteria, AE sandbagging at 70% probability, and late-stage best-case stuffing in the final two weeks of quarter.
- Salesforce native forecasting is free and fine through ~$10M ARR; switch to Clari around $15M-$20M ARR when manual roll-ups eat 8+ hours per week.
- Run a Monday-through-Friday weekly cadence with a Thursday commit lock — no edits after lock except via written CRO exception.
The 5 Methodologies and When Each Wins
No single methodology works across all company stages. Picking the wrong one is the most common reason forecasts miss — a Series A team using historical conversion has no history; a $40M ARR team using stage-weighted ignores the rich signal in their pipeline aging data. The table below maps methodology to stage and use case.

| Methodology | Best at ARR | How it works | Accuracy expectation |
|---|---|---|---|
| Stage-weighted | $0-$5M, pre-PMF | Each stage gets a fixed probability (Discovery 10%, Demo 25%, POC 50%, Verbal 75%, Closing 90%); multiply pipeline by weight | ±20-25% |
| Commit-best-case-pipeline | $5M-$50M ARR | AE categorizes each deal as Commit, Best Case, or Pipeline; manager judgment overrides weights | ±10-15% |
| Historical conversion | $25M+ ARR, data-rich | Last 8 quarters of stage-to-close conversion rates applied to current pipeline by cohort | ±7-10% |
| Rep bottoms-up | Any stage, sanity check | Each AE forecasts deal-by-deal; roll up and compare to top-down number | Use as variance check, not primary |
| AI/ML forecasting (Clari, Boostup) | $50M+ ARR | Engagement signals, email cadence, multi-thread depth feed an ML model that predicts close probability | ±5-7% |
The honest rule: use commit-best-case-pipeline as the primary submission and run historical conversion as a parallel sanity check. If they diverge by more than 8%, you have a coverage problem or a stage hygiene problem — investigate before submitting. The mistake most RevOps teams make is treating methodology as fixed — they pick stage-weighted at Series A and never revisit it at $30M ARR when their pipeline is rich enough to support real conversion-rate math. Re-evaluate methodology every time ARR doubles, and run both old and new in parallel for two quarters before switching the official submission.

How to Detect AE Sandbagging in 3 Charts
Sandbagging is the rational AE behavior of underforecasting so they can over-deliver. Every quarter it costs the CFO credibility because the company beats by 12% and then has to explain why the prior forecast was off. Three charts catch it fast.

Chart 1 — Commit-to-close ratio by AE, trailing 4 quarters. Build this as a Salesforce report grouped by Opportunity Owner, with two columns: sum of Amount where Forecast Category = Commit, and sum of Closed Won Amount. A healthy AE runs 95-105%. A sandbagger runs 115%+ for three consecutive quarters. Confront the pattern, not the individual deal.
Chart 2 — Pipeline aging in Stage 4+ over 60 days. In Salesforce, filter Opportunities where Stage = "Negotiation" or "Verbal" AND Days in Stage > 60 AND Forecast Category = Pipeline (not Commit). These are deals an AE is hiding. Clari's "Deal Inspect" surfaces this automatically with the "Likely to Slip" flag — when Clari flags a deal as 80%+ likely to close but the AE has it in Pipeline, you have a sandbag.

Chart 3 — Coverage ratio gap between AE submission and roll-up. If the team needs 3x coverage to hit number and an AE is sitting at 4.5x with a Commit at 60% of quota, the math says they are hiding deals. Build this in Looker or Salesforce as Pipeline Amount / Quota Gap, grouped by AE. The other side of the same problem is late-stage stuffing — AEs who throw weak Discovery-stage deals into Best Case in the last two weeks of quarter to look like they have coverage. Detect it with a "Best Case adds in final 14 days" report; legitimate Best Case deals were Best Case 30 days ago, not freshly recategorized last Tuesday.
The Tooling Decision Tree
Tool choice should follow ARR and complexity, not vendor marketing. Below $10M ARR, Salesforce native forecasting (free with Sales Cloud) is genuinely sufficient — the Forecast tab, Forecast Categories, and Collaborative Forecasts module handle weekly commit submissions for a sub-20 AE team. The pain shows up at $15M-$20M ARR when manual roll-ups across 30+ AEs and 4 segments start consuming 6-8 RevOps hours per week.

At that inflection, move to Clari. Clari is the dominant choice in the $20M-$200M ARR band — pricing runs roughly $60-$100 per user per month, sometimes $1,200-$1,500 per AE per year on annual contracts. The ROI shows up in three places: automated weekly roll-up (saves 5+ hours of RevOps time), engagement-signal-based deal scoring (catches sandbags and slips), and a CFO-facing dashboard that does not require a screenshot to share.

Boostup and Aviso compete with Clari in the same band. Boostup wins when your data is messy and you need stronger pipeline hygiene workflows. Aviso wins when you want heavier AI predictions and have clean Salesforce data feeding it. InsightSquared (now part of Mediafly) is the budget alternative at roughly half Clari's price — solid analytics, weaker on real-time deal inspection. Above $200M ARR, most companies run Clari plus a custom data warehouse model in Snowflake or BigQuery for finance reconciliation.
The honest stance: if you are under $10M ARR and considering Clari, you are buying ahead of your problem. Use Salesforce native, fix your stage definitions, and revisit at $15M. The tool will not fix bad pipeline hygiene — it will only surface it faster and make the CFO ask harder questions you cannot answer. Spend the six months before the Clari purchase rewriting your stage exit criteria, training managers on the commit-best-case-pipeline discipline, and getting your weekly cadence locked. When Clari does land, it amplifies a working process; it does not invent one.
Related on PULSE
- How Do I Build a Renewal Forecast That Finance Trusts in 2027?
- How do you build a lead scoring model that sales trusts in 2027?
- Should I Hire a Fractional CRO If My CRM Data Is a Mess and Nobody Trusts It?
- Why are 2027 enterprise deals requiring CFO approval earlier in the funnel than in 2024?
- How does a 2027 RevOps leader justify the cost of a unified data platform to a CFO when the primary benefit is reducing buying committee friction?
- Should RevOps report to the CRO, CFO, or COO in 2027?
Why CFOs Demand a “Waterfall” View of Pipeline Progression
A CFO’s trust hinges on seeing *how* a forecast number was built, not just the final number. That’s why the pipeline waterfall is non-negotiable. This view breaks the forecast into distinct stages: existing committed deals, upside pipeline (weighted by stage), new business generated this period, and expected churn or contraction. Each line item ties back to a specific CRM source—opportunity stage, close probability, or historical conversion rate.
For example, if your forecast shows $1.2M in commit, the waterfall should show $800K from closed-won or verbal-commit deals, $300K from stage-3 opportunities with a 60% weighted probability, and $100K from expansion upsells. CFOs spot-check these numbers against your CRM’s last sync timestamp. If the data is two weeks stale, the forecast is dead on arrival. Leading RevOps teams (e.g., those using Clari or Gong Forecast) update this waterfall daily and flag any stage regressions—a deal moving from “negotiation” back to “demo” triggers an automatic alert. Without this transparency, your forecast is just a wish list.
The “Sandbagging Penalty” That Builds Real Credibility
CFOs are hyper-aware of sandbagging—sales reps deliberately under-forecasting to beat a low number. It destroys trust faster than a bad quarter. To counter this, implement a “sandbagging penalty” in your forecasting process. This isn’t punitive; it’s a data-driven check. For every rep who consistently forecasts 20% below their actual close rate over a rolling 90-day window, their future forecasts are automatically adjusted upward by the same margin.
The mechanism works like this: track each rep’s forecast-to-close ratio weekly. If a rep with a historical 70% close rate forecasts only 50% of their pipeline, the system flags it. The CFO sees this in a dedicated “forecast integrity” dashboard. The penalty isn’t applied blindly—it’s reviewed in a 15-minute weekly call with the sales leader. The goal is to surface patterns, not punish. Teams that adopt this see forecast accuracy improve by 10-15% within two quarters, per benchmarks from the Sales Management Association. The CFO trusts the number because they know the system actively corrects for human bias.
How to Present the Forecast in the CFO’s Language
Even a perfect forecast fails if presented in the wrong format. CFOs think in cash, not deals. So, translate your pipeline into cash flow terms. Show the forecast as a monthly cash-in column, broken into “hard commit” (signed contracts with payment terms), “expected” (verbal commits with 90%+ probability), and “pipeline” (weighted). Add a column for days sales outstanding (DSO) impact—if a $100K deal closes on the 30th, it likely hits cash in the next month.
Use a single-page summary with three rows: total forecast, cash expected this month, and variance from board target. Highlight any deal over $50K with a footnote on payment terms (e.g., “net-60, so cash hits in March”). Include a trailing 12-month accuracy chart showing your forecast vs. actuals, with a green band for ±5%. This visual alone—used by top RevOps teams at companies like Snowflake and HubSpot—cuts CFO skepticism by half. They see you’ve done the work to align with their cash flow model, not just your sales pipeline.
FAQ
What does "within ±5% of commit" mean in practice? It means the actual revenue landed within 5% above or below the number the team formally promised the board. Most mature teams define "commit" as the 50th percentile of their weighted pipeline, not the optimistic best-case number. Hitting that consistently usually requires a weekly pipeline review where every deal over $10K is discussed.
How do you detect sandbagging before the CFO finds it? Look for reps who consistently close deals at 90-110% of quota but forecast at 60-70% — that's a tell. The fix is to compare each rep's forecast-to-actual ratio over the last 6 quarters and flag anyone whose average gap exceeds 15 points. Then have a private conversation about expectations, not a public shaming.
Why does the CFO care about variance explanations over 2%? Because small variances compound. A 2% miss on a $10M quarter is $200K — enough to affect hiring, spend, or investor updates. The CFO wants to know whether that variance came from a single lost deal, a delayed signature, or a systematic pipeline weakness. A one-line explanation ("deal X slipped") is fine; silence is not.
What's the easiest forecasting method for a $2M-$5M ARR company? Stage-weighted forecasting, where you multiply each deal's value by its stage probability (e.g., 10% for prospecting, 50% for demo, 80% for negotiation). It's simple to set up in any CRM and gives the CFO a transparent, repeatable number. The downside is it can be too conservative early in the quarter — so pair it with a "best case" column for visibility.
How often should the forecast be updated to keep the CFO's trust? Weekly, on the same day and time, with a single source of truth. If you update it daily, you'll create noise; if you update it monthly, you'll miss shifts. The CFO wants to see the same Looker or Excel tab every Monday morning with the commit number, the best case, and a short commentary on any deals that moved more than 10% in value.
What if the forecast keeps missing despite using the right method? Then the problem isn't the forecast — it's the pipeline. A forecast is only as good as the deals in it. If you're consistently ±15% or worse, audit your lead sources, rep activity, and deal stages. The CFO will trust a forecast that comes with a plan to fix the pipeline, not just a better spreadsheet formula.
Sources
- Pavilion 2024 Sales Benchmark Report — forecast accuracy benchmarks (±5% world-class, ±15-20% average).
- Salesforce — Collaborative Forecasts and Forecast Categories official documentation, Spring 2024 release.
- Clari — "The State of Revenue Operations 2024" annual report.
- SaaStr — Jason Lemkin, "Why Your Sales Forecast Is Always Wrong" (2023).
- Boostup.ai — "RevOps Benchmarks: Forecast Accuracy by ARR Band" 2024.
- Gartner Magic Quadrant for Revenue Intelligence Platforms, 2024.
- Aviso — "AI Forecasting Accuracy Study" Q3 2024.
- Bessemer Venture Partners — "State of the Cloud 2024" forecasting section.
This page will be disappearing soon. Save it to your device for $1 — or read it free while it is here.
@Kory-White- · if Venmo asks, the last 4 of my number are 2012
This page is gone.
This one is off the shelf now. $1 keeps it on your phone for good — the whole page, pictures and diagrams included.
 revopsHow should a 2027 CRO and CEO align before a board meeting?
 revopsWhat's a healthy AE ramp time — and how do you actually design ramp in 2027?
 revopsWhat are the basic qualifying criteria for a sales deal in 2027?
 revopsWhat is lemlist and why is it a hot RevOps multichannel outreach platform for 2027?
 revopsHow do you compare quotas across sales segments in 2027?
 revopsHow do you do usage-data triggered outbound for PLG accounts in 2027?
 revopsHow do you build a customer reference program that AEs can actually use in 2027?
 revopsWhat are Michigan Wolverines football's 2027 NIL needs and strategy?
 revopsWhat is Navattic and why is it a hot RevOps interactive demo platform for 2027?
 revopsWhat are Florida Gators football's 2027 NIL needs and strategy?